S&P 500 correction before the global fall.S&P 500 correction before the global fall of the usa stock market.
Hey traders! I’m sure many of you have noticed that after the introduction of retaliatory tariffs, the markets started getting pretty choppy.
The S&P 500 took a serious dive.
• On the weekly chart, I’ve marked a support level + the 161.8% Fibonacci level, where we might see a bounce back to the $5680–$5800 range.
• But from there, I think we could see the start of a major crash—both in equities and crypto—that could last 1–2 years.
• Based on my estimates, the S&P 500 could drop back to 2020–2021 levels, a wide range of 2200–3000.
• For Bitcoin, we’re talking around $5000; for Ethereum, $100–$300; and for Solana, $2–$12.
3D Chart:
3W Chart:
Real-world events that could tank the stock market this hard:
Global Recession: If major economies (US, China, EU) slide into a recession at the same time—think trade wars, rampant inflation, or a debt crisis—investors will dump risky assets like hot potatoes.
Trade War Escalation: Harsher tariffs between the US and China/EU could wreck supply chains, crush corporate earnings, and spark a full-on market panic.
Geopolitical Conflict: A big blow-up—like a full-scale war or crisis (say, Taiwan or the Middle East)—could send capital fleeing to safe havens (gold, bonds), while stocks and crypto get slaughtered.
Collapse of a Major Financial Player: If a big bank or hedge fund goes bust (Lehman Brothers 2.0-style) due to an overheated market or bad debt, it could trigger a domino effect.
Energy Crisis: A spike in oil/gas prices (from sanctions or conflicts, for example) could kneecap the economy and drag risk assets down with it.
Market Bubble Burst: If the current rally turns out to be a massive bubble (and plenty of folks think it is), its pop could pull indexes down all on its own.
Looming Wars: A potential Russia-Europe war starting as early as 2025, or an Iran-Israel conflict that drags in multiple nations, could destabilize global markets, spike energy prices, and send investors running for the exits.
SPX (S&P 500 Index)

$SPY bear flag target between $387-443AMEX:SPY has been consolidating in a bear flag since April 7th. Should we break down from the flag, I can see a sharp move down to the lower support levels.
I think the most likely targets are at $443 and $409. However, it's possible we can find support at the other targets as well.
I think the move likely plays out before June. Let's see where we end up bouncing.
Invalidation of the downside would be a break over $567.

April 28, 2025 - Broken Supply Chains, and the DC CircusHello everyone, it’s April 28, 2025. The week ahead promises to be spectacular (or a complete disaster) depending on which way the wind blows out of Washington. So far, the futures are down about 0.6% this morning, as everyone’s trying to cut risk ahead of a week crammed with Big Tech earnings ( NASDAQ:AAPL , NASDAQ:MSFT , NASDAQ:AMZN , NASDAQ:META ), a mountain of macro data (PCE, GDP, ISM, jobs), and of course, the never-ending Trump tariff soap opera.
On the US politics front, Trump stayed uncharacteristically quiet over the weekend, no new bombshells. But whispers about “talks” with China surfaced, without any real confirmation. Meanwhile, several countries are supposedly rushing to negotiate tariff deals with the US. Expect headlines (and chaos) throughout the week.
Supply chains are starting to crack. Container traffic from China to the US has plunged 60%, and if deals aren’t made by mid-May, we could be staring down empty shelves and layoffs in transport and retail sectors. Think “Black Friday” without anything to buy.
Meanwhile, the drama at the Fed continues. Kevin Warsh, still salty about not replacing Powell, attacked the Fed’s “media circus” style, blaming it for post-Covid inflation. Warsh wants the Fed to go old-school: shut up, protect the dollar, and stop playing superhero. No forecasts, no endless press conferences. Just cigars and silence.
On the macro side, this week’s economic data could turn into a horror show: weak jobs numbers, soft GDP, slowing PCE, all raising the probability of recession. If that happens, expect markets to start begging the Fed to cut rates sooner rather than later.
Assets snapshot:
• BLACKBULL:WTI : $63.36
• OANDA:XAUUSD : $3,307
• INDEX:BTCUSD : $94,000
In short: expect maximum volatility, endless surprises from DC, and a market that could spin on a dime. Stay sharp, stay skeptical, and brace for anything.

Stromm | S&P 500 & NASDAQ a RESISTANCE is NearThe S&P 500 and the Nasdaq are basically moving in lockstep right now — their structures look almost identical.
Starting with the S&P 500:
We’re currently trading into a 4-hour Fair Value Gap between $5,546 and $5,634, Sitting just under a 4-hour Order Block that could trigger a short-term reaction.
At the moment, though, it doesn’t really look like we’re going to flush all the way back down toward the $5,000 level (2-hour Order Block sitting much lower).
More likely?
This 4h Order Block just gives us a brief pullback, a minor reaction — and then price pushes higher again.
This would line up perfectly with my original scenario of Wave A completing around $4,805.
Personally, I’m already positioned around $4,800, so obviously, I'd love to see that level hold and price continue moving higher — ideally heading toward $6,000.
That would be the perfect extension — but nothing is guaranteed yet.
Still, structure right now leans bullish unless we see a sudden breakdown.
Now, for the Nasdaq CME_MINI:NQ1! :
Almost the same setup —
We have a 2-hour Order Block just above the current price, acting as short-term resistance,
And another 2-hour Order Block way lower, which now seems less likely to be tested unless something drastic happens.
So for the Nasdaq, the most realistic short-term scenario:
Hit resistance at the current 2h Order Block,
Maybe a small pullback toward 18,900–19,000,
Then continuation higher toward 20,000 or even 21,000 over the next few weeks.

SPX: confusion will continueFinally some positive sentiment on the US equity markets. The S&P 500 marked a weekly gain of 4,6%, while investors are waging the relaxation of the ongoing trade tariffs war. Regardless of estimates of the future impact of imposed tariffs, the US tech companies are still posting relatively good results. The S&P 500 ended the week at the level of 5.525, which was the market low in March and beginning of April this year.
Alphabet gained 1,5% during the week, on the wings of posted relatively good results above estimates. Other big tech companies were also supported, like Tesla, Nvidia and Meta. Only on Friday, Nvidia gained 4,3%, while Tesla advanced by 9,8% within one day. Regardless of positive weekly results, it is still not time to celebrate. The news regarding trade tariffs coming from the US Administration still continues to be mixed, bringing a high level of confusion among market participants. In this sense, it could be expected that volatility on the equity markets will continue also in the future period.

$SPX Sell in May, Go Away, $5k, Dead Cat to $5.3k, $4.8k by EOMAlrighty. My forecast is as follows. I made a video explaining just a quick thought and here's the video in a written version for the most part. Basically, I'm a pattern chart trader and I spend the majority of my days looking for specific candlestick patterns that match candle for candle. I cannot find anything remotely close to today's Price Action besides October 2001. I have been and will continue to be doubted and that's okay. I am not here for anyone except myself and anyone that wants to gain a fresh unbiased perspective. People have called me a Permabear but that only pertains to my personality, which is that of a realist. I do not believe investing for the next 20-50 Years will work for everyone. You'd have to do it well and continuously contribute even during the down days. Either way. This is the analog I will be following. Fib is Extended way beyond Blow Off Top measurements imo. The market gained 50% in One Year and Three Months. I'd like to think that the uncertainty being priced in will cause these Deeper Fib Retracements. We already crashed down to the 1.61 GOLDEN POCKET from above and now bounce back to Secon Golden Pocket at 2.61. Based on the past behavior, now we move back to 2.0 for a move to the original extension of the 1.00 Fib. If we lose this, we start moving back to the 1.27 near $4.74k on SPX where I will then be looking for one final dead cat to $5300 by mid August, Every July dip being grabbed up ... Final Sell in August for an End of Year Crash to Mark 2025 as one of the worst years ever in Life as far as the Market goes. Good Luck everyone. Tips always welcome.

Weekly $SPY / $SPX Scenarios for April 28 – May 2, 2025🔮 🔮
🌍 Market-Moving News 🌍
🇺🇸 President Trump's 100th Day in Office: Wednesday marks President Trump's 100th day of his second term. His administration's protectionist tariffs continue to influence global markets and political landscapes, with notable impacts observed in Canada, Australia, and the UK.
📉 Trade Tensions and Economic Indicators: Investors are closely monitoring the effects of recent U.S. tariffs on economic performance. Key data releases this week, including GDP and employment figures, will provide insights into the economy's resilience amid these trade policies.
💼 Major Corporate Earnings: This week features earnings reports from major companies, including Apple, Amazon, Microsoft, Meta Platforms, ExxonMobil, and McDonald's. These reports will offer a glimpse into how large corporations are navigating current economic challenges.
📊 Key Data Releases 📊
📅 Monday, April 28:
🏠 Housing Vacancies and Homeownership (10:00 AM ET):
Provides data on rental and homeowner vacancy rates, offering insights into housing market dynamics.
📅 Tuesday, April 29:
📈 Advance Economic Indicators (8:30 AM ET):
Includes data on international trade in goods, wholesale inventories, and retail inventories for March.
📊 Consumer Confidence Index (10:00 AM ET):
Measures consumer sentiment regarding current and future economic conditions.
💼 JOLTS Job Openings (10:00 AM ET):
Reports the number of job openings, indicating labor market demand.
📅 Wednesday, April 30:
📈 GDP (Q1 Advance Estimate) (8:30 AM ET):
Provides an early estimate of economic growth for the first quarter.
💳 Personal Income and Outlays (10:00 AM ET):
Includes data on personal income, consumer spending, and the PCE price index, the Fed's preferred inflation measure.
🏭 Chicago PMI (9:45 AM ET):
Assesses business conditions in the Chicago region, reflecting manufacturing sector health.
📅 Thursday, May 1:
🏗️ Construction Spending (10:00 AM ET):
Reports total spending on construction projects, indicating economic activity in the sector.
📉 Initial Jobless Claims (8:30 AM ET):
Measures the number of new filings for unemployment benefits, reflecting labor market
conditions.
🏭 ISM Manufacturing PMI (10:00 AM ET):
Provides insight into the manufacturing sector's health through a survey of purchasing managers.
📅 Friday, May 2:
👷 Nonfarm Payrolls (8:30 AM ET):
Reports the number of jobs added or lost in the economy, excluding the farming sector.
📉 Unemployment Rate (8:30 AM ET):
Indicates the percentage of the labor force that is unemployed and actively seeking
employment.
🏭 Factory Orders (10:00 AM ET):
Measures the dollar level of new orders for both durable and nondurable goods, indicating manufacturing activity.
⚠️ Disclaimer: This information is for educational and informational purposes only and should not be construed as financial advice. Always consult a licensed financial advisor before making investment decisions.
📌 #trading #stockmarket #economy #news #trendtao #charting #technicalanalysis

Was this the best buying opportunity since 2011?Sure, here's a rewritten version of your text in an engaging tone:
"Have you ever heard of the Zweig Breadth Thrust? Well, let me tell you, it’s an incredible metric that can really shed some light on the current market situation!
So, what would it take for me to believe that this bounce isn't just another bear market rally? My first step would be to dive into the breadth indicators and look for signs of that elusive breadth thrust.
Think of a breadth thrust like a rocket taking off. You need a strong initial boost to break free of gravity's grip. If the thrust is weak, the rocket can’t escape, and the same applies to stock market reversals. When we see a robust breadth thrust, that's a signal that a significant reversal is underway. Without it, we could be facing another false bounce.
Now, let’s talk numbers! As of Friday, April 25th, the SPX has surged an impressive 14.2% from its recent lows, and while that’s quite a leap, it’s essential to keep it in perspective. Just think back—this index was down 21.35% from its all-time high earlier in February during the panic sell-off. Now, with the recent strength, it’s only 10.75% off its peak.
The Zweig Breadth Thrust is calculated based on the 10-day EMA of NYSE Advances divided by the sum of Advances and Declines. A bullish signal pops up when the ZBT shifts from below 0.40 to above 0.615 within just ten days or less. Keep an eye on that—it might just help us navigate these choppy waters!"
On the monthly chart, it’s clear that what we’ve been seeing in the broader economy (you know, Main Street) is actually showing us some bearish divergence—a concept I've mentioned in my previous ideas.
Since 2009, we've had four notable instances on the Monthly chart where the ZBT dipped below 0.40, only to bounce back up past the 0.6 mark. Remember back in November 2011? That was when we got a significant signal with a low reading of 0.31, which climbed back to 0.62 by February 2013. That surge sparked a bull run that peaked in February 2020!
So, the takeaway here is that this breadth thrust is generating the positive momentum we need to reach new stock market highs this year. Exciting times ahead!

BRIEFING Week #17 : AAPL's fate is the SP'sHere's your weekly update ! Brought to you each weekend with years of track-record history..
Don't forget to hit the like/follow button if you feel like this post deserves it ;)
That's the best way to support me and help pushing this content to other users.
Kindly,
Phil

S&P 500 - Key Levels and Measurements (Bonds vs Yields vs Homes)Happy Friday!!!
Starting with a BLANK chart, here are my key levels and measurements for the S&P 500
Earnings season is stable, more MAG 7 next week with AAPL, AMZN, META, MSFT
Trump and Company are softening the trade war narrative quickly and the market
is taking notice. Prices recovered nicely this week
5500 SPX is a key level for the bulls to push above - if done look for open space
melt-up into 5700-5800 resistance
If SPX rejects 5500 early next week we will be dealing with some more noise
and intermediate levels
4830 lows will be absolutely critical to maintaining a long-term bull market. You will
see why with this analysis.
Last piece is talking about bonds vs yields and the current housing market in the US
My belief is that yields stay sticky and home prices MUST drop to see any improvements
in affordability
Thanks for watching - have a great weekend!!!

Could The Stock Market Crash? - WARNING 🚨MartyBoots here , I have been trading for 17 years and sharing my thoughts on SPX .🚨
🚨 SP:SPX Could It Crash?🚨
Lets look into it deeper, very interesting chart but also a dangerous one. Need to see buyers soon or this is could be worse than people expect. 5-10% drop minimum and extreme bear could drop 40% total🚨
Watch video for more details

Nvidia Prepares For New All-Time High, Last Chance To Buy Low!The market always gives as second chance. This is a phrase that I love to share and it is true, it is confirmed here on this very chart.
The action for NVDA moved back down to produce a higher low —your second and last chance. This higher low is happening within a very strong buy-zone and this can mean the difference between massive profits or an opportunity that is lost. From here on, Nvidia will grow long-term set to produce a new All-Time High in the coming months.
The minimum target and price level for this rise stands around ~150 within 1-3 months. Then a correction and then higher, much higher... Up, up and up go we.
I can entertain you with tons of details I have the ability but I will not do so. I will go straight to the point.
» The next All-Time High and main target for this wave is 194, this can take a little more, or less, than 6 months.
What will happen next, we will have to wait to ask the chart.
It is my pleasure to write for you again.
Make sure to boost if you would like more updates.
If you boost and comment, we can move to daily updates as the market grow.
Go in, go now, buy-in and go LONG!
Nvidia is going up! Together with Bitcoin and the Altcoins.
Thanks a lot for your continued support.
Namaste.

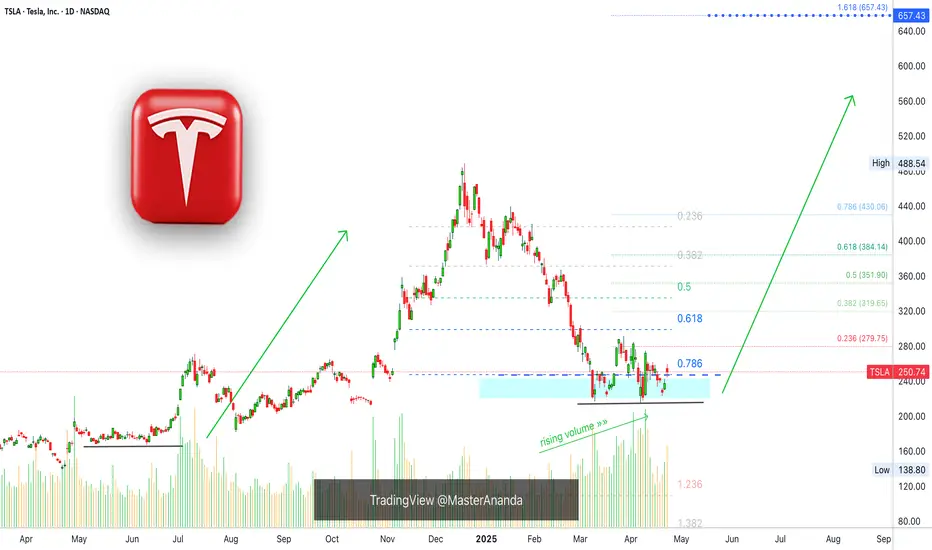
Tesla Finds Support, 657 Next Easy High & All-Time HighTesla is looking pretty good right now, support has been found. The correction amounted to -55.5%. It started in mid December 2024 and the first low was hit in March 2025.
Since March TSLA has been in the process of forming a bottom.
The action moved below 0.786 Fib. retracement level in relation to the last bullish wave. The action is back above this level now and this is pretty good. As long as the action happens above the magic blue dashed line, Tesla is good and set to grow.
This signal, perfect symmetry, is supported by rising volume.
Buy volume is rising massively as TSLA moves into a long-term support zone.
(Smart people, smart money and smart traders buy when prices are low —this volume signal reveals the highest buying in years as TSLA hits support.)
The most revealing fact from a logical standpoint is the size of the correction, a 55% correction is a lot by any standard. When a market goes through such a strong correction, it tends to reverse and produce next a new move. It moves in waves. It goes up and down, up and down. We are seeing the end of the down-move and this will automatically lead to an up-wave.
When the bottom was hit, last month, the action goes flat. Tesla was clearly moving lower but as support was found the bottom stays flat. This is another revealing signal for the logical mind. No longer a downtrend but a consolidation phase, which is part of a transition period.
» So the market was bullish and from bullish turned bearish, from bearish it went sideways and from sideways it will grow.
This is an easy buy.
Thanks a lot for your comment and continued support.
Namaste.
The Bear Is Dead. Long Live the Bull.From Fakeout to Full Send - SPX Flips Bullish
You could almost hear the financial media pop champagne today.
“Markets Surge Amid Easing Trade Tensions” they yelled.
“Global confidence returns!” they assured.
And sure, that’s a cute story.
But for us, Wednesday’s bear push now looks like a feint. A setup. A spring.
By Friday, the bull had not only taken the ball - it ran with it.
That V-shaped reversal pattern on the daily chart? It’s live. And it’s loud.
Technically, it’s now pointing to a projected upside of 6106.
That’s not just some random number. That’s the prior range high zone coming back into focus.
And in case you needed a reminder…
The bear is dead. Long live the bull. (until it isn't)
---
SPX Market View - Bullish Flip Confirmed
Wednesday gave us a classic tease.
Bearish energy. A flicker of downside. But it fizzled fast.
Then came Thursday - and with it, a clean sweep into Friday.
The V-shaped daily reversal triggered.
Price pushes off the lows
Sentiment flipped
And a new upside target emerged at 6106
It’s not just technical fluff. This level marks a structural return to the previous range highs - a natural magnet for bullish continuation.
Meanwhile, I’ve done a bit of chart housekeeping myself.
After two months of letting bias sneak in and lines and notes multiply like rabbits, I’ve hit the reset button.
🧹 Clean charts. Clean mind. Just the essentials.
The direction has changed - and I’m treating it with fresh eyes.
One line I am keeping?
5400. It’s been the pivot point for weeks. A battle-tested zone. It now serves as the bull’s first major checkpoint.
If price respects that level on any dip, it’s game on.
And if we breach it? That’s when the doubt returns.
---
💡Expert Insights: Common Trading Mistakes & How to Avoid Them
MISTAKE: Letting cluttered charts and old bias cloud current decisions.
FIX:
Regularly clean your charts — strip them down to what matters.
Use setups that speak for themselves (like the V-shape).
Don’t bring yesterday’s opinion into today’s trade.
A new direction demands a new perspective. And as price shifts, so must your lens.
---
🗞️Rumour Has It…
BREAKING:
Powell Declares Bull Market, Blames Moon Phase for Midweek Bear Tease
Financial news outlets were caught scrambling when the SPX reversed higher through thursday despite Wednesday’s doom-and-gloom.
“Clearly the moon was in retrograde,” Powell reportedly muttered, while clutching a Fibonacci ruler.
In other news, China's trade delegation released a statement saying, “We’re not sure what’s happening either.”
(This section is entirely made-up satire. Probably.)
---
🤯Fun Fact - The Original “Clean Chart” Addict Was… Jesse Livermore
Before indicators, algos, and triple-screen madness, Jesse Livermore – the OG speculator – was famous for trading from price and price alone.
In fact, he refused to use charts with clutter.
He would manually draw his price levels, log his trades by hand, and sometimes go days without placing a trade – waiting for the market to tip its hand.
His trading edge?
Patience.
Price action.
And a clean, unobstructed read.
One of his favourite tricks?
He’d mentally mark key inflection levels (like your 5400) and wait until price either exploded past or rejected hard before acting.
So next time you reset your chart – you’re not just decluttering…
You’re channelling Livermore.

Nightly $SPY / $SPX Scenarios for April 25, 2025🔮 🔮
🌍 Market-Moving News 🌍
📉 Procter & Gamble Cuts Outlook Amid Consumer Pullback: P&G shares declined after the company lowered its full-year earnings guidance, citing reduced consumer spending due to economic uncertainty and higher tariffs. CFO Andre Schulten noted significant consumer hesitation, linking it to volatility in mortgage rates and declining stock markets affecting retirement savings.
📊 Durable Goods Orders Surge, Core Spending Stagnant: March durable goods orders jumped 9.2%, driven by a spike in aircraft demand. However, core capital goods orders, excluding aircraft, rose only 0.1%, indicating cautious business investment amid ongoing tariff uncertainties.
🏠 Existing Home Sales Decline Sharply: Existing home sales fell 5.9% in March to an annual rate of 4.02 million units, reflecting affordability challenges associated with high mortgage rates and economic uncertainty.
📊 Key Data Releases 📊
📅 Friday, April 25:
🗣️ Fed Governor Neel Kashkari Speaks (5:00 PM ET):
Remarks may provide insights into the Federal Reserve's perspective on current economic conditions and monetary policy direction.
⚠️ Disclaimer: This information is for educational and informational purposes only and should not be construed as financial advice. Always consult a licensed financial advisor before making investment decisions.
📌 #trading #stockmarket #economy #news #trendtao #charting #technicalanalysis

SPX on threshold of bullish breakout? I am cautiously bullishNations may be lining up to kiss Trump's a??? but SPX has come to kiss a confluence of trendline resistance as well as POC
Also markets we approaching month end. You only need to look at the past month ends and see what happens to the price, yes they tend to reverse very often if not always, specially if the prices are below 200 ema as it is now.
I would be watching how the market behaves next week. Soft economic data are pointing to weaker economy and the underlying problem of highly leveraged Hedge Funds remain. I wonder if they begin to deleverage some more at this level.
Any future decline would be a good entry point

April 24 Trade Journal & Stock Market AnalysisApril 24 Trade Journal & Stock Market Analysis
EOD accountability report: -400
Sleep: 4 hour, Overall health: bad
X7 signal this morning somewhat told us we were going to bullish direction, but my mindset just wasn't there today, had bad sleep and things going on and ended up locking up account early. I just read a book about it recently but I think I need to really cut bad influences out of my life when im dealing with money.
**Daily Trade Signals based on VX Algo System**
** 7:00 AMVXAlgo ES X7 Buy signal**
10:43 AM VXAlgo ES X1 Sell Signal (caught 10 pt)
1:12 PM VXAlgo NQ X1 Sell Signal (10 pt)
3:10 PM VXAlgo NQ X3 Sell Signal (2x signal, failed)
3:30 PM Market Structure flipped bearish on VX Algo X3! (canceled out& failed)
Next day plan--> Bullish over $5500

$GOOG Possible Demand Zone 155-143 Targeting 178 By earning!One of worst weekly candles and 3 bearish soldiers pattern made it extremely bearish but now entered the demand zone between 155 to 143 expecting accumulation into this range then possible bottom by mid of April then moving higher after earning targeting upper gap but we keep the target more secure by targeting 178 as closing trade. 161-164 is strong resistance . so the idea bye with weakness and accumulate during coming days with stop loss below 140 approx. Earning estimate 1.6 which is a drop from 2.4 last quarter by 30% - P/E at 19.98 EPS at 8.12 - Average analyst rating at 215 (+60$) from last close at 156. these fundamental make this idea is much likely to succeed. Good luck - please like and share . thanks

April 24, 2025 - Not getting fired (yet)Hello everyone, it’s April 24, 2025, welcome back to another wild episode of “Trumponomics: The Market Edition.” For the second day in a row, global markets are on the rise, and yes, it’s all thanks to the Trump playbook: slap tariffs everywhere, terrify the market, escalate tensions, then toss out a gesture of peace and voilà — rally mode engaged.
The key word this morning? Relief. Relief that Trump might chill out on China, and Powell isn’t getting fired (yet). But let’s not pop the champagne too soon — anyone betting against a weekend plot twist from Trump hasn’t been paying attention.
In the US, the Fed’s Beige Book (a.k.a. the economy’s mood diary) painted a picture that’s… let’s say “limp but not lifeless.” Only 5 of the 12 Fed districts saw growth, and even that was more “walker with tennis balls” than Olympic sprint. Inflation? Creeping in slowly, with companies sharpening their price-hike pencils just in case Trump cranks up the tariff heat again. Employment? Not awful, but nothing to brag about. And uncertainty? It was mentioned 80 times in the report. That’s not a joke.
Meanwhile, auto sales are up — not because the economy’s booming, but because Americans are panic-buying ahead of expected price surges from more tariffs. Business travel is tanking, and tourism’s taking a nosedive. Welcome to the “Not-quite-a-crisis-but-definitely-not-fine” States of America.
As for OANDA:XAUUSD , after a brief flirtation with $3,500, it’s cooled down to $3,337. BLACKBULL:WTI is holding at $62.86. And INDEX:BTCUSD ? It’s back in the spotlight at $92,000 and climbing — yes, people are talking about it again, which should tell you something about the vibe out there.
On the politics front, Trump hinted that the tariff moratorium could be revoked for some countries, and he’s back to pestering Powell to cut rates. Classic. Meanwhile, Wall Street is just trying not to get whiplash. NYSE:BA numbers came in better than feared, and NASDAQ:NVDA supply chain via INX looks solid despite wild swings.
Today’s economic calendar includes durable goods data and jobless claims in the CME_MINI:ES1! are down 0.2% — looks like investors are just bracing for the next Trump curveball.
TL;DR: Markets are riding the Trump-coaster, gold cooled off, crypto’s surging, and America’s economy is wobbling but still upright — for now. Keep your helmets on.

Narrative Noise vs. System ClarityApparently, the market was “uncertain” today.
Somewhere between Trump retracting his Powell shade, the Fed playing PR dodgeball, and tariffs being simultaneously on and off the table… headlines were doing what they do best: explaining yesterday with confidence.
But the chart?
The chart spoke first.
We came into the session ready for bullish confirmation.
Instead, we got a clean rejection of 5400, with early signs of downside pressure before lunch.
This is why we follow price, not PR.
Today’s action didn’t invalidate the bull bias completely, but it sure made the case that bears aren’t done just yet.
Let’s unpack what we saw and where we’re headed next.
---
Additional images mentioned can be seen on my main blog
---
SPX Market Outlook - Structure Rejected, Futures Rolling
While the headlines continue to spin post-news confusion, the price action remains our guide.
Yesterday, we came into the session prepared for a bullish continuation, but 5400 acted as a firm barrier once again.
The daily chart showed a clear rejection, and despite the bullish lean in the morning, the structure leaned bearish by session’s end.
Now, as I write this before the cash open, overnight futures are pushing lower, indicating potential follow-through.
That doesn’t confirm anything just yet - but it does tilt the bias.
Here’s what I’m watching:
5400 = still key resistance
5300 = GEX flip level - will reassess bearish view if we break and hold below it
5000 remains the target for the Wolfe pattern continuation
Upper Bollinger tag is in - another technical sign of short-term exhaustion
No bear pulse bar yet, but a clean V-shaped reversal is visible on the chart
ADD remains near bull extreme - offering more bear potential than bull in the short term
Bias remains bearish below 5300, and I’ll reassess to add in below that level.
---
GEX Analysis Update
5500 - 5400 - 5350 all look interesitng levels
5300 is the current flip point
---
Expert Insights: React to Price, Not PR
❌ Mistaking news for a setup
Narratives are seductive. They come with headlines, urgency, and lots of confident pundits.
✅ Stick to the chart
Price told us today’s story long before CNBC tried to.
5400 rejection. No pulse bar. Bullish exhaustion on ADD.
That's not confusion. That's confirmation — if you're paying attention.
---
Rumour Has It…
Trump was overheard saying, “Maybe Powell’s alright. Maybe.” Dow gained 0.3% and then shrugged.
5400 is reportedly suing for emotional damages after being rejected for the third time this month.
A Wolfe Wave ghost briefly appeared on the chart, waved, and vanished near 5300.
(This section is entirely made-up satire. Probably.)
---
Fun Fact - News Always Arrives After Price
Markets don’t wait for clarity.
They move first, then the headlines scramble to explain why.
The pattern is timeless:
Price shifts.
Smart traders react.
Media catches up.
Retail says, “Oh, THAT’S why.”
Yesterday was no exception.
So if the news says “flat and uncertain,” but the chart shows a failed breakout, don’t wait for a CNBC blessing to press the button.
The system already said what it needed to say.

$PLTR Trade: Buy $90.86 , Target $101.35Beep Beep. Hope everyone is taking care of their trading accounts during this volatile phase in the markets. I noticed an identical setup on the weekly from back in August 24' and I'm looking to take advantage. We have a trend reversal on the Tom Demark sequential that helps identify trend exhaustion through a 9 Count. Currently on a 2 Count, we're testing the gap while simultaneously testing the 10WMA at 90.86.There is also a weekly gap at 101.35 ... Entry would be the 10WMA. Target the weekly Gap. Trade is as follows:
Trade Idea - Swing NASDAQ:PLTR $95 Calls 4/25
Entry - 10 WMA @ $90.86
Target - Gap on Weekly at $101.35

April 23 Trade Journal & Stock Market Analysis April 23 Trade Journal & Stock Market Analysis
EOD accountability report: +2325 on Eval, didn't trade funded
Sleep: 10 hour, Overall health: :check:
— 9:00 AM Market Structure flipped bullish on VX Algo X3!
— 11:30 AM Market Structure flipped bearish on VX Algo X3!
— 12:30 PM VXAlgo ES X1 Buy signal (triple buy signal) B+ set up
— 1:33 PM VXAlgo YM X1 Sell Signal (triple sell signal) B+ set up
— 1:55 PM Market Structure flipped bullish on VX Algo X3!
— 2:30 PM Market Structure flipped bearish on VX Algo X3!
— 3:31 PM VXAlgo ES X1 Buy signal (double signal)
Next day plan--> Short 48m MOB
Video Recap -->

Nightly $SPY / $SPX Scenarios for April 24, 2025🔮 Nightly AMEX:SPY / SP:SPX Scenarios for April 24, 2025 🔮
🌍 Market-Moving News 🌍
🇪🇺 European Banks Brace for Tariff Impact: European banks are facing a challenging outlook as U.S. tariff hikes raise recession fears. Analysts anticipate slower revenue growth and increased loan loss provisions, with institutions like BNP Paribas expected to report earnings reflecting these pressures.
✈️ Airline Industry Faces Booking Declines: European airlines report a 3% drop in planned summer trips, with leisure travel down 8% compared to 2024. Economic concerns and rising travel costs, particularly among Gen Z travelers, are contributing factors. Airlines like Ryanair and Air France-KLM are considering fare adjustments to maintain demand.
👗 Kering's Revenue Drops Amid Gucci Struggles: Luxury group Kering reported a 14% decline in Q1 revenue, with flagship brand Gucci experiencing a 25% drop. The company attributes the downturn to ongoing brand challenges and macroeconomic factors affecting consumer spending in key markets.
📊 Key Data Releases 📊
📅 Thursday, April 24:
📦 Durable Goods Orders (8:30 AM ET):
Forecast: +2.1%
Previous: +0.9%
Measures new orders for manufactured durable goods, indicating manufacturing sector health.
📈 Initial Jobless Claims (8:30 AM ET):
Forecast: 222,000
Previous: 215,000
Reflects the number of individuals filing for unemployment benefits for the first time, signaling labor market trends.
🏠 Existing Home Sales (10:00 AM ET):
Forecast: 4.14 million
Previous: 4.26 million
Indicates the annualized number of existing residential buildings sold, providing insight into housing market conditions.
⚠️ Disclaimer: This information is for educational and informational purposes only and should not be construed as financial advice. Always consult a licensed financial advisor before making investment decisions.
📌 #trading #stockmarket #economy #news #trendtao #charting #technicalanalysis
