SPY/QQQ Plan Your Trade For 5-6 : GAP Breakaway patternToday's pattern suggests a morning GAP will take place and price will continue to break away from yesterday's body range.
Given the fact that the markets are already almost 0.8-0.9% lower than yesterday's closing price level, this suggests the markets will continue to trend downward today.
Is this it? Is this the breakdown for May 2-5, seeking the Major Bottom I've talked about for the past 3+ weeks?
We'll find out over the next 5-10+ days.
Ultimately, the EPP patterns have aligned across multiple instruments/symbols to present a very clear opportunity to the downside. Now, we need to watch and wait as the markets should be moving into the early FLAGGING stage of the downward EPP pattern.
After the FLAGGING pattern, we should get the breakdown into consolidation, which is where I believe big profits can be made. That breakdown into the consolidation phase is usually very aggressive and can often be after the FLAGGING range.
Gold and Silver are making a move higher. I suggested this would be the case over the past 5-10+ days - but, boy, was it frustrating to watch Gold and Silver consolidate over the past few weeks.
At this point, I'm looking for Gold to rally above $3500 and for Silver to attempt to rally above $34.00.
Bitcoin seems to be leading the SPY/QQQ (again) and appears to be about 2-3 days ahead of the major US indexes, attempting to move into a downward FLAGGING formation.
This could be very interesting if BTCUSD continues to lead the SPY/QQQ. Meaning, we may be able to rely on the structures/setups in BTCUSD as a 2-3 day early window of that the SPY/QQQ may be doing (for a while). I'm sure it won't continue to align at some point in the future.
Again, I'm getting great comments from followers and subscribers. Thank you.
I'm doing my best to deliver the best research I can within these 15 to 20-min videos.
Get some.
#trading #research #investing #tradingalgos #tradingsignals #cycles #fibonacci #elliotwave #modelingsystems #stocks #bitcoin #btcusd #cryptos #spy #gold #nq #investing #trading #spytrading #spymarket #tradingmarket #stockmarket #silver
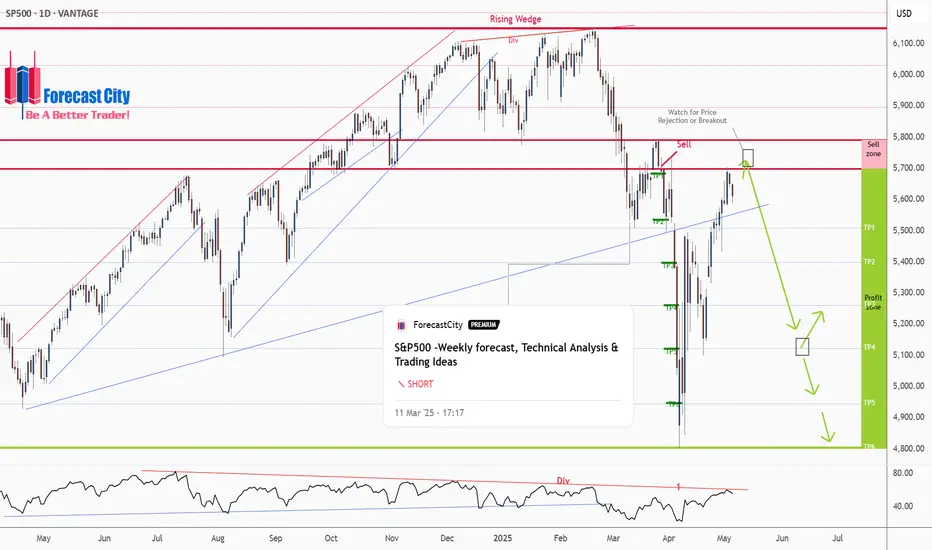
S&P 500 (SPX500)

S&P500 -Weekly forecast, Technical Analysis & Trading IdeasPrevious forecast result:
As you can see in the 4CastMachine forecast on 12/03/2025, the price, after rejecting the sell zone, began its sharp decline and touched all TPs.
Midterm forecast:
While the price is below the resistance 6149.57, resumption of downtrend is expected.
We make sure when the support at 4804.01 breaks.
If the resistance at 6149.57 is broken, the short-term forecast -resumption of downtrend- will be invalid. CSEMA:S&P
Technical analysis:
While the RSI downtrend #1 is not broken, bearish wave in price would continue.
A trough is formed in daily chart at 4807.10 on 04/07/2025, so more gains to resistance(s) 5698.65, 5791.00, 5896.50 and maximum to Major Resistance (6149.57) is expected.
Price is above WEMA21, if price drops more, this line can act as dynamic support against more losses.
Relative strength index (RSI) is 55.
Take Profits:
5509.32
5363.90
5261.00
5122.47
4944.41
4804.01
__________________________________________________________________
❤️ If you find this helpful and want more FREE forecasts in TradingView,
. . . . . . . . Hit the 'BOOST' button 👍
. . . . . . . . . . . Drop some feedback in the comments below! (e.g., What did you find most useful? How can we improve?)
🙏 Your support is appreciated!
Now, it's your turn!
Be sure to leave a comment; let us know how you see this opportunity and forecast.
Have a successful week,
ForecastCity Support Team
Looking for One More High So far, our minor B wave price action has not thrown us any curveballs, which is somewhat unusual considering B waves can become very complex. As I get into the micro price action, this pattern would fit better completed with at least one more high.
Nonetheless, I will offer a warning, we are in the target box...if you are long, please use stops, and make sure your position size is risk managed.
Best to all,
Chris

SPY/QQQ Plan Your Trade For 5-5-25 : GAP Reversal PatternToday's pattern suggests the SPY will open with a GAP range from yesterday's candle Body and attempt to reverse the trend we saw last week.
I believe this move will resolve to the downside, as I've been warning of the May 2-5 Major Bottom for many weeks.
I believe the extended uptrend over the last few weeks was pure speculation related to Q1 US earnings. It is hard to argue that traders playing into the Q1 earnings boost didn't play the right side of the trend after watching the markets rally over the past 2+ weeks. But, I still believe the markets will consolidate and attempt to move downward over the next 10- 20+ days.
The one thing that we have to understand is Q1 was almost on auto-pilot from Biden's economy/spending until Trump threw a curveball at the global markets with tariffs.
I don't believe the US & global markets have truly priced in a global -25% to -45% economic contraction because of the ongoing tariff negotiations. It has been reported that shipping rates are down 60% in China. I believe we still need another 30-60+ days to work out the tariff issues and to allow the markets to settle into proper expectations for future economic output/growth.
Because of this, I continue to urge traders to stay cautious.
Sitting on CASH right now (only trading 20% of your total capital) is probably the smartest thing you can do at the moment.
I still expect the July and October 2025 lows to be the base/bottom of the markets, leading to a stronger upward price trend.
Right now, I've very cautious we've just seen a "dead-cat bounce" off recent lows because of Q1 earnings expectations.
Now that we've passed most of the Q1 data - we are staring at Q2 & Q3. What comes next.
I believe Gold/Silver will continue to price in extreme risk factors - resulting in a strong rally through May and into June.
I believe Bitcoin will stall and move back down to the lower consolidation range.
Let's see how things play out this week.
Get some.
#trading #research #investing #tradingalgos #tradingsignals #cycles #fibonacci #elliotwave #modelingsystems #stocks #bitcoin #btcusd #cryptos #spy #gold #nq #investing #trading #spytrading #spymarket #tradingmarket #stockmarket #silver

VIX looks close to jumping up.MACD on daily looking to reverse, RSI has been in oversold territory, this is just on a daily though so not necessarily a guaranteed reversal but it seems to be getting support.

$SPX Rejection at Resistance – Watch 5582 for the Next Major Mov📉 After tagging the 5685–5750 resistance zone, SP:SPX is flashing major downside risk.
🔍 Key Zones:
✅ Resistance tapped: 5705–5838
🟨 FVG (Fair Value Gap): 5642–5582
❗ Daily close below 5582 → Bearish WXY structure confirmed
🟥 Hard invalidation for bulls: 4835.04
💡 I’m open to a retest of the 200DMA (currently 5746), but below 5582 I wouldn’t expect a new high.
This setup offers clear structure, risk-defined short entries, and a measured breakdown scenario if support fails.

SPX at a Tipping Point Rising Wedge Meets 200 EMAThe SPX is currently trading within a rising wedge a bearish pattern that typically signals exhaustion of upward momentum. Price has now stalled right at the 200 EMA, a key dynamic resistance level, and today's close came just beneath it.
If this rising wedge breaks to the downside especially with a confirmed rejection from the 200 EMA we could see accelerated selling. The next key support level to watch is $5,438.43. A breakdown from here would likely test that zone quickly.
This setup follows our earlier call from March 27, where we highlighted the $4,790 area as a bottom nearly nailed to the point. From that low, SPX rallied, but now the structure is showing signs of strain.
We’re at a decision point: hold the 200 EMA and potentially break higher or confirm the wedge breakdown and begin a new leg down.

SPX Running Into Important Resistance At 5780Last week we saw a weaker-than-expected Advance GDP in the first release, which led some to believe Powell might consider cutting rates. But Friday’s NFP came in better than expected. Expectations are no change for the Fed, and I honestly don’t believe they’ll move either.
Despite Trump putting pressure on them, inflation is still not at their 2% target, and the job market remains solid—so there may be no real reason to cut yet.
They’re watching markets too, and we've seen a pretty strong rebound, so there’s likely no urgency to act now.
Also, if they were to cut, it could appear politically motivated due to Trump, and that could seriously damage investor trust in the Fed’s independence.
So with that being said, we are wondering if the SPX can find some resistance if FED does not deliver a dovish view at this moment. Well, looking at the price action, it certainly looks overlaping recovery from April low, that can face limited upside near 5780, at April 2nd high.
If by Friday, we close above the 78.6% Fib then we may look at wave 3, alt sceario.
Grega

Little Rest For SPXI think the SPX structure is more prone to bearishness. There is a structure that will probably move quickly in one direction. I don't think a good structure has been formed for a bottom. And the rise does not seem very strong. For this reason, I expect an increase after the first fall.
Since this situation will probably reflect on crypto, my bearish contracts are still in place. But I am thinking of buying a bullish contract until the FOMC time.

Celanese Corp | CE | Long at $39.64Celanese Corp is another chemical company (like Dow Inc) crushed by tariffs and economic headwinds. It's dropped -78% in one year.... However, this is a very strong company with strong credit market interest and no immediate liquidity crisis. From a technical analysis perspective, this... like in 2008 and 2020... is the time to gather shares given it has reached the "abysmal crash" levels based on my selected simple moving averages. In the past, recovery to new highs has taken 1-2 years. History doesn't always repeat, but fear is opportunity in the stock market. If negative news continues to reign, a dip into the high $20's isn't out of the question.
If the company can squeak through 2025 and not continue to stack debt (debt/equity=2.43x), the growth opportunity into 2027-2028 looks promising.
I'm keeping my targets into 2026 low, but this could be a good buy and hold for the right investor.
Targets:
$47.00
$54.75

S&P 500 Braces for a Drop to $5,100–$5,177: Correction Coming?S&P 500 Braces for a Drop to $5,100–$5,177: Is the Correction Coming?
SP500 Reached the target of $5,680 - $5,800 and is going into correction along with Bitcoin 🤔.
Before:
After:
➖ The S&P 500 could fall to the 5100–5177 range due to the following fundamental factors:
FOMC Meeting on May 7: Expected rate hold and potentially hawkish rhetoric from Powell could amplify fears of rate hikes, hitting growth stocks.
➖ Trade War: Uncertainty in U.S.-China negotiations and risks of new tariffs threaten supply chains and corporate profits.
➖ Weak Economy: GDP contraction (-0.3% in Q1), recession fears, and weak PMI data fuel pessimism.
➖ Corporate Earnings: Disappointing guidance from key companies (e.g., Apple, Tesla) could trigger sell-offs.
➖ Sentiment on X: Bearish sentiment reflects market caution.
➖ Global Risks: Retaliatory tariffs and rising gold prices signal a flight from U.S. assets.
Assumption: If the Fed on May 7 emphasizes inflation risks and delays rate cuts, and tariff news remains negative, the S&P 500 could break support at 5500 and reach 5100–5177 within 1–2 weeks, especially amid technical selling and market panic.

S&P 500 Tests Key Zone Ahead of FOMCThe S&P 500 has reached the 5,700–5,800 zone after a nearly 18% rally in just half a month. This zone could determine whether the rally marks the end of the bearish trend or if more pain lies ahead for the stock market.
The 200-day simple moving average, several previous horizontal support levels, and the most recent top all converge in this area. The upward move has been driven by correction dynamics, optimism around potential trade deals, signs of de-escalation with China, and rising expectations for Fed rate cuts in 2025.
This week, the FOMC may either temper those optimistic rate cut expectations or hint at a more dovish tone. In either case, some profit-taking may occur ahead of the meeting, and the 5,700–5,800 zone is a strong candidate for that to happen.

S&P 500 Bearish Reversal Setup: Short Entry Below Key ResistanceEntry Point: Around 5,678.79
Stop Loss: Around 5,833.61 (above recent resistance zone)
Target Point: Around 4,831.37 (indicating a bearish target)
2. Technical Patterns:
The price hit a resistance zone (highlighted in purple) and reversed—this is often a bearish signal.
The trendline break (marked with the orange dot and blue arrow down) suggests a potential trend reversal.
The moving averages (likely 50 EMA and 200 EMA) indicate the price is still above the support zone but weakening.
3. Risk/Reward Ratio:
Risk (Stop Loss – Entry): ~154.82 points
Reward (Entry – Target): ~847.42 points
Risk/Reward Ratio: Approximately 1:5.5, which is favorable for shorting.
4. Trade Sentiment:
Bearish bias based on the breakdown from the resistance zone and confirmation from chart patterns.
If the price fails to hold above 5,682.87, a short trade may be validated with the target at 4,831.37.

S&P500 INTRADAY resistance at 5510US stock futures are signaling a second straight day of losses. Palantir shares dropped 9% pre-market after its earnings disappointed high expectations. Ford also fell, withdrawing its financial guidance and warning that new tariffs would hurt profitability.
In Europe, political uncertainty hit German markets as Friedrich Merz failed to secure a majority vote to become Germany’s next chancellor, delaying his swearing-in and shaking investor confidence. The DAX index slid 1.4% on the news.
Meanwhile, EU-US trade tensions are intensifying. The European Union expects new US trade probes could expose up to €549 billion ($622 billion) worth of EU exports to American tariffs, adding pressure to already strained transatlantic negotiations.
Key Support and Resistance Levels
Resistance Level 1: 5693
Resistance Level 2: 5780
Resistance Level 3: 5876
Support Level 1: 5512
Support Level 2: 5438
Support Level 3: 5390
This communication is for informational purposes only and should not be viewed as any form of recommendation as to a particular course of action or as investment advice. It is not intended as an offer or solicitation for the purchase or sale of any financial instrument or as an official confirmation of any transaction. Opinions, estimates and assumptions expressed herein are made as of the date of this communication and are subject to change without notice. This communication has been prepared based upon information, including market prices, data and other information, believed to be reliable; however, Trade Nation does not warrant its completeness or accuracy. All market prices and market data contained in or attached to this communication are indicative and subject to change without notice.

#ES1! "E-Mini S&P500" Index Market Bullish Robbery Plan🌟Hi! Hola! Ola! Bonjour! Hallo! Marhaba!🌟
Dear Money Makers & Robbers, 🤑 💰💸✈️
Based on 🔥Thief Trading style technical and fundamental analysis🔥, here is our master plan to heist the #ES1! "E-Mini S&P500" Index Market Heist. Please adhere to the strategy I've outlined in the chart, which emphasizes long entry. Our aim is to escape near the high-risk YELLOW MA Zone. It's a Risky level, overbought market, consolidation, trend reversal, trap at the level where traders and bearish robbers are stronger. 🏆💸"Take profit and treat yourself, traders. You deserve it!💪🏆🎉
Entry 📈 : "The vault is wide open! Swipe the Bullish loot at any price - the heist is on!
however I advise to Place buy limit orders within a 15 or 30 minute timeframe most recent or swing, low or high level. I Highly recommended you to put alert in your chart.
Stop Loss 🛑:
Thief SL placed at the Nearest / Swing low level Using the 3H timeframe (5440) Day/Swing trade basis.
SL is based on your risk of the trade, lot size and how many multiple orders you have to take.
🏴☠️Target 🎯: 5730
💰💵💸#ES1! "E-Mini S&P500" Index Money Heist Plan is currently experiencing a bullishness,., driven by several key factors. .☝☝☝
📰🗞️Get & Read the Fundamental, Macro Economics, COT Report, Geopolitical and News Analysis, Sentimental Outlook, Intermarket Analysis, Index-Specific Analysis, Future trend targets with Overall outlook score... go ahead to check 👉👉👉🔗🔗🌎🌏🗺
⚠️Trading Alert : News Releases and Position Management 📰🗞️🚫🚏
As a reminder, news releases can have a significant impact on market prices and volatility. To minimize potential losses and protect your running positions,
we recommend the following:
Avoid taking new trades during news releases
Use trailing stop-loss orders to protect your running positions and lock in profits
💖Supporting our robbery plan 💥Hit the Boost Button💥 will enable us to effortlessly make and steal money 💰💵. Boost the strength of our robbery team. Every day in this market make money with ease by using the Thief Trading Style.🏆💪🤝❤️🎉🚀
I'll see you soon with another heist plan, so stay tuned 🤑🐱👤🤗🤩

SPX500 D1 I Bullish Bounce Based on the D1 chart analysis, the price is falling our buy entry level at 5492.54, a pullback support.
Our take profit is set at 5797.53, an overlap resistance.
The stop loss is placed at 5386, a pullback support.
High Risk Investment Warning
Trading Forex/CFDs on margin carries a high level of risk and may not be suitable for all investors. Leverage can work against you.
Stratos Markets Limited (tradu.com):
CFDs are complex instruments and come with a high risk of losing money rapidly due to leverage. 63% of retail investor accounts lose money when trading CFDs with this provider. You should consider whether you understand how CFDs work and whether you can afford to take the high risk of losing your money.
Stratos Europe Ltd (tradu.com):
CFDs are complex instruments and come with a high risk of losing money rapidly due to leverage. 63% of retail investor accounts lose money when trading CFDs with this provider. You should consider whether you understand how CFDs work and whether you can afford to take the high risk of losing your money.
Stratos Global LLC (tradu.com):
Losses can exceed deposits.
Please be advised that the information presented on TradingView is provided to Tradu (‘Company’, ‘we’) by a third-party provider (‘TFA Global Pte Ltd’). Please be reminded that you are solely responsible for the trading decisions on your account. There is a very high degree of risk involved in trading. Any information and/or content is intended entirely for research, educational and informational purposes only and does not constitute investment or consultation advice or investment strategy. The information is not tailored to the investment needs of any specific person and therefore does not involve a consideration of any of the investment objectives, financial situation or needs of any viewer that may receive it. Kindly also note that past performance is not a reliable indicator of future results. Actual results may differ materially from those anticipated in forward-looking or past performance statements. We assume no liability as to the accuracy or completeness of any of the information and/or content provided herein and the Company cannot be held responsible for any omission, mistake nor for any loss or damage including without limitation to any loss of profit which may arise from reliance on any information supplied by TFA Global Pte Ltd.
The speaker(s) is neither an employee, agent nor representative of Tradu and is therefore acting independently. The opinions given are their own, constitute general market commentary, and do not constitute the opinion or advice of Tradu or any form of personal or investment advice. Tradu neither endorses nor guarantees offerings of third-party speakers, nor is Tradu responsible for the content, veracity or opinions of third-party speakers, presenters or participants.

GOLD Regains Above 3'300, since US stocks "Relief Rally" is OverGold prices recently surged above $3,300 per ounce due to a confluence of geopolitical, economic, and monetary factors driving strong safe-haven demand:
Heightened geopolitical tensions, particularly the Israel-Hamas conflict and ongoing US-China trade disputes, have increased uncertainty, prompting investors to seek Gold as a secure store of value amid instability.
The US dollar's weakness, nearing a three-year low, has further boosted gold's appeal for holders of other currencies, making Gold relatively cheaper and more attractive globally.
What is most important also, U.S. stock rally has overed recently its tedious 10-Day winning strike (fortunately which finished not at all the history peaks). That's why investors may be turning back to tried-and-true assets like Gold.
Central banks, notably China’s, have been consistently buying gold to diversify reserves away from the US dollar, supporting prices significantly. China increased its Gold reserves for the 17th consecutive month, signaling sustained institutional demand.
Additionally, gold-backed exchange-traded funds (ETFs) have seen record inflows, reflecting growing investor interest beyond traditional buyers.
Market expectations of Federal Reserve interest rate cuts later in 2025 have also played a key role. Lower interest rates reduce the opportunity cost of holding non-yielding gold, enhancing its investment appeal amid inflation concerns and economic growth uncertainties.
This combination of geopolitical risk, a weaker dollar, central bank purchases, and anticipated monetary easing has propelled gold prices to historic highs, with forecasts suggesting further gains toward $3,500 per ounce.
--
Best #GODL wishes,
@PandorraResearch Team 😎

Ideal TGTS =Covid's low @ $28.55/ 2012 Major Trend line @$36.92Two major targets here for PZZA as illustrated on the chart all else absolute !
Major trend line starting from 2012's low and the second one is Covid's low!
Both are legitimate technical reversal points !!!

PZZA'S Divers on the weekly chart still on going @ 22 weeks !Since the IPO we have had many weekly divers as such on the chart, as of
this week we stand at 22 weeks Our MAX weekly divers was 56 Zoon in
and go back to see data on the chart !!

ES Futures at a Crossroads: Fed Steady, Market ReadyCME_MINI:ES1!
Recent Market Performance
ES Futures experienced a significant decline of 22.30% from the February 19, 2025 high of 6218.50 to the recent low of 4832 on Monday, April 7th, 2025. This drawdown included a sharp 16.30% sell-off, triggered by the announcement of reciprocal tariffs, marking a decline from the April 2, 2025 high to the April 7th low.
Since forming that low, ES Futures have rebounded impressively—rallying 18.48% into the May 2nd high, retracing well over 50% of the losses. Notably, price action has closely respected Fibonacci retracement levels, as illustrated in the accompanying chart.
Macro Fundamentals
There are several macroeconomic considerations at play:
• Quarterly GDP data appears skewed due to front-loaded imports, evident in the January and February import numbers.
• This week’s March trade balance, imports, and exports data for both the U.S. and China will be crucial. These figures will shed light on how escalating tariff tensions have influenced Q1 business activity.
• The key event this week is the Federal Reserve interest rate decision and FOMC press conference. Of particular interest will be how the Fed’s risk outlook has evolved in light of Trade War 2.0, along with updates to growth and inflation forecasts.
While the Fed is expected to hold rates steady, there are increasing calls from President Trump to cut rates. Although recent soft data has shown signs of deterioration, this has not yet translated into hard data. In fact, April’s Non-Farm Payroll (NFP) report beat expectations, underscoring continued economic resilience.
Key Question: What Comes Next?
Will ES Futures continue to trend higher, reverse lower, or consolidate?
Key Technical Levels
• mCVAL: 5635
• Upper Neutral Zone : 5620 – 5585
• March 2025 Low: 5533.75
• Lower Neutral Zone : 5171.75 – 5150.75
Fibonacci Retracement Levels (2025 High to Low)
• 2025 High: 6218.50
• 0.786 Retracement: 5921.75
• 0.618 Retracement: 5688.75
• 0.5 Level (Mid-Range): 5525.25
• 2025 Low: 4832
Our View
We believe downside risks are currently minimized, barring a new market-moving development—such as a disruptive social media post. Q1 earnings have broadly reflected strength, reducing the probability of further downside in the near term.
Given the current backdrop:
• Positive news could act as a catalyst for higher prices.
• In the absence of significant newsflow, we expect consolidation, followed by a potential resumption of the upward trend.
Scenario 1
A pullback to either the blue support zone near the 0.618 Fibonacci retracement confluence, or a deeper pullback towards the confluence of the 2025 mid-range and March 2025 lows, followed by a continuation higher.
Scenario 2
Seasonality supports consolidation. Historical index behavior at this time of year further aligns with the potential for sideways movement before the next leg higher.

SPX: Short term bearish to touch gap? And fill? Looking like there is apparently “no tariff talks” per China.
We’re still in such an uptrend, but looking for a short-term pull back on negative news. Also we have FOMC this week. Does Powell give what Trump and the people want, a rate cut?
I’m looking for 5678.33 to
- TP1: 5672.46
- TP2: 5635.06
Possible touch or fill gap of below 5603.21?
Let me know what you think. Do your DD, not FA. Let’s see what the week brings.

Week ahead analysis May 4th to 11th**Week Ahead Analysis (May 5 – May 11, 2025)**
### **Baseline: Market Expectations**
- **Tariffs & Fed Policy:** Trump's tariff announcement has heightened concerns about economic slowing, prompting bond markets to price in up to four Federal Reserve rate cuts this year.
- **Trade Talks & Sentiment Shift:** Reports suggest China may restart trade negotiations, boosting risk sentiment. However, China insists the U.S. must first remove all unilateral tariffs, adding uncertainty to the discussions.
- **Market Reaction:** Risk assets—equities and high-beta currencies like AUD, NZD, and CAD—are climbing as volatility cools. Meanwhile, safe havens such as JPY, CHF, and gold are facing selling pressure, though overall risk sentiment remains cautious.
### **Potential Surprise Scenarios**
- **Trade Deal Secured:** A deal would likely send equities higher, strengthen risk-sensitive currencies, and drive safe havens lower.
- **No Deal Reached:** In contrast, safe havens could gain while risk assets retreat.
### **Big Picture Outlook**
Regardless of the immediate outcome, the market's medium-term trajectory hinges on the broader effects of trade policy. If tariffs persist, economic uncertainty may sustain the Fed’s dovish stance. A successful trade deal, however, could restore confidence, shifting expectations back toward growth stabili

S&P ES Long setup target 5963.50 / Calls SPY target 596Fibonacci technical analysis : S&P 500 E-mini Futures CME_MINI:ES1! has already found support at the Fib level 78.6% (5623.50) of my Down Fib. Last Daily candle (May 2) has closed above retracement Fib level 78.6%. My Down Fib guides me to look for CME_MINI:ES1! to eventually go up to hit first target at Fib level 127.2% (5963.50).
CME_MINI:ES1! – Target 1 at 127.2% (5963.50), Target 2 at 161.8% (6205.50) and Target 3 at 178.6 (6322.75)
Stop loss slightly below the 61.8% retracement Fib level (5506.25).
Option Traders : My AMEX:SPY chart Down Fib shows price to go up to Target 1 at 127.2% (595.82), Target 2 at 161.8% (620.50) and Target 3 at 178.6 (632.50)
Stop loss slightly below the 61.8% retracement Fib level (549).
Enjoy the trading process and take time to smell the roses🌹
