S&P 500: Valuation Correction or the Start of a Breakdown?Valuation Correction or the Start of a Breakdown?
Zoom out. Clear the noise.
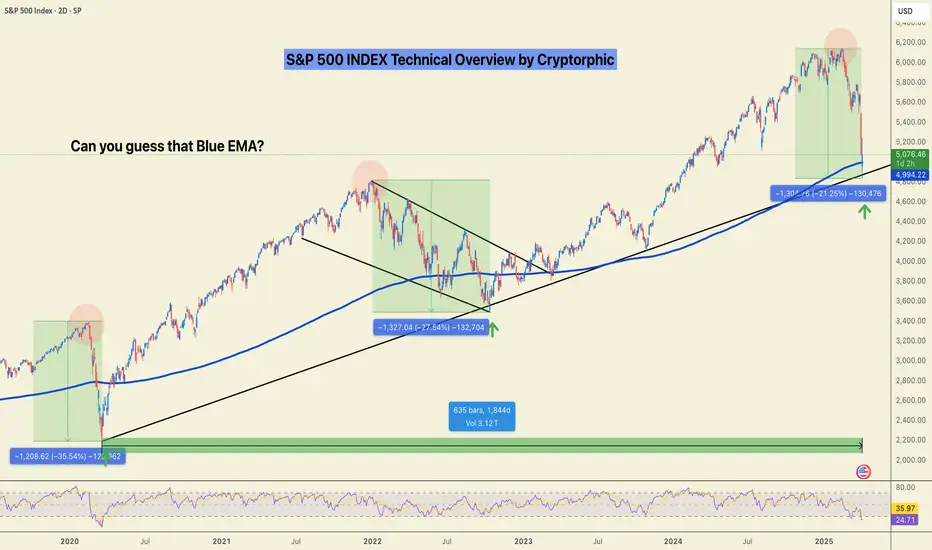
We might still sweep the lows, but when viewed on the weekly timeframe, this current S&P 500 move looks more like a healthy valuation correction than a structural breakdown.
Let’s break it down by the numbers using fractal analysis:
🟩 March 2020 (COVID Crash):
▪️~35% drop
▪️V-shaped recovery
▪️Oversold RSI bounce
🟨 2022 Bear Market:
▪️~27% correction
▪️Multi-month wedge consolidation
▪️Eventually led to an upside breakout
🟦 Now (2025):
▪️~21% correction so far
▪️Retesting long-term trendline
▪️RSI in familiar oversold zone
📊 Fractal Math:
- From 35% to 27% = 22.86% decrease
- From 27% to 21% = 22.22% decrease
Both legs show a consistent ~22% drop in correction depth suggesting bearish momentum is weakening with each cycle. Currently bouncing off the1844 days of support.
Is this the bottom? Will there be relief?
🔁 If this pattern holds:
- We could see a short-term sweep or deviation under recent lows.
- But structure favours a potential recovery from this zone, unless the trendline breaks decisively.
📌 Watch levels closely. Timing matters.
🧠 What’s your take, is this another “buy the dip” moment?
Do hit the like button if you liked this update and share your views in the comment section.
S&P 500 (SPX500)
$SPX Flirting With a Bear Market alongside $QQQ NASDAQ fell another 4% touching down 26%
S&P 500 walking a tight rope falling 21% to play with the idea of a Bear Market, but has rebounded a bit.
NASDAQ:QQQ did have a stronger response from buyers than SP:SPX
Nonetheless, we would need several WEEKLY closes sub 20% losses to enter a textbook Bear Market.

SPX WEEKLY 7TH APRIL 2025Welcome to SPX weekly. I have deeply discussed the price action here. If you have any doubts, feel free to leave a message or comment below.
NOTE:DO NOT SHORT

SPY/QQQ Plan Your Trade For 4-7 : POP In Counter Trend ModeToday's POP pattern in Counter Trend mode suggests the markets will find support and attempt to POP upward a bit.
I expect the SPY to attempt to reach levels above 505 today. Possibly trying to peak near 510.
The same thing will happen with the QQQ - a potential rally (POP) higher targeting the 420-425 level.
Watch this video TWICE if you really want to understand what is taking place in the markets right now.
The tariff issue will settle over the next 15+ days. The SPY/QQQ are moving into the EPP Consolidation Phase (just like I've been telling you for months now).
BTCUSD is moving into a BREAKDOWN phase and will likely target $63k over the next 30+ days.
Gold and Silver reacted to the breakdown of the SPY/QQQ as they always do - PANIC SELLING.
Now that the panic selling pressure appears to be subsiding, Gold and Silver should build a base and begin an explosive move higher - targeting $4200-4500 for gold and targeting $41-44 for silver.
We live in exciting times and I still believe the US markets will DOUBLE or TRIPLE over the next 5-10+ years.
Get Some.

S&P INTRADAY futures point to lower open Global stocks sold off sharply on Monday as investors rushed into safe-haven assets, driven by growing concerns over U.S. President Donald Trump’s tariffs. The market reaction is forcing Wall Street analysts to dial back their bullish outlook on U.S. equities.
Despite the market turmoil, Trump and his team downplayed fears of inflation and recession, remaining confident that strong economic growth lies ahead.
In response, China’s policymakers met over the weekend to discuss potential steps to support the economy, including speeding up planned stimulus measures, according to sources.
Meanwhile, traders are now expecting the Federal Reserve to cut interest rates this year, with some even betting on an emergency rate cut before the Fed’s next scheduled meeting, as recession fears mount.
Oil prices dropped for a third day, with Saudi Arabia cutting the price of its main crude grade by the most in over two years, adding to the bearish sentiment.
Key Support and Resistance Levels
Resistance Level 1: 5273
Resistance Level 2: 5379
Resistance Level 3: 5510
Support Level 1: 4815
Support Level 2: 4700
Support Level 3: 4585
This communication is for informational purposes only and should not be viewed as any form of recommendation as to a particular course of action or as investment advice. It is not intended as an offer or solicitation for the purchase or sale of any financial instrument or as an official confirmation of any transaction. Opinions, estimates and assumptions expressed herein are made as of the date of this communication and are subject to change without notice. This communication has been prepared based upon information, including market prices, data and other information, believed to be reliable; however, Trade Nation does not warrant its completeness or accuracy. All market prices and market data contained in or attached to this communication are indicative and subject to change without notice.

spx 5100 targetAfter warning of 200 pnts drop yesterday for monday, the futures opened 200 pnts lower at 4800
But expect to see a green bar during the day or tomorrow with 5100 as target to fill some gap and many short sellers taking profit. 4800 is at 2022 peak so technically a strong support
5100 hundred would be a resistance for further downside
If it goes over 5100 and stays there, the trendline break rule fails. Then I will have to review my further downside targets and start being medium term neutral/bullish from bearish and consider 5300 as next target and 4800 as target for double bottom for being bullish

Modified Count to Reflect Recent DeclineIn truth, the levels we're seeing this morning when the SPX cash market opens, I was not anticipating seeing till the 3rd quarter of this year. Mid last week, we had positive MACD divergences on the intraday charts and was setting up to be almost a textbook bottom.
Nonetheless, the SPX cash market will not hold the must hold zone when it opens this morning. This means we will get a retracement higher in a minor wave B that should last some time. This will represent one the final opportunities traders will have to relieve themselves of excess portfolio leverage and risk.
We very well may spend the summer months retracing higher...but there is no doubt some of you reading this will assume this will result in the resumption of the previous bull market.
It will not be.

S&P 500: Historic Crash or Just Another Chance?Let’s be real: What’s happening with the S&P 500 right now is rare. This is only the fourth time in history that the index has dropped more than 10% in two days (technically three, including today’s Monday session). The other times? October 1987, November 2008 during the financial crisis, and March 2020 during the pandemic crash.
And now? We’re seeing a similar drop, this time triggered by a global tariff war , stoked by the U.S. and other governments playing chicken to see who folds first.
Yeah, it sucks. It hurts. But it could also be a hell of an opportunity.
We just tagged the 4,800 level —a place many didn’t expect to see this quickly. Neither did I. But here we are. The untapped VWAP got hit, and this might very well be the start of Wave A. Could we go lower? Absolutely. There’s a monthly Fair Value Gap around $4,500, and a drop to $4,250 isn’t out of the question either.
But here’s the thing: it depends entirely on your perspective.
If you’re trading on the 30-minute chart, this is a full-blown crisis. But zoom out to the daily, weekly, or monthly chart—and it’s just market noise.
Pull up the log chart from 1953 to 2025 in the top left corner. We’ve seen this before. A handful of times. And on that scale? Nobody cares.
If you’re in the game to build long-term wealth, this moment is just another temporary shakeout. If you’re doing dollar-cost averaging, this is exactly where you want to be adding—not panicking.
The market doesn’t care about your plan. It forces you to adapt. You can’t fight it, only flow with it.
And if you’re in it for the long haul? This is just noise. Ignore it, zoom out – and stay the course.

Cleveland-Cliffs (CLF) BUY SETUPlooking for a strong recovery on us steel sector in 2025 and 2026.
trade carefully.
good luck.

SPX POSSIBLE RECOVERY UP TO 7000-7500first quarter wasn't bright for spx. but it can recover at moderate phase.

Using Put Options to Protect Your Stock PortfolioCME: Options on E-Mini S&P 500 Futures ( CME_MINI:ES1! )
Last week’s bloodshed of global financial market made history. Nearly all major asset classes fell into a market turmoil driven by tariffs and retaliations.
Let’s focus on the US stock market:
• Dow Jones Industrial Average dropped 7.76% in the week of March 31st to April 4th, making it the 4th worst weekly performance on record
• S&P 500 slipped 8.77%, the 4th worst week in history
• Nasdaq Composite fell 9.18%, the 2nd worst week
• Russell gave up 9.34%, the 3rd worst week
All four stock index futures were in negative territory year-to-date. On Sunday evening, E-Mini S&P 500 opened 178 points lower to 4,932, losing 17.1% YTD.
All parties ultimately come to an end. After two years of double-digit gains, the unstoppable US stock market finally cracked. As more tariffs and retaliations are expected to escalate, I am afraid that we are only seeing the beginning, rather than the end.
For stock investors, this is a good reminder of market risk, something we always talk about but seldomly pay attention to. The “return of investment” should be focusing on the repayment of your money, a safety issue. Only after that should we talk about the gain from the investment. It is a necessity to protect your portfolio to achieve long-term growth.
Trading with Options on E-Mini S&P 500 Futures
For investors with a diversified portfolio, Put Options on the E-Mini S&P 500 futures are effective and cost-efficient tools. Investors who long the stocks will lose money, should stock prices fall. Put options would gain in value, providing a hedge to the portfolio.
The following illustration shows a hypothetical example, given:
• An investor has a $250,000 portfolio holding a diversified pool of U.S. stocks
• CME E-Mini S&P 500 futures ( NYSE:ES ) have a contract size of $50 times the index value
• The June contract (ESM5) was quoting at 4,935 Sunday evening Friday, making the notional value of 1 contract $246,750, approximately equal to our portfolio value
• Assuming the portfolio moves closely in line with the S&P 500
• The investor wants to limit the loss of his portfolio to 12%. If the S&P 500 index is currently around 4950, a put option with a strike price of 4350 would roughly correspond to a 12% decline
Hedging trade illustration:
• The investor buys 1 put option on the June futures with the strike price of 4,600
• CME quote on that Put option is 223. As the contract is $50 times the index, the premium upfront for one put option contract is $11,150 (223*$50), ignoring any commissions
• The put premium is calculated as 4.46% of the $250K portfolio
If S&P drops to 4,200 (-15.15%) by the end of April:
• Without the put, the portfolio lost $37,879, assuming the same loss with the S&P
• The 4600-strike put is now 400 points in-the-money
• The investor sells the put and receives $20,000 (= 400 x 50)
• The loss of portfolio will be 37879+11150-20000 = $29,029
• With an E-mini S&P put protection to mitigate loss from the stock portfolio, the investor lost 11.6% (= 29029 / 250000), which is 3.5% lower than the S&P loss and with the preset loss limit
If S&P drops to 4,000 (-19.2%) by the end of May:
• Without the put, the portfolio lost $47,980, assuming the same loss with the S&P
• The 4850-strike put is now 600 points in-the-money
• The investor sells the put and receives $30,000 (= 600 x 50)
• The loss of portfolio will be 47980+11150-30000 = $29,130
• With an E-mini S&P put protection to mitigate loss from the stock portfolio, the investor lost 11.6% (= 29,130 / 250000)
As we can see here, when the S&P falls sharply, the investor will be able to cap his loss to 11.6%. In a “protective put” strategy, we would consider the option premium an insurance contract for owning stocks. If the index rises, the portfolio return would be lowered a little because of the premium upfront, that is, the cost of insurance. However, the protection is a lifesaver if the index falls.
Before jumping into action, the investor needs to run a correlation analysis using the daily value of the portfolio against the S&P 500 closing prices. Here is how:
• Some trading software has correlation feature built in already
• If not, pull 1-year daily portfolio balance and 1-year S&P closing prices, export them to Excel. Run correlation test with these two data series using Excel data analysis tool.
• Alternatively, we could drop the data into ChatGPT and ask AI to do the work for us.
If the correlation is greater than 50%, it means that S&P 500 is a good fit to hedge the portfolio. If it is not, we could try the correlation analysis using the other stock index closing prices, such as the Dow, the Nasdaq 100 and the Russell 2000. Then replace E-Mini S&P 500 futures with the stock index futures contract best fit the portfolio.
Happy Trading.
Disclaimers
*Trade ideas cited above are for illustration only, as an integral part of a case study to demonstrate the fundamental concepts in risk management under the market scenarios being discussed. They shall not be construed as investment recommendations or advice. Nor are they used to promote any specific products, or services.
CME Real-time Market Data help identify trading set-ups and express my market views. If you have futures in your trading portfolio, you can check out on CME Group data plans available that suit your trading needs www.tradingview.com

$SPX $NAS100 FILL THE GAP = "LEARNED BEHAVIOR" IN PLAY🏒🏒🏒🏒🏒FILL THE GAP! FILL THE GAP! FILL THE GAP!
Hopefully, institutions want to reach 7,000 from here, as the majority of them wrote in public New Year resolutions.
A great example of learned behavior.
Let’s watch.
FILL THE GAP! FILL THE GAP! FILL THE GAP!🏒🏒🏒🏒🏒

$QQQ Has Officially Entered a Bear Market $SPX is CloseNASDAQ HAS OFFICIALLY ENTERED A BEAR MARKET, DOWN ~22%
NASDAQ:QQQ 2022 Bear Market bottomed ~37%
just below the 200WMA
S&P 500 is not quite there yet, down only ~17.5%
SP:SPX 2022 Bear Market bottomed ~27% a tick below the 200WMA

SPX500 & Nasdaq: Confluence! Confluence! Confluence!With consumer confidence off at circuit breaking levels, the market, technically, has reached extreme levels of support. Let's look at it:
Technicals:
(1) Horizontal Levels of support
(2) 50%/61.8% fib confluence
(3) exDiv1
(4) extreme indicators
(5) Chikou span testing cloud support
(6) 28% drop is SPX
All of these levels are lining up around the same location. And just like in real estate "Location! Location! Location!" is the adage; in markets, "Confluence! Confluence! Confluence!" is the adage!

When will NASDAQ stop melting? You can't say I didn't warn you!I hate to say I told you but I warned about this crash at my analysis back at September 2024 for NQ1! (you can see it at related ideas below), anticipating market moves based on structure well before the narrative around election and tariffs even began circulating.
We often see markets engineer these kinds of dramatic dives below obvious lows. This projection towards the 4.0-5.0 zone looks characteristic of such a liquidity hunt, designed to clear out sell-side stops and shake out traders before a potential major move higher – a dynamic not unlike what we anticipated previously.
While the projected sharp drop on NQ1! below key levels like the Monthly Order Block near 3.0 and the AG (actual gap) level near 3.5 might look aggressively bearish, I'm viewing this as a potential setup for a significant buy opportunity.
My attention is focused on that "Possible reversal level 1" between 4.0 and 5.0. If price stabilizes and shows rejection signs within this zone, it could signal the start of a powerful rally, potentially targeting levels back up towards the 1.75 area or even revisiting prior highs.
Remember, these market structure plays can take time to fully develop, just as previous setups did. We could see NQ consolidate or even briefly dip lower within that 4.0-5.0 zone before the anticipated upward reversal truly gains traction.
Thanks for reading, boost and follow to stay liquid and not become liquidity.
Wish you safe and informed trading decisions.
___________
CME_MINI:NQ1! TVC:VIX

SPX updateSP500 E-min futures opened 200 pnts lower as I predicted. I have to make frequent updates because of the fast changing environment. This is just reading the market and you all can do it with practice.
Volatility on futures options has crossed 100! My God! I have never seen such readings. With SPX being at key level at 2022 peak and also at HVN, some positive news from Trump adviser that 50 countries want to negotiate with Trump, I see the market rally to 5000 very likely Monday open or close.
But I still believe 4150 as final resting place. I dont see any crashes below 4800 except 150 points near the target, as far as I can read.
But outside the readings, I do suspect a banking crisis like 2008 is looming. That would change everything because Trump is against bailouts. We will see when that happens

SPY w/ 2022 Fibonacci levels. The chart is the SPY with FIB levels from the 2022 bottom or close to give you an idea of where we might find support levels.

SPX Important update: Crash of 200pnts on MondayThree days back I had warned of a crash which did materialise beyond my expectation.
Today again based on the same VP analysis and additionally major trendline break principal I am predicting a 200pnts crash on Monday as we have enter a major low volume region. I hope I am wrong for the sake of all those who are still invested
The market achieved the first target of green trendline break and is now touching the red trendline. Since the price is close to the LVN's another crash is extremely high probability. Had it been near a HVN, I would expect a bounce. The next target coincides with the 2023 Oct bottom. But 4800 (peak of 2022) could offer some support and then 4120
Major trendline break principle is: when a major trendline is broken the price will mirror the rise and fall an equal distance from the breakpoint as from the high to the breakpoint. Check my related post where I show many such cases

Weekly Market Forecast: Short Term Buys, Then Sells! In this video, we will analyze the S&P 500, NASDAQ, AND DOW JONES Futures for the week of April 7 - 11th.
The Stock Market Indices may find support at current levels for a Bear Market Rally. Wait for the market structure shift to the upside before taking any buys. Let the market confirm it's intended direction first, then look for valid buy setups for a short term countertrend play.
Enjoy!
May profits be upon you.
Leave any questions or comments in the comment section.
I appreciate any feedback from my viewers!
Like and/or subscribe if you want more accurate analysis.
Thank you so much!
Disclaimer:
I do not provide personal investment advice and I am not a qualified licensed investment advisor.
All information found here, including any ideas, opinions, views, predictions, forecasts, commentaries, suggestions, expressed or implied herein, are for informational, entertainment or educational purposes only and should not be construed as personal investment advice. While the information provided is believed to be accurate, it may include errors or inaccuracies.
I will not and cannot be held liable for any actions you take as a result of anything you read here.
Conduct your own due diligence, or consult a licensed financial advisor or broker before making any and all investment decisions. Any investments, trades, speculations, or decisions made on the basis of any information found on this channel, expressed or implied herein, are committed at your own risk, financial or otherwise.

S&P 500 Records Largest Weekly Decline Since 2020The S&P 500 Index has suffered its steepest two-day drop since the pandemic crash in March 2020. On April 4th, 2025, the benchmark index closed at 5,074.08, down 322.44 points (5.97%). This marks a loss of $5.4 trillion in market value across just two sessions.
The sell-off followed comments from Federal Reserve Chair Jerome Powell. He warned that President Donald Trump’s new tariffs could lead to persistently higher inflation. All 11 sectors in the S&P 500 closed in the red. Only 14 stocks remained positive as Nvidia and Apple fell more than 7%, while Tesla dropped 10%.
The Nasdaq 100 Index plunged 6.1%, confirming a bear market after losing over 20% from its February peak. The rapid decline mirrors the speed seen during the 2020 COVID crash and the 2000 dot-com bust.
President Trump announced sweeping tariffs on U.S. imports on Wednesday. These include a 10% general tariff and higher rates on dozens of countries. China responded by imposing a 34% levy on American goods. The tit-for-tat measures triggered fears of a full-scale global trade war.
Global markets reacted sharply. Investors pulled out of stocks and moved into safer assets like government bonds. The two-day loss of $5 trillion on the S&P 500 set a new record, surpassing the $3.3 trillion loss during March 2020.
Rick Meckler, of Cherry Lane Investments, said the escalation is now deeper than many investors expected. The initial belief that tariffs were a negotiation tactic has now given way to serious market concerns.
Technical Analysis: Price Approaching Key Support Zones. Will They Hold?
The S&P 500 has shown a bearish trend since early 2025. Several weekly candles have closed bearish, confirming a strong downtrend. Currently, the index is trading lower toward a key ascending trendline near $4,930.
The $4,930 support level may offer short-term support. A bounce from here could see a brief recovery. However, the sentiment remains bearish without strong economic data or policy changes.
Further Downside Risk If Support Fails
Another horizontal support sits at $4,780. If both support levels fail, the index may fall toward the $4,500 psychological zone. This level is crucial as it marks a long-term support and potential reversal point.
At present, bearish momentum dominates, with much strength coming from trade war fears. Unless data shifts investor sentiment, the downtrend may persist.

SPX500: The trendline show a bottom in Sept 2025 at 4700 We're being magnetically pulled toward the trendline bottom around 4700.
Based on the current MACD and RSI signals, the bearish scenario could continue until September–October 2025. This correction is very similar to the one from 2022.
There will be some dead cats bounces, but do not be fooled, the MACD is reseting hard.
Stay sharp. Be ready.
DYOR.

SNP500 / SPX🔍 SPX/USDT Analysis: Daily Timeframe 📉
SELL IT!
The SPX chart on a daily timeframe highlights significant upcoming dates where price movements may present trading opportunities. These should be analyzed in conjunction with higher timeframes for a comprehensive market view.
• September 3, 2024 - Red Line: This date marks a potential local peak. Traders might consider this as a moment to take profits or reduce exposure, as the price could encounter resistance or a downturn.
• December 6, 2024 - Red Line: This date is another potential local peak, signaling a possible moment to exit positions before a downturn.
When working with this daily timeframe, remember to evaluate these movements within the context of the broader market trend, considering higher timeframes for a more global perspective.
Note: The exact timing of these phases can vary by +/- a few days. All times are based on UTC-7 (Los Angeles).

S&P 500 at Decision Zone: Relief Rally or Continuation Lower?📄 The hourly chart is currently at a critical inflection point after a steep drop from recent highs. We’re seeing signs of a potential corrective rally forming, but the battle between bulls and bears is far from over.
🧭 Key Zones to Watch:
Fib Resistance (0.55–0.62): 5,400–5,536
Bullish Breakout Target: 5,707
Bearish Breakdown Target: 4,925
Neutral Pivot: 5,061 (current consolidation zone)
📊 If price reclaims and holds above 5,536, a continuation toward 5,707 becomes likely.
🚨 However, a rejection in the Fib zone followed by a drop below 5,061 may confirm renewed bearish momentum targeting the 4,925 region.
This setup provides clear structure for both bulls and bears. Keep an eye on volume, price action confirmation, and respect risk management.
💡 Comment your thoughts below! Are you leaning bullish or bearish here?
