SNP500 / SPX🔍 SPX/USDT Analysis: Daily Timeframe 📉
SELL IT!
The SPX chart on a daily timeframe highlights significant upcoming dates where price movements may present trading opportunities. These should be analyzed in conjunction with higher timeframes for a comprehensive market view.
• September 3, 2024 - Red Line: This date marks a potential local peak. Traders might consider this as a moment to take profits or reduce exposure, as the price could encounter resistance or a downturn.
• December 6, 2024 - Red Line: This date is another potential local peak, signaling a possible moment to exit positions before a downturn.
When working with this daily timeframe, remember to evaluate these movements within the context of the broader market trend, considering higher timeframes for a more global perspective.
Note: The exact timing of these phases can vary by +/- a few days. All times are based on UTC-7 (Los Angeles).
S&P 500 (SPX500)
S&P 500 at Decision Zone: Relief Rally or Continuation Lower?📄 The hourly chart is currently at a critical inflection point after a steep drop from recent highs. We’re seeing signs of a potential corrective rally forming, but the battle between bulls and bears is far from over.
🧭 Key Zones to Watch:
Fib Resistance (0.55–0.62): 5,400–5,536
Bullish Breakout Target: 5,707
Bearish Breakdown Target: 4,925
Neutral Pivot: 5,061 (current consolidation zone)
📊 If price reclaims and holds above 5,536, a continuation toward 5,707 becomes likely.
🚨 However, a rejection in the Fib zone followed by a drop below 5,061 may confirm renewed bearish momentum targeting the 4,925 region.
This setup provides clear structure for both bulls and bears. Keep an eye on volume, price action confirmation, and respect risk management.
💡 Comment your thoughts below! Are you leaning bullish or bearish here?
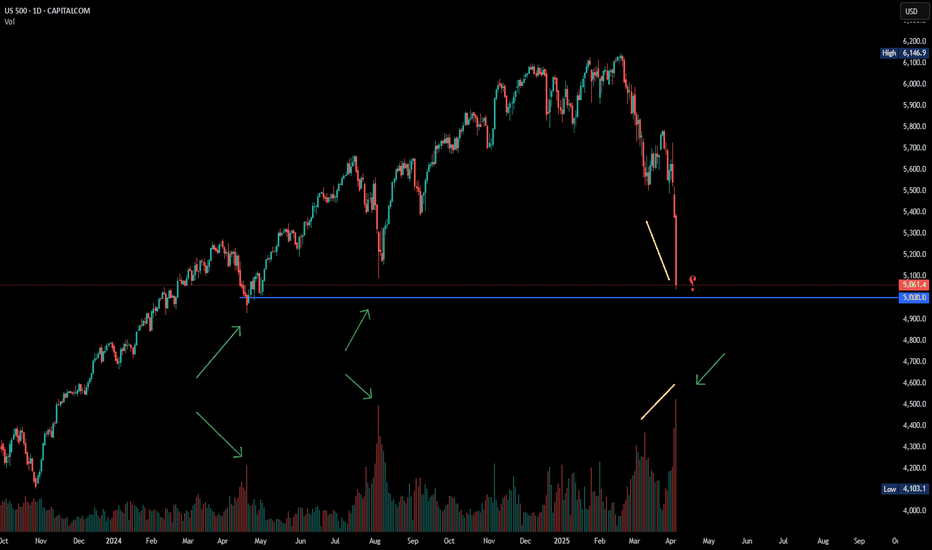
Are We Witnessing a Black Swan Event?I’ve spent most of the day digging through charts and studying past crashes — because what we’re living through right now might be a once-in-a-decade opportunity.
This current market crash feels eerily close to a black swan event.
No one really expected Trump to push tariffs this far, and the consequences are already rippling through global markets. If this escalates into true economic isolation, the effects could be both tremendous and long-lasting.
That said, there’s another possibility:
This might just be a blip in history — a bold negotiating tactic that works out, shocks the system temporarily, and fades away.
There’s even speculation this could mirror the 1989 crash, with some analysts warning of a potential 20% drop by Monday.
If that happens, I’d rather not be frozen by fear. I want to act with intention. I want my plan in place and my orders ready.
Before I share stock ideas I believe can outperform in the long run…
Let’s first walk through what I believe might be playing out — at least for now. (Keep in mind, these theses can change fast.)
Before the crash, it looked like a replay of 2022:
Markets were clearly overvalued and due for a correction — back then, it was driven by regional bank failures, and the Fed quickly stepped in to stabilize things.
But now, selling pressure is accelerating.
This looks less like 2022 and more like 2020 — where markets broke down in response to a larger, fast-moving, global crisis.
Even though we’re seeing similarities, things can shift very quickly.
We still haven’t seen key reversal signs — like a Doji candle — and more importantly, there’s been no intervention yet from the government or global forces.
Until that happens, panic may continue to snowball.
And as we know from history, panic doesn’t operate on logic.
Source:
📚 2020 Stock Market Crash en.wikipedia.org
Is This a Bear Market or a Golden Opportunity?The indices have plummeted sharply, and whether you believe this is due to Trump’s tariffs or would have happened anyway, regardless of the trigger, the reality remains the same.
Both the S&P 500 and Nasdaq 100 are officially in bear market territory— defined by a decline of more than 20% from their peaks . Meanwhile, the Dow Jones Industrial Average is down approximately 15%.
Given these facts, the big question is: Are we in a bear market, or is this a fantastic buying opportunity? 📉📈
Now, let's break down the key levels, potential scenarios, and how to approach the current market environment. 🚀
Dow Jones 30 (DJI): Navigating Key Support and Resistance Levels
On the weekly chart, DJI has been in an uptrend since the pandemic lows of 2020. The double top formation from 45k measured target has already been exceeded, and the index is now approaching a critical confluence support zone between 37k and 37,700.
📌 My Outlook:
• I believe this support will hold in the near future, presenting a buying opportunity.
• Resistances: 40k and 41,600 are important technical levels and potential targets for bulls.
💡 Alternative Scenario:
• If DJI starts rising without testing the long-term confluence support, I will focus on selling opportunities, particularly around the 41,500 zone, as we have 2 unfilled gaps from last week.
________________________________________
S&P 500 (SPX): Bear Market Territory, But Still Holding Uptrend (posted main chart)
According to classical theory, SPX is now officially in bear market territory. However, we are still above the ascending trend line established from the 2020 pandemic low, and approaching a confluence support zone around 4,820 - 4,900.
📌 My Outlook:
• I will be looking for buying opportunities if the index continues its decline towards the 4,820 - 4,900 zone next week.
• Target: Filling the first gap at 5,400.
💡 Alternative Scenario:
• If the week begins positively, and SPX doesn’t reach the 4,900 support zone, I will focus on shorting opportunities on gap filling, aiming for a return to 5,000.
________________________________________
Nasdaq 100 (Nas100): Hovering Above Key Support
Unlike DJI and SPX, Nas100 is still well above the ascending trend line from the 2020 pandemic low. However, it is nearing an important horizontal support defined by the 2021 ATH and the 2024 lows.
📌 My Outlook:
• Drops towards 17k or slightly lower could present good buying opportunities, anticipating a potential rise to fill the gaps.
💡 Alternative Scenario:
• If the price rises above 18.500k zone without dipping under 17k I will look for selling opportunities.
Disclosure: I am part of Trade Nation's Influencer program and receive a monthly fee for using their TradingView charts in my analyses and educational articles.
Institutional Demand: SP500 longsHey,
Trump’s April 2025 tariffs triggered a global market crash, with the Dow plunging and the Nasdaq entering a bear market. China retaliated, raising recession fears. News warns of rising unemployment, inflation, and a major economic slowdown.
So what does this mean for us as traders and investors?
Volatility equals opportunity.
The S&P 500 is approaching a strong demand zone and trendline. I’m not a fan of trying to catch the exact bottom — just have a consistent plan to scale in, buy once at the zone or do it in chunks. But with prices this low, it’s a great time to consider adding more. Data shows, every major crash has rebounded sooner than expected for the past 100 years.
Great opportunities where fear makes people miss it.
Kind regards,
Max
"SPX500/US500" Index CFD Market Heist Plan (Swing/Day Trade)🌟Hi! Hola! Ola! Bonjour! Hallo! Marhaba!🌟
Dear Money Makers & Robbers, 🤑💰✈️
Based on 🔥Thief Trading style technical and fundamental analysis🔥, here is our master plan to heist the "SPX500 / US500" Index CFD Market. Please adhere to the strategy I've outlined in the chart, which emphasizes short entry. Our aim is the high-risk Green Zone. Risky level, oversold market, consolidation, trend reversal, trap at the level where traders and bullish robbers are stronger. 🏆💸Book Profits Be wealthy and safe trade.💪🏆🎉
Entry 📈 : "The vault is wide open! Swipe the Bearish loot at any price - the heist is on!
however I advise to Place sell limit orders within a 15 or 30 minute timeframe most recent or swing, low or high level.
Stop Loss 🛑: (5730) Thief SL placed at the nearest / swing high level Using the 8H timeframe swing / day trade basis.
SL is based on your risk of the trade, lot size and how many multiple orders you have to take.
Target 🎯: 5300 (or) Escape Before the Target
🧲Scalpers, take note 👀 : only scalp on the Short side. If you have a lot of money, you can go straight away; if not, you can join swing traders and carry out the robbery plan. Use trailing SL to safeguard your money 💰.
"SPX500 / US500" Index CFD Market Heist Plan (Swing/Day) is currently experiencing a bearishness,., driven by several key factors.
📰🗞️Get & Read the Fundamental, Macro Economics, COT Report, Geopolitical and News Analysis, Sentimental Outlook, Intermarket Analysis, Index-Specific Analysis, Positioning and future trend targets... go ahead to check 👉👉👉🔗
⚠️Trading Alert : News Releases and Position Management 📰 🗞️ 🚫🚏
As a reminder, news releases can have a significant impact on market prices and volatility. To minimize potential losses and protect your running positions,
we recommend the following:
Avoid taking new trades during news releases
Use trailing stop-loss orders to protect your running positions and lock in profits
💖Supporting our robbery plan 💥Hit the Boost Button💥 will enable us to effortlessly make and steal money 💰💵. Boost the strength of our robbery team. Every day in this market make money with ease by using the Thief Trading Style.🏆💪🤝❤️🎉🚀
I'll see you soon with another heist plan, so stay tuned 🤑🐱👤🤗🤩
Corrective waves and trade war at the same time.Even before the trade wars started, I think the uptrend was over.
* The purpose of my graphic drawings is purely educational.
* What i write here is not an investment advice. Please do your own research before investing in any asset.
* Never take my personal opinions as investment advice, you may lose your money.
Geopolitics, Rates, and Risk: Why 1987 Is Back on the RadarThe current mix of geopolitical tensions, policy uncertainty, and fragile market sentiment brings to mind the setup ahead of October '87.
Without stabilizing signal, especially from the U.S. administration this weekend, the risk of a sharp correction is not negligible.
S&P 500 Daily Chart Analysis For Week of April 4, 2025Technical Analysis and Outlook:
During this week's trading session, the Index experienced lower openings, completing the Outer Index Dip at 5403, as highlighted in the previous week's Daily Chart analysis. This development lays a foundation for a potential decline targeting the Outer Index Dip at 5026, with the possibility of further extension to the subsequent target of the next Outer Index Dip, 4893. An upward momentum may materialize at either completed target level, with the primary objective being the Mean Resistance level of 5185.
SPX 1D 200 EMA Retest? As the 9&21W EMAs cross and a new local low printing after a SFP top, could the S&P500 be getting its first major correction since Jan 2022?
From a TA standpoint this kind of setup looks to be high probability with good R:R for the bears. Targeting the 1W 200 EMA is the most logical area as it remains major support and whenever tested holds strong.
From a bulls standpoint this is worrying but could be rectified with a reclaim of the 9&21 EMAs preventing a "death cross" from there acceptance above the high would be the next step to maintain the rally.
Fundamentals play a major role and the geopolitical world shows no signs of slowing down, perhaps the tariffs angle is introducing uncertainty in American companies? Or the index is just exhausted from 2.5 years of climbing? Either way the chart is an interesting one to monitor for now.
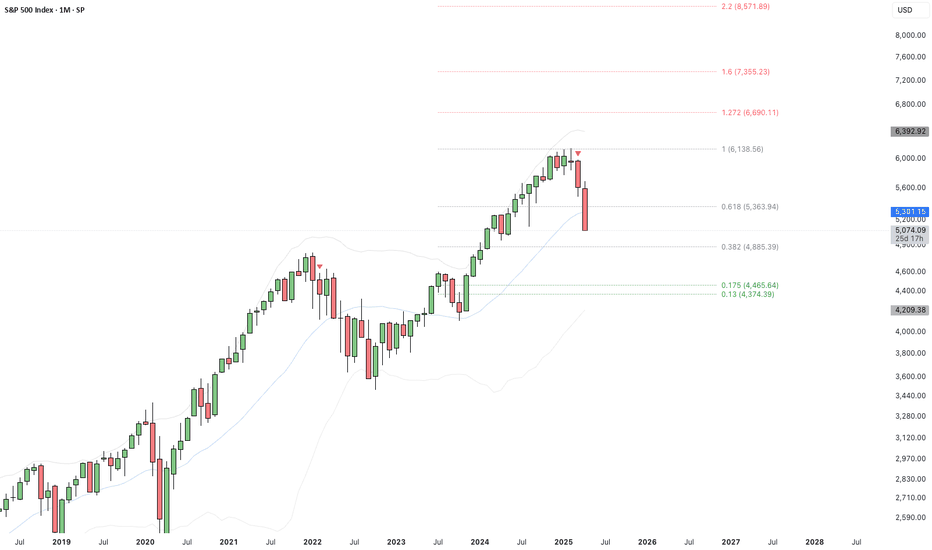
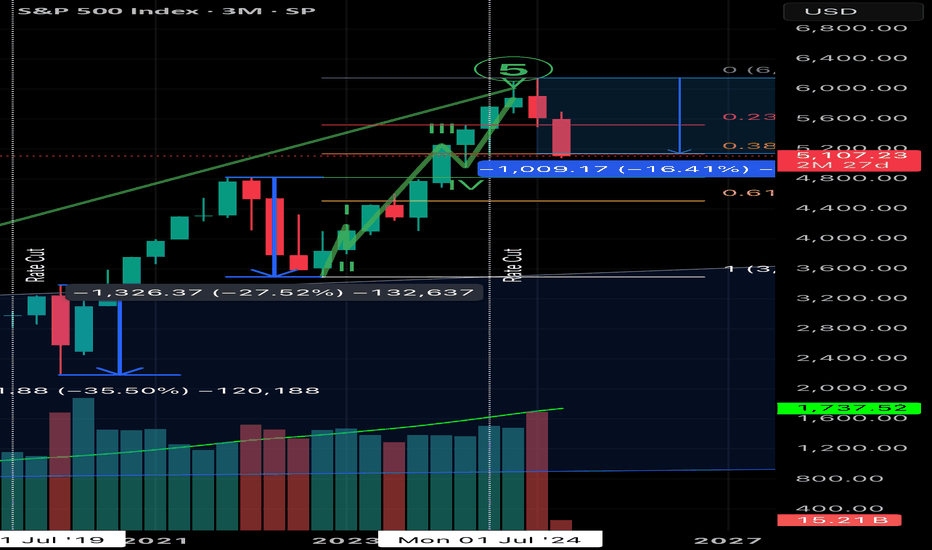
S&P 500 (SPX) 1M next week?The S&P 500 is pulling back from a key resistance after completing a bearish AB=CD pattern on the monthly chart. Price action suggests a potential correction toward the 4662–4700 zone, aligning with the 0.618 Fibonacci retracement level, which may serve as a key area for bullish reaccumulation. Momentum indicators show bearish divergence, hinting at a cooling rally.
Fundamentally, the index remains supported by strong earnings in tech and AI sectors, but risks persist from elevated interest rates, sticky inflation, and potential Fed policy shifts. A pullback into the 4662–4700 zone may offer a medium-term setup for continuation toward 5198 and potentially 5338. A breakdown below 4662 would invalidate the bullish structure and shift focus to lower Fibonacci levels.
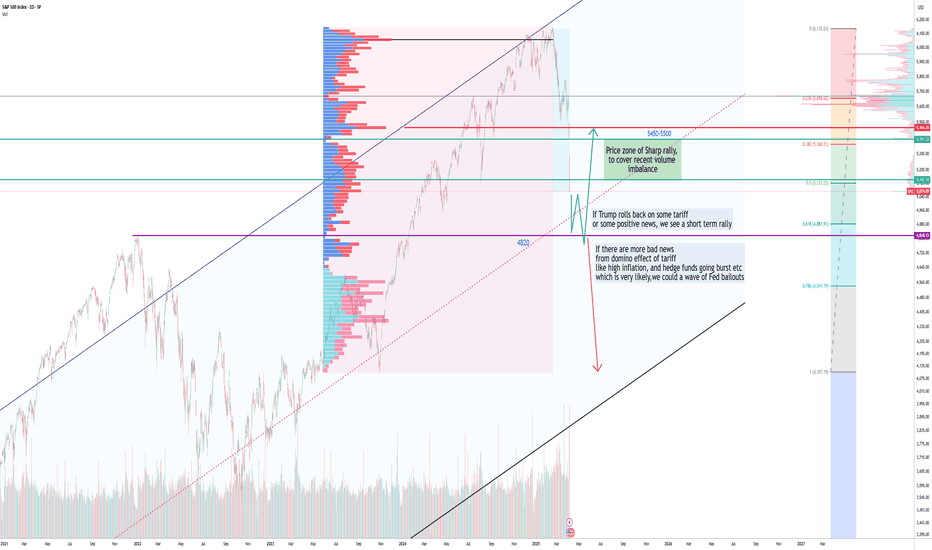
SPX, What is next? Trump knows best!Just putting my personal view based on market information and minimum speculation.
I hope my warning of a crash in my last post was useful
I rely heavily on volume profile and market geometry and of course my indicator( check it out: HiLo Ema squeeze bands)
I expect the market to fall to 4820 (about 61.8% fib level) to fill some volume gap, also 2022 peak, do a small a-b-c bottom and then rally back up to say 5450 ish, if some good news is heard. This would be just a bear rally
But I believe, Trump has opened a pandora's box and the market is still not aware of the full impact of it, or maybe it did realise and hence the crash
16% of USA budget is used for interest payment. If inflation rises and China and Japan keep selling treasuries, the bonds will go down. Not to speak of some major hedge funds like Citadel and banks holding trillions in treasury bond would increase their unrealised losses on bonds. But the stock market fall will force them to liquidate the bonds realise the loss, unless Fed buys the bonds back, which they will as always. That would be QE and the next bull run will begin. The banks have been holding the bonds since covid. Remember Silico Valley bank going burst! That was a sample.
Fed has managed to clicked the can down the road long, but Trumps policies will send the can in Fed's face
A financial liquidity baby seeded by Fed and Biden Adm during covid is about to take birth soon as financial crisis
I am bearish till Fed announces QE
Post-Liberation Day Sell-Off – Crash or Correction?Liberation Day has turned into a dramatic "blow the markets back out" day for the SPY , with a significant daily drop of nearly 6%, slicing decisively below the critical 200-day moving average at $574.46. Historically, breaking below the 200-day MA is a strong bearish signal, indicating potential further downside momentum.
The previously identified key bearish pivot, the "Best Price Short" at $565.16, served as a crucial resistance level from which sellers aggressively stepped in, intensifying today's sell-off. Given the current bearish sentiment, the next immediate downside targets without a significant bounce (dead-cat bounce) include:
Half 1 Short (Momentum target): $505.28 (already tested)
High Vol Momentum Target 1a: $497.66
Half 2 Short (secondary bearish momentum): $486.41
Extended Momentum Target (HH Vol Momo Target 2a): $475.16
For traders who missed the initial move, look to re-enter shorts if there's a modest retracement toward the previously broken "Weeks High Short" at $520.16, maintaining tight risk control with stops ideally set just above the "Best Price Short" ($565.16).
Critical levels summary:
Ideal Short Re-entry Zone: $520.16
Profit Targets: $497.66, $486.41, and ultimate $475.16
Stop Loss Area: Slightly above $565.16
Major Broken Support (Resistance now): 200-day MA at $574.46
Today's significant volume spike further reinforces bearish conviction. RSI is deeply oversold at 23.24, suggesting caution for potential short-term bounce, but any bounce is likely to be short-lived unless there's a substantial political or economic pivot soon.
These levels are algorithmically defined, designed to remove emotions from trading. Trade responsibly, adhere to your strategy, and protect your capital.
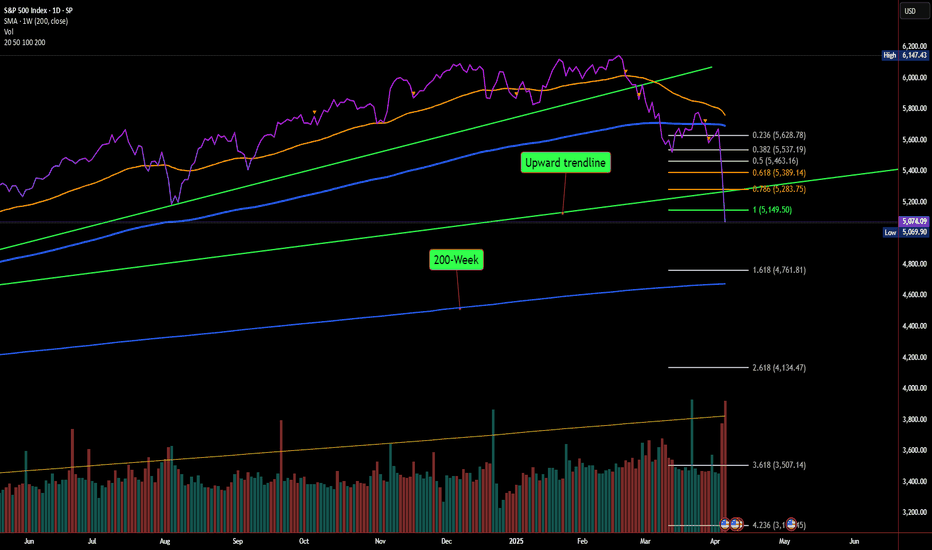
S&P 500 Breakdown: 4,790 Worst-Case Scenario in Play?Last week, I warned in this post that if sentiment worsened, the S&P 500 could head toward 4,790 as a worst-case scenario. Fast forward to today, and the index has officially lost the 5,149 support level, opening the door for further downside.
What Just Happened?
📉 Key Support Broken: The market just lost 5,149 (1.0 Fib retracement), which was a major line in the sand.
📉 Momentum Still Bearish: With no strong bounce, sellers remain in control, making 4,790 - 4,800 the next major target.
📉 Next Supports:
4,800 zone: A critical psychological level and my worst-case scenario target.
4,761 (1.618 Fib): A key confluence area for a potential bounce.
If the S&P 500 fails to reclaim 5,149 quickly, then the next downside targets are:
4,800 – A major area I highlighted last week.
4,761 – Aligns with the 1.618 Fib extension, adding confluence.
What Needs to Happen for a Rebound?
For bulls to take back control, the index must reclaim at least 5,149, or risk continued selling. A failed bounce could accelerate the move lower.
🚨 I called 4,790 as a worst-case target last week.
04/04 aka Doomsday Daily Trade RecapEOD accountability report: +$725
Sleep: 6 hour, Overall health: rly bad
**Daily Trade Recap based on VX Algo System **
9:49 AM Market Structure flipped bearish on VX Algo X3!
11:00 AM VXAlgo NQ 10M Buy Signal (triple buy signal)
1:02 PM VXAlgo ES 10M Buy signal,
1:25 PM VXAlgo ES 10M Buy signal,
Another wild day, market went extremely bearish and has been rejecting the 1 min resistance and playing out as expected.
S&P 500 to tank to 5,100 pointsPEPPERSTONE:US500
The S&P 500 broke below critical support after Trump announce massive tariffs on everyone, worst than expected. Volume is increasing to the downside, and it looks like the next wave down has already started.
Wave C is supposed to be equal or larger than wave A, and reach the next critical support, which will lead us to 5,100 points in the next couple of weeks.
I heard that net tariffs on China are 54%, does than means that iPhones are going to rise in price 54%?
Maybe it will be reconsidered later, and the market will bounce in the future, but not likely in the short term.
Good luck to you
SPX short term VP analysisI have done a short term volume profile analysis with support and resistance levels. Market is at long term trendline as well. I Expect a small bounce and some grinding for a week or so fighting the long term trendline.
Personally I think it will crash through the trendline after a week of grinding, but will watch closely and make short term trades
Liberation or Obliteration?Notice the pattern here, the last time we had a fed pivot the market went up for a couple of months and then a huge draw down. History doesn’t always repeat but it often rhymes. We are being held up by the 0.382 Fib, so we are technically still bullish believe it or now.
What’s next? If the tariff issues are not resolved we will get a total melt down, the likes of which we haven’t seen before.
So if you are hopeful that the tariffs will be resolved, this is an excellent opportunity to buy the dip. I was largely long gold but I have not almost exited my position, please look at my trade idea on gold which was a textbook long.
Now I’m putting that cash to work and slowly buying up the best assets the market has to offer. I will add to my long term investment in the AI companies, data center and top class software names. But I’m not going all in, I’m reserving dry powder for more draw downs. For now this technical analysis suggests now is the time to be slowly deploying.
Not financial advice, do what’s best for you.
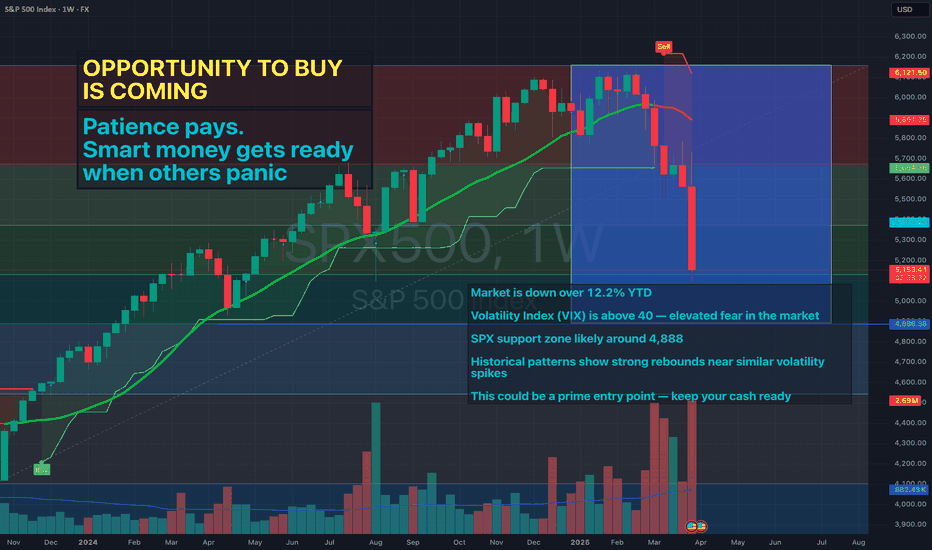
Markets hate tariffs but traders love discounts
SPX500 is down over 12.2% YTD
Volatility Index (VIX) is above 40 — elevated fear in the market
SPX support zone likely around 4,888
Historical patterns show strong rebounds near similar volatility spikes
This could be a prime entry point — keep your cash ready
With tariffs back in play, volatility could spike — stay ready for discounted entries
SP500- Don't be fooled by yesterday's pumpThe markets reacted strongly to Jerome Powell's latest commentary, sparking a notable rally. However, traders should be cautious before assuming this marks the beginning of a new uptrend. While there has been a slight shift in market structure, the broader trend remains intact. Overlooking the strength of the next resistance level could prove to be a costly mistake.
The Big Picture: S&P 500 Daily Chart Analysis
Examining the TRADENATION:US500 posted daily chart, the key question is: has the trend truly reversed? While a green-bodied candle signals some bullish momentum, SP500 remains below critical resistance levels. Notably, it closed beneath what I call the "Do or Die" zone—an area that aligns with prior lows and, more importantly, the daily 200 SMA. This suggests that what we’re seeing could be a lower high forming within the broader downtrend.
Hourly Outlook:
On the hourly chart, we see a strong reversal from 5500, but the move appears corrective rather than impulsive. It seems to be forming an ABC-style correction, with the market currently in wave C. Calculating the potential top of wave C, we find it aligns perfectly with a key resistance level and the 200-day SMA.
Conclusion:
While we may see some upside heading into the end of the week, I believe this rally will be short-lived. Once SP retests the broken support—now acting as resistance—I expect the downward trend to resume, with my target remaining at 5200 (as previously discussed).
Disclosure: I am part of Trade Nation's Influencer program and receive a monthly fee for using their TradingView charts in my analyses and educational articles.


