S&P 500: The Correction Is Not Over Yet – Targets Around 5000At the moment, the S&P 500 is holding relatively stable, but I believe the current decline is just part of a larger correction following decades of growth.
Right now, the index is retracing to the 50% pullback area (marked on the chart), which aligns with a typical retest before a potential continuation of the downward move. In this zone, a manipulation is likely, after which the decline may resume.
An additional confirmation of this scenario is the unfilled gap below, which remains uncovered. Historically, the market tends to close such gaps. Moreover, there are untested price levels lower on the chart, suggesting a high probability of further downside movement, with targets around 5000 points.
I will keep monitoring the situation and update my outlook as new data emerges.
S&P 500 (SPX500)

Price climbing with Volume warningsPrice climbed after the bullish headsup we had on Friday
Strong bullish signs:
Strong close with little selling at the top
Closing above LT MA's and daily previous high
Bearish: Volume is not picking up - hint that this is an up reaction but the trend is still down, be careful with longs at this point
#SPX - 25 MarHuge run up in #SPX after a gap up. Strongly bullish for further upside.
Any dips is a buying opportunity. Looking at PZ to hold for another leg higher, or if it breaks, look at 5700 for a long up to 5880 then 6000.

Dow Jones on the weekly chartAs you can see, due to recent economic news and Trump's economic approaches, we have unfortunately witnessed a decline in major indices, including the Dow Jones. We are currently at the last available support level, which is the bottom of the Dow Jones long-term channel, and we need to see how it reacts to this level in tomorrow's news and the CPI release.

Breaking: SPX6900 ($SPX) Surged 21% Today The price of SPX6900 ( SP:SPX ) surged Nearly 25% today amidst breakout of a falling wedge.
Created on the Ethereum blockchain, SPX6900 is an advanced blockchain cryptography token coin capable of limitless possibilities and scientific utilization. With a growing momentum and hardworking community the coin seems to be a contender in the incoming bullrun speculated by traders.
As of the time of writing, SP:SPX is up 16.35% trading in tandem with the 1-month high axis. a break above that point could signal a trend continuation to the $0.70 - $0.80 pivot.
Similarly, should SP:SPX cool-off, immediate consolidation point resides in the 38.2% Fibonacci retracement point.
SPX6900 Price Live Data
The live SPX6900 price today is $0.616856 USD with a 24-hour trading volume of $45,031,583 USD. SPX6900 is up 21.61% in the last 24 hours, with a live market cap of $574,288,459 USD. It has a circulating supply of 930,993,090 SPX coins and a max. supply of 1,000,000,000 SPX coins.

SPX us500The index has a target price range of 5991, there is a possibility of going up from this moment, but another possibility is that the range of 5520 will be touched and then it will move up.

S&P500 INTRADAY oversold bounce back capped at 5777S&P500 INTRADAY oversold bounce back capped at 5777
Key Support and Resistance Levels
Resistance Level 1: 5777
Resistance Level 2: 5844
Resistance Level 3: 5872-5920
Support Level 1: 5604
Support Level 2: 5539
Support Level 3: 5500
This communication is for informational purposes only and should not be viewed as any form of recommendation as to a particular course of action or as investment advice. It is not intended as an offer or solicitation for the purchase or sale of any financial instrument or as an official confirmation of any transaction. Opinions, estimates and assumptions expressed herein are made as of the date of this communication and are subject to change without notice. This communication has been prepared based upon information, including market prices, data and other information, believed to be reliable; however, Trade Nation does not warrant its completeness or accuracy. All market prices and market data contained in or attached to this communication are indicative and subject to change without notice.

SPY/QQQ Plan Your Trade for 3-24-25 : Bozu Trending PatternToday's Bozu Trending pattern suggests a very aggressive price move is likely. I believe this move will be to the upside after my weekend research suggested we are moving into a "blow-off" topping pattern that will act as a Bull Trap.
Overall, I belive the SPY/QQQ have about 2-3 days up upward price trending early this week, then the markets will suddenly roll into a topping pattern and start to aggressively move downward.
The next base/bottom of the continued downward price trend sets up in early/mid April. The March 21-24 base/bottom is likely the minor base/bottom we have seen over the past 3-5+ days.
I believe the breakdown in the SPY/QQQ late this week and into next week will result in a new lower low - causing the Consolidation phase of this downturn to extend down to the 520-525 level on the SPY.
Bitcoin is very close to my $88,000 upper target level (only about $250 off that level). Get ready, BTCUSD should make an aggressive move downward after stalling near the FWB:88K level peak.
Gold and Silver are moving into a trending mode. I believe both Gold and Silver will rally this week and into the next few weeks as we expand into the Expansion phase.
Buckle up. If my research is correct, we are going to see a BIG ROLLOVER this week.
Get some.
#trading #research #investing #tradingalgos #tradingsignals #cycles #fibonacci #elliotwave #modelingsystems #stocks #bitcoin #btcusd #cryptos #spy #gold #nq #investing #trading #spytrading #spymarket #tradingmarket #stockmarket #silver

S&P 500 Setting Up for a Breakout – But Not Before One More TrapAs I’ve said before, the FOREXCOM:SPX500 is a key reference for my crypto trading . That’s why I sat down and took a closer look at the chart – and I’m now ready to place a limit order , based on what I’m seeing.
I believe we’re still in a correction phase , and it’s far from over . However, I think it’s realistic that we’ll see a move toward $5,832 next week . Before that happens, I expect either today’s Monday Low or next week’s Previous Weekly Low to get swept, ideally triggering a dip into the 12-hour Fair Value Gap just below.
That’s where I see my entry zone forming. It’s also the exact area where Wave B overshoots the starting point of Wave ABC, making it a clean Flat correction pattern, with Wave C completing to the downside before we get a solid move upward.
I’m setting my stop-loss below the $5,500 low. If this setup plays out, I expect the S&P to push toward $5,832 , and after that, I’m anticipating a larger correction that could take the index back down to $5,500 or even $5,450 over the coming weeks.
Timing remains unclear for that move after, but the structure is here , and I’m looking forward to seeing how it plays out.

Looking for a minimum of ES 5850In the days to come our initial pattern off the recent has the high probability to get into the 5850 area.
Here I will be looking for a pullback.
If this pullback can be viewed as corrective in it's structure then I expect the subdivisions and pathway on my ES4Hr chart should follow suit. However, if the pullback turns out to be impulsive, I will be looking for follow through for either Minor B having completed early, or the alternate wave (iv). If that sort of price action were to materialize, it's Friday's low of 5651.25 that must support any drop if we're to continue to subdivide higher and have this minor B take more time.

S&P nearing the 38% retracement and flag top! Intraday Update: The S&P futures are up today following possible tariff news being factored in from some weekend headlines about "targeted reciprocal tariffs" for April 2nd, which is allowing for the S&P to near the 38% retracement which would be the top of the beer flag pattern and setup.

S&P 500 Analysis: Markets Start the Week on a Positive NoteS&P 500 Analysis: Markets Start the Week on a Positive Note
A week ago, while analysing the S&P 500 index chart (US SPX 500 mini on FXOpen), we noted that the market had officially entered a correction phase, as the price had declined more than 10% from its February 19 peak. This drop was driven by mounting uncertainty over the potential economic damage caused by the Trump administration’s tariff policies in international trade.
However, this morning, markets are showing signs of optimism following reassuring statements from officials over the weekend.
According to Reuters:
→ Trump announced plans to hold talks with Chinese President Xi Jinping, while the U.S. Trade Representative is set to meet his Chinese counterpart this week.
→ The European Union has taken a conciliatory stance, delaying its initial countermeasures against the U.S. until mid-April.
As a result, sentiment appears to have shifted towards optimism, with the S&P 500 index (US SPX 500 mini on FXOpen) trading approximately 4% above this month’s low.
Technical Analysis of the S&P 500 Index (US SPX 500 mini on FXOpen)
As noted on 17 March:
→ The price is forming an ascending channel (marked in blue).
→ The fact that the price has reached the lower boundary of the channel suggests that bearish momentum may be fading.
Currently, we are witnessing an attempt at a bullish reversal from the channel’s lower boundary.
From a bearish perspective, resistance may emerge around the 5750 level, where the price has previously reacted (as indicated by the arrows).
From a bullish perspective:
→ Bears have lost control of the 5600 level.
→ A bullish gap at the start of the week indicates a significant shift in market sentiment. If positive news continues to emerge throughout the week, the S&P 500 index (US SPX 500 mini on FXOpen) could attempt a rise towards the median of the identified channel.
This article represents the opinion of the Companies operating under the FXOpen brand only. It is not to be construed as an offer, solicitation, or recommendation with respect to products and services provided by the Companies operating under the FXOpen brand, nor is it to be considered financial advice.

S&P500 Next Key Levels I will be waiting to see if we get some short term buying before continuing down to $5,200 levels.
Waiting for price to reach the $5,800 area and anticipating a strong rejection to continue the bearish trend.
After confirmation of the rejection, I will be looking for simple lower lows, lower highs before entering a sell, preferably around the $5,600 mark.
What are your thoughts on the AMEX:SPY and the THINKMARKETS:USDINDEX in general?

BUY SPX500SPX500 Trade Idea: Bullish Continuation Setup
Market Overview
The SPX500 has shown strong bullish momentum, and a continuation of this trend is likely if price holds above the 5,772-support area. A confirmed breakout from this level could provide an ideal buying opportunity.
Trade Setup
Entry: Buy at 5,733 (waiting for confirmation at key support)
Stop Loss (SL): 5,525 (below strong support zone)
Take Profit (TP): 6,154 (next key resistance level)
Analysis & Rationale
✅ Bullish Trend Continuation – Price action suggests strong momentum, favoring further upside.
✅ Key Support at 5,772 – A breakout above this level will confirm bullish strength.
✅ Favorable Risk-to-Reward Ratio – Well-defined SL and TP provide a balanced strategy.
Trading Plan & Execution
Wait for confirmation at 5,772 before entering.
If price holds, execute a buy order at 5,733.
Set SL at 5,525 to limit downside risk.
Take profit at 6,154, adjusting the stop-loss accordingly if price gains momentum.
This trade setup follows the bullish market structure, providing an opportunity to capitalize on SPX500’s continued upside potential. However, monitor economic data and global market sentiment for any shifts in trend.
📌 Risk Disclaimer: Always implement proper risk management and adjust your strategy as market conditions evolve.

Trading Is Not Gambling: Become A Better Trader Part III'm so thankful the admins at Tradingview selected my first Trading Is Not Gambling video for their Editor's Pick section. What an honor.
I put together this video to try to teach all the new followers how to use analysis to try to plan trade actions and to attempt to minimize risks.
Within this video, I try to teach you to explore the best opportunities based on strong research/analysis skills and to learn to wait for the best opportunities for profits.
Trading is very similar to hunting or trying to hit a baseball... you have to WAIT for the best opportunity, then make a decision on how to execute for the best results.
Trust me, if trading was easy, everyone would be making millions and no one would be trying to find the best trade solutions.
In my opinion, the best solution is to learn the skills to try to develop the best consistent outcomes. And that is what I'm trying to teach you in this video.
I look forward to your comments and suggestions.
Get some.
#trading #research #investing #tradingalgos #tradingsignals #cycles #fibonacci #elliotwave #modelingsystems #stocks #bitcoin #btcusd #cryptos #spy #gold #nq #investing #trading #spytrading #spymarket #tradingmarket #stockmarket #silver

Weekly Market Forecast SP500 NASDAQ DOW: Short Term BUYS!In this video, we will analyze the S&P 500, NASDAQ, AND DOW JONES Futures for the week of March 24 - 28th. We'll determine the bias for the upcoming week, and look for the best potential setups.
The equity markets have been choppy lately, but this week may be different. The economic calendar shows a smooth week ahead, as there are no NFP, FOMC, or similarly volatile news ahead to potentially reverse a market out of the blue. The indices show potential to break consolidation and move upwards. So we wait until there are definitive market structure shifts to occur, acting as confirmations.
Only then do we pounce!
Enjoy!
May profits be upon you.
Leave any questions or comments in the comment section.
I appreciate any feedback from my viewers!
Like and/or subscribe if you want more accurate analysis.
Thank you so much!
Disclaimer:
I do not provide personal investment advice and I am not a qualified licensed investment advisor.
All information found here, including any ideas, opinions, views, predictions, forecasts, commentaries, suggestions, expressed or implied herein, are for informational, entertainment or educational purposes only and should not be construed as personal investment advice. While the information provided is believed to be accurate, it may include errors or inaccuracies.
I will not and cannot be held liable for any actions you take as a result of anything you read here.
Conduct your own due diligence, or consult a licensed financial advisor or broker before making any and all investment decisions. Any investments, trades, speculations, or decisions made on the basis of any information found on this channel, expressed or implied herein, are committed at your own risk, financial or otherwise.

Trendline Broken – Is the Bull Run in Trouble?The S&P 500 index is currently exhibiting a critical technical structure. After forming a series of Higher Highs (HH) and Higher Lows (HL) within a well-respected rising trendline, the price recently made an All-Time High (ATH) but has since shown signs of weakness. The trendline, which has acted as a dynamic resistance multiple times, has now been broken.
At present, the price is retesting the key horizontal support zone and the 200 EMA after the breakdown. This retest is crucial—a rejection here could confirm a bearish shift, potentially leading to lower levels near the next key support zone. Additionally, the RSI is displaying a bearish divergence, signaling weakening momentum despite recent highs.
Key Takeaway:
Watch for confirmation at the retest zone. A rejection may signal a deeper correction, while a reclaim of the trendline and 200 EMA could reestablish the bullish structure. Risk management is key at these pivotal levels.

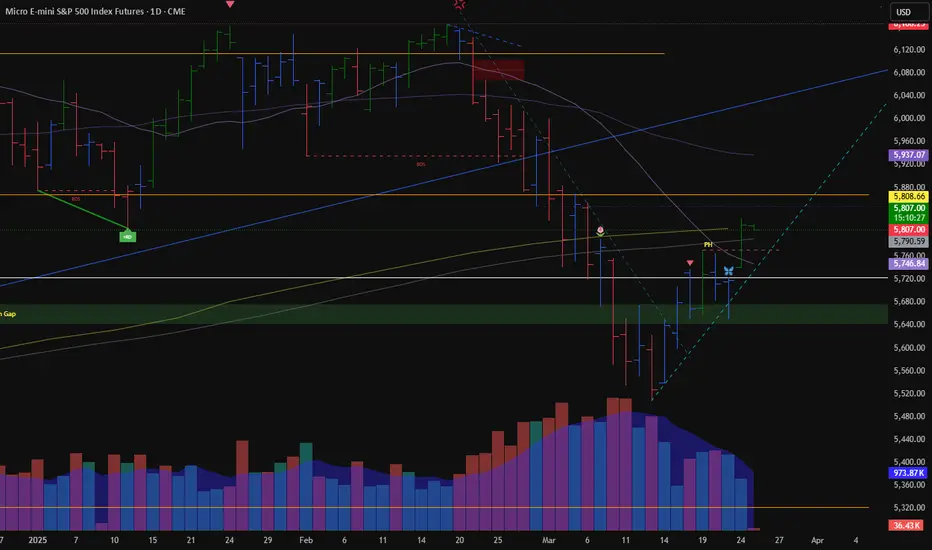
S&P500 The Week Ahead 24th March '25S&P500 bearish & oversold, the key trading level is at 5766
This communication is for informational purposes only and should not be viewed as any form of recommendation as to a particular course of action or as investment advice. It is not intended as an offer or solicitation for the purchase or sale of any financial instrument or as an official confirmation of any transaction. Opinions, estimates and assumptions expressed herein are made as of the date of this communication and are subject to change without notice. This communication has been prepared based upon information, including market prices, data and other information, believed to be reliable; however, Trade Nation does not warrant its completeness or accuracy. All market prices and market data contained in or attached to this communication are indicative and subject to change without notice.

S&P 500 Daily Chart Analysis For Week of March 21, 2025Technical Analysis and Outlook:
During the course of this week's trading session, the S&P 500 achieved the designated target for the Inner Index Rally at 5576, which occurred midweek. This target was accompanied by considerable volatility, ultimately hindering upward movement. On the week's final trading day, the index experienced a notable decline, resulting in a significant drop that reached our critical target, Mean Support, at 5603.
Consequently, the index is now poised to target a retest of the Inner Index Rally level 5712, with a subsequent potential target identified at the Mean Resistance level 5840. It is essential to consider that upon reaching the Inner Index Rally target of 5712, a decrease in the current price level is anticipated, which may lead to a retest of the Mean Support at 5601. Furthermore, an extended decline is possible to revisit the completed Outer Index Dip at 5520 before the resumption of an upward rally.

S&P500 INTRADAY Bearish oversold bounce back Key Support and Resistance Levels
Resistance Level 1: 5714
Resistance Level 2: 5770
Resistance Level 3: 5872-5920
Support Level 1: 5500
Support Level 2: 5387
Support Level 3: 5254
This communication is for informational purposes only and should not be viewed as any form of recommendation as to a particular course of action or as investment advice. It is not intended as an offer or solicitation for the purchase or sale of any financial instrument or as an official confirmation of any transaction. Opinions, estimates and assumptions expressed herein are made as of the date of this communication and are subject to change without notice. This communication has been prepared based upon information, including market prices, data and other information, believed to be reliable; however, Trade Nation does not warrant its completeness or accuracy. All market prices and market data contained in or attached to this communication are indicative and subject to change without notice.

German $DAX ($EWG) Topping Out?Originally posted on 3/12, but blocked b/c I referenced my X account. Looks like a bearish move could be materializing alongside broader risk asset weakness:
Is the XETR:DAX topping out? Monthly RSI @ 80+ w/ weekly nosing over and daily bearish divergences observable. Index high from 3/6 coincided with the 261.8% Fibonacci extension of the 11/2021-10/2022 uptrend correction.
Confirmation short setup could materialize $FDAX closes below pivot low of the 1D uptrend (22226), bounces off of short-term demand (ex: 22142-21691, and trades into supply ≥ 22226. This scenario is speculative - the market needs to show its hand.
Presently, DAX is up > 1.5% alongside US stocks, which dipped into intermediate-term demand and benefited from softer-than-expected CPI prints. However, DAX (and domestic) bulls haven't proven anything yet. Unless buyers manage to push the DAX higher - initially above 22900 and secondarily through 23000-23200 - on accelerating momentum, risk remains to the downside (IMO). German stocks have been global relative strength leaders as of late, so if they do correct, other equity indexes may retreat in tandem.
Long-term charts for US indices ( SP:SPX , NASDAQ:NDX , TVC:RUT ) look more bearish vs. bullish (I still have some shorts on), though a near-term recovery is plausible. If domestic equities do trade lower, selling could materialize in Asian and European markets. Use LTF charts to monitor price action/manage risk and splice into shorts if German stocks AMEX:EWG start to crack.
My $0.02. Feedback welcome.
Jon

SPX500 2nd Leg Down? 21 Mar 2025
Yesterday's candlestick closed as a bull bar in its lower half with a long tail above.
In yesterday's report, we said traders would see if the bulls could create a strong retest of yesterday's (Mar 19) high followed by a breakout above. Or if the retest would lack follow-through buying, stalling around or slightly above yesterday's high area.
The market formed a retest of the March 19 high, but stalled and formed a lower high.
We said the move while strong, likely was simply a bull leg and a buy vacuum test of the trading range high. If true, sellers would emerge near the trading range high, which was the case. (Please refer to the tagged post)
The bulls want the market to form a 2 legged sideways to up pullback.
The pullback is currently underway but has a lot of overlapping candlesticks. The bulls are not yet as strong as they hope to be.
They need to create credible buying pressure - consecutive bull bars closing near their highs to increase the odds of testing the 20-day EMA or the January 13 low.
For today, the market may open lower today. If the market continues down, they hope the March 18 low will act as support, forming a small double bottom bull flag.
The bears see any pullback as minor. They expect at least a small second leg sideways to down to retest the Mar 13 low after the pullback phase.
The 9-bar bear microchannel on the daily chart and the 4-bar bear microchannel on the weekly chart increase the odds that the first pullback (current pullback) would be minor and not lead to a reversal up.
They hope the leg to retest the March 13 low will begin soon. They must create strong bear bars with follow-through selling to increase the odds of another leg down.
The prior climactic selloff and parabolic wedge increase the odds of a pullback which is underway.
Traders will see the strength of the pullback. If it is strong (consecutive bull bars closing near their highs), they may look for a retest of the breakout point - Jan 13 low.
If the pullback lacks follow-through buying (overlapping candlesticks, doji bars, bear bars, long tails above bars), the odds of another leg down AFTER the pullback phase increase.
So far, the pullback has a lot of overlapping candlesticks which indicates that the bulls are not yet as strong as they hope to be.
For now, traders will see if the bears can create a strong bear bar today.
Or will the market open lower but lack follow-through selling, like yesterday?
I will update again later today.

SPY/QQQ Plan Your Trade for 3-21-25 : BreakAway PatternToday's Breakaway pattern may show up in the form of an Island Top or break-away to the upside if my analysis is correct.
I see the markets stalling over the past few days, potentially setting up a "last breakaway" type of pattern today.
I've highlighted how these "last" patterns work where price sets up a peak or trough (in this case a peak) as a last/exhaustion move and how this move can sometimes be very aggressive.
I urge traders to stay cautious today as we are moving into a MAJOR REVERSAL weekend.
I believe the markets will suddenly change direction next week (early) and will move back into downward trending by March 25-26.
Gold and Silver may rally today if the markets move into that Exhaustion Peak pattern. Keep an eye out for Gold/Silver/Bitcoin to potentially rally today and into early next week.
Overall, traders should stay very cautious as we move into next week's peak/top/rollover.
Don't get too aggressive trying to prepare for the rollover or any potential upside move over the next 3-5+ days.
Let the markets show us what and when we need to be aggressive.
Get Some.
#trading #research #investing #tradingalgos #tradingsignals #cycles #fibonacci #elliotwave #modelingsystems #stocks #bitcoin #btcusd #cryptos #spy #gold #nq #investing #trading #spytrading #spymarket #tradingmarket #stockmarket #silver
