I don't think US markets have bottomed outThe US stock markets are down.
I don't think they've bottomed out - there could be further downside to come - but this could be a fantastic opportunity for longer-term traders and investors. Buying the dip is often profitable for buy-and-hold investors.
As a trader, I'm still actively looking for index shorting opportunities.
S&P 500 (SPX500)

Most Probable Outcome (SPY, SPX)Looking at recent pullbacks and Shiller Cape. My most probable outcome for this S&P Correction is 5400. Finding the first big support under the 200 DMA. Shiller Cape around 35 at that level.

Bearish Outlook for VX1!Bearish Post Description for TradingView
Title: Bearish Outlook on VIX Futures - Time to Brace for a Pullback!
Hey traders, take a look at this VIX Futures chart (CBOE Volatility Index - VX1 Futures) published by FairValueBuffet on TradingView (Mar 10, 2025, 20:58 UTC). The technicals are screaming caution, and here’s why:
- Supply/Demand Zone Breakdown: We’ve hit a critical supply zone (highlighted in yellow) with a sharp spike, suggesting heavy selling pressure. The price action is showing rejection at this level, hinting at a potential reversal.
- Moving Averages: The 18-week and 52-week SMAs are converging, with the price breaking below the shorter-term SMA, reinforcing bearish momentum.
- Bearish Divergence: The RSI and Williams %R at the bottom show clear bearish divergence. Despite a price spike, the momentum indicators are declining, indicating weakening bullish strength.
- Seasonality Indicator: The bottom-right seasonality chart (COT data for VX Futures) shows a historical tendency for volatility spikes around this time, often followed by a correction.
With the VIX jumping to 24.700 and a volume of 137.66K, coupled with the bearish technical setup, I’m anticipating a pullback in the near term. Keep an eye on the 20.000 support level—failure to hold could see us testing lower grounds. Let’s stay cautious and consider short opportunities or hedging strategies!
---
CBOE:VX1! CME_MINI:ES1! AMEX:SPY
Bullish Case for S&P 500 - Fundamental Perspective
While the VIX chart suggests short-term volatility, the broader S&P 500 presents a compelling bullish case based on fundamentals as of March 10, 2025. Here’s why we might see upside potential:
- Economic Resilience: Recent data points to robust corporate earnings growth, with many S&P 500 companies exceeding Q4 2024 expectations. This earnings strength supports a sustained rally.
- Interest Rate Outlook: The Federal Reserve has signaled a dovish stance, with potential rate cuts on the horizon. Lower interest rates typically boost equity valuations, especially for growth stocks in the S&P 500.
- Gold and Bonds Correlation: The chart shows a dip in gold prices and bond yields stabilizing, which historically correlates with risk-on sentiment. This could drive capital back into equities, favoring the S&P 500.
- Market Sentiment: Despite short-term volatility (as seen in the VIX), investor confidence remains high, supported by strong consumer spending and improving global trade conditions.
Given these fundamentals, the S&P 500 could be poised for a bullish run, especially if volatility subsides and the 18-week SMA on the VIX chart starts to flatten. Consider long positions or adding exposure if the market holds key support levels. Stay tuned for confirmation!
---
Note: This analysis is based on the provided chart and my knowledge up to March 10, 2025. For the latest updates or to validate these trends, I can perform a web search or analyze additional X posts if requested!
Not Financial Advice

Start of bearish cycle for equities $SPXSP:SPX confirming trend reversal on high time frame as it attempts to breach the 50 weekly MA for the first time since the start of the 2022 bear market. Macroeconomic environment is full of uncertainty and recession signals, with POTUS Trump openly confirming that some short term pain in assets is needed for the US economy to reset and go on a better path forward.
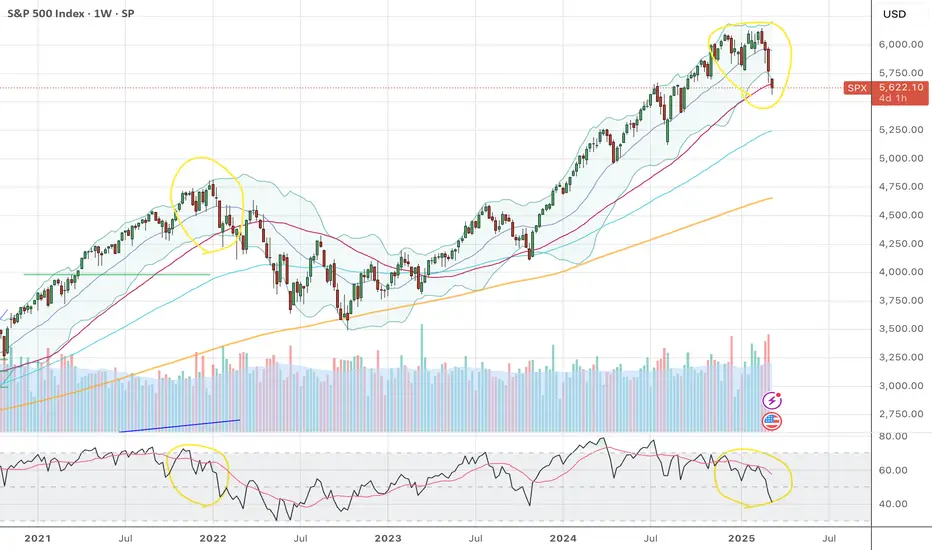
S&P 500 Breakdown at Key Support LevelThe S&P 500 is showing clear signs of technical weakness as it breaks below a key support level around 5,675, coinciding with the 200-day EMA. This breakdown follows a rejection at 6,130, a recent high that established a resistance zone.
With the index now trading below the 50-day EMA, downside risks are increasing. If the 5,668 level fails to hold, further declines toward the next major support zone could materialize. Traders will be watching for a potential retest of broken support as resistance before determining the next move.
Key Levels to Watch:
📉 Support: 5,668
📈 Resistance: 6,130
-MW

S&P INTRADAY Bearish & Oversold Capped by 5768 resistanceKey Support and Resistance Levels
Resistance Level 1: 5768
Resistance Level 2: 5800
Resistance Level 3: 5920
Support Level 1: 5647
Support Level 2: 5624
Support Level 3: 5560
This communication is for informational purposes only and should not be viewed as any form of recommendation as to a particular course of action or as investment advice. It is not intended as an offer or solicitation for the purchase or sale of any financial instrument or as an official confirmation of any transaction. Opinions, estimates and assumptions expressed herein are made as of the date of this communication and are subject to change without notice. This communication has been prepared based upon information, including market prices, data and other information, believed to be reliable; however, Trade Nation does not warrant its completeness or accuracy. All market prices and market data contained in or attached to this communication are indicative and subject to change without notice.

SPY/QQQ Plan Your Trade For 3-10-25: Gap/BreakawayToday's Gap Breakaway pattern suggests the markets will attempt to gap at the open, then move into a breakaway trending phase.
Given the downward price trend currently in place, I believe the markets will gap downward, then possibly attempt to move higher as we pause above the 568 (pre-election) support level.
Ultimately, I see the markets entering a brief pause/sideways price trend (maybe 2 to 5 days) before rolling downward again into the April 14 and May 2 base/bottom patterns.
I see very little support in the markets right now - other than a potential BOUNCE setup this week and into early next week.
I'm not suggesting this bounce will be a very big bullish price reversion. My upper levels are still in the 590 to 600 area for the SPY. But I do believe the markets are likely to try to find support near the 565-575 level.
Gold and silver will move into a Harami Pattern today (sideways consolidation). I don't expect much related to a big move in metals today.
Bitcoin is still consolidating in a very wide range. I expect the next move for Bitcoin to be a bit higher over the next 3-5+ days, so I believe the SPY/QQQ may trend a bit higher for about 3-5 days.
Overall, I suggest traders stay very cautious of volatility this week. Obviously, the trend is still bearish and the current EPP phase setups suggests we are consolidating into a sideways channel before moving downward seeking the Ultimate Low patterns.
Therefore, any bounce/pause in price will be very short-lived.
Get some.
#trading #research #investing #tradingalgos #tradingsignals #cycles #fibonacci #elliotwave #modelingsystems #stocks #bitcoin #btcusd #cryptos #spy #gold #nq #investing #trading #spytrading #spymarket #tradingmarket #stockmarket #silver

10/03/25 Weekly outlookLast weeks high: $93,745.25
Last weeks low: $80,029.90
Midpoint: $86,887.58
Last week in crypto saw the first White House Digital Assets Summit. An event that only as recently as the last bull cycle we could only dream of taking place. In the summit that hosted the biggest names in the space a vow was made by the US Gov never to sell their BTC, to establish stablecoin regulatory clarity and to stockpile various US made altcoins. A historic moment but how did that relate to the chart?
Well BTC dropped 14.6% from weekly high set at the beginning of the week to weekly low set at the end of the week. The most important aspect is how this now looks on the higher time frames, the once strong support level of $91K has now been confirmed as new resistance as BTC tried several times to reclaim it and in the end fell away. This now puts BTC in the FVG area from $91-73K. With no real support until the $73,000 level this is knife catching territory and with the SP:SPX rolling over too I would need a lot more evidence that BTC will turn around before going long with any real size.
This week I anticipate further sell-off, now I would be happy to be proven wrong on that however it does look like we are heading towards FWB:73K where I would like to see buyers stepping up and start to dominate the orderbooks. Structurally that would fill a large inefficiency area with an eye to bounce off support and move back towards currently levels ~ GETTEX:82K as that would be the midpoint of the FVG although that is a few steps in the future.
CPI takes place this week and so volatility may be expected but unless the result is wildly different to the forecast numbers the whipsaw PA should level out fairly neutral.
Invalidation on this idea would be a successful reclaim of $91K which is previous mini range low & 4H 200 EMA resistance.

Is Trump’s Golden Age a Recession in the Making? Let’s Find Out“This tariff low key slaps,” says no trader ever as markets get jerked and jolted day in and day out because no one can really figure out what’s happening. On some days, US President Donald Trump wakes up and chooses to slap a tariff or two on America’s closest and biggest allies. On other days, he goes for the pardon.
Turns out, investors don’t really like it. Stock markets left and right wiggled to the point they couldn’t take it anymore — the tech-heavy Nasdaq Composite NASDAQ:IXIC dived into correction territory last week. That is, the index plunged more than 10% from its most recent peak, which was a record high.
Even though Friday was a good day for stocks, the S&P 500 SP:SPX closed out its worst week since September, wiping off 3.1%. Zoom out and you get an S&P 500 that’s barely holding above the flatline since the election. In other words, more than $3 trillion has been washed out from the Wall Street darling since it hit a record high in late February.
Where Do We Stand on Tariffs Now?
So where has the dizzying labyrinth of tariffs landed? And is that final? (No, it’s not.) Trump last week declared that there’s simply “no room left” for Canada and Mexico to bargain over a deal or even a delay. That’s a 25% levy taking effect right there. A day later it was no more — a month-long reprieve for carmakers was introduced.
Then a day later, Trump suspended the 25% levy on almost all goods from its closest neighbors. To this, Trump said that the “big” wave of tariffs is coming in early April to a bunch of countries, including the European Union. Right now, only China’s 20% tariff remains in place.
The roller-coaster ride around who gets slapped with what has sent the dollar TVC:DXY in a freefall — so much so that the markets have started to chat about a “Trumpcession,” (not something you’d like to have your name on). That is, some traders and investors expect Trump’s policies to tip the American economy into a recession.
Swirling fears of a downturn came right as the Federal Reserve apparently managed to stick the soft landing — Jay Powell and his clique of central bankers lowered inflation through interest rate cuts while the economy continued to grow without nosediving into a downturn.
A side worry of the tariffs (with very real front-and-center consequences) is a pullback from the Federal Reserve on its rate-cutting campaign. Analysts are quick to say that the US central bank won’t be looking to trim borrowing costs any time soon. Not with all that White House noise threatening to derail consumer confidence and dent corporate profits and revenue.
Apparently, the huge wave of uncertainty around Trump’s tariff agenda, centered on isolation and protectionism, is making global investors nervous.
In this context, how are you navigating the sea change? What’s your portfolio showing and how do you feel about growth prospects ahead? Share you thoughts in the comment section and let’s chat!

S&P, NASDAQ, DOW JONES Weekly Market Forecast: Mar 10-14 In this video, we will analyze the S&P 500, NASDAQ, AND DOW JONES Futures. We'll determine the bias for the upcoming week, and look for the best potential setups.
Markets have been bearish due to mixed numbers employment, Fed statements, and uncertainty in US trade policies. Are the markets poised for a bounce back week? Perhaps. Traders will need to exercise patience before jumping in these volatile markets, waiting for the proper confirmations before we determine a bias. Once the markets tip their hand in that way, we can take advantage.
Enjoy!
May profits be upon you.
Leave any questions or comments in the comment section.
I appreciate any feedback from my viewers!
Like and/or subscribe if you want more accurate analysis.
Thank you so much!
Disclaimer:
I do not provide personal investment advice and I am not a qualified licensed investment advisor.
All information found here, including any ideas, opinions, views, predictions, forecasts, commentaries, suggestions, expressed or implied herein, are for informational, entertainment or educational purposes only and should not be construed as personal investment advice. While the information provided is believed to be accurate, it may include errors or inaccuracies.
I will not and cannot be held liable for any actions you take as a result of anything you read here.
Conduct your own due diligence, or consult a licensed financial advisor or broker before making any and all investment decisions. Any investments, trades, speculations, or decisions made on the basis of any information found on this channel, expressed or implied herein, are committed at your own risk, financial or otherwise.

SPY/S&P500: in the mid-term resistance zonePrice has approached the upper border of the mid-term resistance zone: 598-612.
Until price closes bellow 612, I am preparing for the start of a correction to mid-term support: 564-540.
If price moves confidently above 612, than next resistance target is at 635 level.
The macro-structure of the uptrend from 2022 lows is well intact until price holds above 540 level and assumes higher targets for 2025 at 635-640-670 levels.
I wish everyone Merry Christmas and successful and profitable 2025!
Thank you for your attention.

SP500: What next?The S&P 500 has bounced off a key support level at 5721. Is this in anticipation of lower inflation? That remains to be confirmed.
For a potential buy, a close above 5809 would be needed, along with an increase in buying volume. For now, selling volume remains dominant.

Validation of a long term top in the SPX continues to playballLast week I posted an update on my SPX cash index analysis...found below.
At the end of last week, we see where the price action has been filling in nicely as of Friday. Some key take-a-ways. First, is the price action has breached the area that I am counting as the wave 4 of one lesser degree. This would be an initial clue that the bull market pattern that started back in August of last year is cracking. This would be the area that I am counting as the intermediate wave (4). I am forecasting this recent price action down is the Minor A wave of the beginning of a stair stepped decline that has a high probability of coming back into that area of the August 2024 lows after we retrace higher in a minor B wave, labeled in Red.
What's important about price coming back into this area of approximately 5121-4950 is this the area that price could hold and manage a higher high, essentially meaning that my count is off by one degree...and what I am counting as a wave (III) super-cycle top will get pushed out to end of 2025-2026. However, to breach this area even incrementally, would provide much the same clues we're getting now, about price breaching the minor wave 4 of one lesser degree.
Below this must hold area, is where my forecast of a super-cycle wave (III) gets confirmation...until then we look for clues of validation...but confirmation does not come until price cane breach this area. To breach this area would reflect in price action that resembles the below.

Nifty Outlook: Bulls vs Bears - Key Levels to Watch Next Week
Nifty closed at 22,552, up by around 330 points from last week's close, hitting a high of 22,633 and a low of 21,964. As anticipated last week, the index found support at the 100-day WEMA around the 22,000 level, triggering a bounce. Looking ahead, next week is crucial, as the market is at a crossroads. While the monthly and weekly timeframes continue to show bearish signals, the bulls are actively trying to take control and push the market higher.
Here’s what to watch for:
Key Resistance: If Nifty manages to stay above 22,800 next week, we could see a short-covering rally, driving the index towards the 23,000 to 23,050 range. However, beyond these levels, the bulls may face significant challenges in taking the market further up.
Critical Support: On the downside, 22,000 remains a major support level. A break below this level could signal a fresh downtrend, possibly leading the market towards 19,500.
Next week is expected to be volatile, given the short trading week due to the holiday on Friday. This could lead to profit-taking from long traders, which might put downward pressure on the market. Keep a close eye on this week's low of 21,964. If it breaks, the market may open up to sharp declines.
Meanwhile, the S&P 500 has found support at the 50-day WEMA and closed at 5,770. On the weekly timeframe, it looks like the S&P 500 is forming a W pattern, with potential upside towards 5,850-5,890 next week before any pullback. If the S&P rallies as expected, it could provide a boost to Indian markets as well.
Next week is set to be decisive. Will the bulls overcome the bearish pressure, or will the market succumb to further selling? Stay alert, as the battle between bulls and bears continues.

SPX Is About to Explode – Here’s What I’m WatchingSPX is at a critical level, and whichever way it breaks, the move could be huge. Here’s my take:
If we drop below 5663, I see a move down to 5534 – 5445. If that zone fails, we could head toward 5332, and if selling pressure keeps up, 5234 might be next.
But if we break above 5800, the bulls could take over, pushing to 5972, and maybe even 6149.
It’s all about reaction levels now. I’m watching these zones closely—what’s your take? Are we heading up or breaking down?
Kris/ Mindbloome Exchange
Trader Smarter Live Better

S&P 500 Daily Chart Analysis For Week of March 7, 2025Technical Analysis and Outlook:
In the recent weekly trading session, the S&P 500 successfully retested the Mean Resistance level of 5967; however, it subsequently experienced a significant decline. This decline brought the index back to the Mean Support level of 5860 and further down to the next major Key Support level of 5710. After this downturn, the index established a new critical support level at 5683. It is now positioned to target the Mean Resistance level of 5840. Should the index initiate an upward movement from its current position and successfully surpass this key resistance, it may continue to ascend toward the subsequent Mean Resistance level of 5955.
Conversely, suppose the index experiences a decline from the retested level of 5840. In that case, it will likely target the Mean Support level of 5683, with a further descent to an Outer Index Dip of 5576.

S&P500 The Week Ahead 10th March '25 Sentiment: Bearish INTRADAY Price action is consolidating in a tight trading range
Resistance: Key Resistance is at 5920, followed by 6003 and 6010.
Support: Key support is at 5664 followed by 5600 and 5554.
This communication is for informational purposes only and should not be viewed as any form of recommendation as to a particular course of action or as investment advice. It is not intended as an offer or solicitation for the purchase or sale of any financial instrument or as an official confirmation of any transaction. Opinions, estimates and assumptions expressed herein are made as of the date of this communication and are subject to change without notice. This communication has been prepared based upon information, including market prices, data and other information, believed to be reliable; however, Trade Nation does not warrant its completeness or accuracy. All market prices and market data contained in or attached to this communication are indicative and subject to change without notice.

S&P500 is OVERSOLD!CME_MINI:ES1! NASDAQ:NVDA NASDAQ:AAPL NASDAQ:AMZN NASDAQ:META NASDAQ:MSFT NASDAQ:GOOGL NASDAQ:COIN
BUY OPPORTUNITY on CME_MINI:ES1!
The chart shows a strong bullish setup. A well-defined wave structure is visible along with a key Fibonacci retracement level marking the pullback. A divergence in momentum has been noted, and the price action has bounced off the 52-week EMA, suggesting that buyers are stepping in.
Fundamentally, the outlook remains positive. Recent macroeconomic data points to solid consumer spending and steady industrial production, while bank earnings and statements from major financial institutions have added to market confidence. These positive signals help support the S&P 500’s broader resilience, reinforcing the potential for further gains.
That said, caution is advised. Uncertainties such as shifting monetary policy, potential geopolitical tensions, and any unforeseen changes in economic data could introduce volatility. Traders should consider tight risk management and stop-loss strategies to mitigate downside risks.
Not Financial Advice

Why the US strategic reserve is a bad thing for crypto.Another Controversial Opinion
Honestly, I’m frustrated with how this is unfolding. Crypto was never meant to be controlled by the USA—it was created as a humanitarian concept to empower individuals, offering a decentralized, anonymous, and universally accessible financial system.
But, as always, when there's money, resources, or anything valuable, the USA steps in to take control.
Take the music industry as an example—one of many sectors transformed (or destroyed) by the US.
Why Is the US Crypto Stockpile a Bad Thing?
Because it goes against Satoshi Nakamoto’s vision.
By aggressively accumulating and stockpiling Bitcoin, the US is making crypto less attractive to the rest of the world. People who assume every country will blindly follow the US are mistaken. What's beneficial for the US is not necessarily good for China, India, Pakistan, Indonesia, or any country competing against US financial dominance.
Unlike gold, which can be mined anywhere, the US stockpiling over 200,000 Bitcoin gives it a massive advantage. Other nations may reject crypto simply because they see it becoming a US-controlled asset.
The Political Weaponization of Crypto
Now, Trump is positioning himself as "The Crypto President"—which, while beneficial under his leadership, means that Democrats will inevitably become the anti-crypto party.
Turning crypto into a political weapon is dangerous in the long run. Is gold tied to a political party? No. So why should crypto be?
Conclusion
Crypto needed regulation, and that’s it.
The US obsession with controlling everything valuable often ends up destroying it.
Let’s not forget: crypto is nothing without its global communities—and where are most of these people? In countries that are actively resisting US financial dominance, primarily in the BRICS nations.
When Trump and his family rug-pulled $1 billion through Trump/Melania meme coins, that money didn’t just come from the US—it came mostly from foreign investors gambling on memes.
This is not what Satoshi Nakamoto envisioned when he released Bitcoin as open-source software for humanity.
The end result? The SPX500 dictates the market, Bitcoin follows, and altcoins mirror Bitcoin. Wall Street is now the puppet master of crypto.
If crypto follows the path of the music industry, billionaires will get richer, but ordinary people won’t. Altcoins will be wiped out, and Bitcoin will dominate everything.

SPX500 at Key Support Level: Rebound Towards 5,860?FOREXCOM:SPX500 has reached a significant support zone, highlighted by previous price reactions and strong buying interest. This area has acted as a key demand zone, increasing the likelihood of a bullish bounce if buyers step in.
The current market structure suggests that if the price confirms support within this zone, we could see a bullish reversal. A successful rebound could push the price toward 5,860. However, if the price breaks below this zone, the bullish outlook may be invalidated, opening the possibility for further downside.
Just my take on support and resistance zones—not financial advice. Always confirm your setups and trade with solid risk management.
Best of luck!

SPY/QQQ Plan Your Trade For 3-7-24 : Rally PatternAs many of you know, I've been expecting the SPY/QQQ to find support (seeking a base/bottom) for the past 3+ days. The amount of selling has been somewhat extreme. We are currently in a downtrend.
So, my expectation of a base/bottom is related to the breakdown of the Excess Phase Peak pattern and the previous support levels (pre-election and recent lows) that suggest price will attempt to hold/base/bottom near recent support.
As of yesterday's close, price had broken downward, still within the support range.
So, again, I urge caution as I believe price will be very volatile while attempting "hammer out a base/bottom" (if it happens).
Overall, my bias is to the downside because of the current trend. Yet, The RALLY pattern today suggests we may see a recovery above 577 on the SPY which may lead to a rally targeting 580+.
Gold and Silver are holding up well and should setup a base/bottom today on the Counter-Trend Top/Resistance Pattern. I don't expect Gold and Silver to rally very strong today. I expect more of a melt-up in trend for metals.
Bitcoin is still consolidating and moving into a very tight Flag Apex range. As I pointed out in today's video, a shorter-term Flag apex will be reached on Sunday (3-9). I believe Bitcoin will become very volatile over the next 3+ days - attempting to break away from a GETTEX:13K consolidation range.
This apex volatility could drive the SPY/QQQ into extreme volatility as well.
Unless you are very skilled at targeting short-term price swings - stay very cautious of this volatility as it could end up turning and biting back.
It's Friday. I'm planning on watching and only trading when I believe there is a very clear opportunity for profits.
I got dinged around (took some lumps yesterday) trying to trade while driving and handling family issues. Lesson learned - don't force it.
The markets will settle into a trend next week. So, be prepared to sit and watch if you don't like what you see on the charts today.
Get some.
#trading #research #investing #tradingalgos #tradingsignals #cycles #fibonacci #elliotwave #modelingsystems #stocks #bitcoin #btcusd #cryptos #spy #es #nq #gold

NVIDIA Stock Goes Diving-Dressed ahead of Dotcom Crash RepeatingNvidia’s stock recently experienced a significant decline, tanked to 6-month low reflecting a mix of investor sentiment shifts, market dynamics, and company-specific concerns.
Here’s our @PandorraResearch Team ̶M̶u̶m̶b̶o̶ ̶j̶u̶m̶b̶o̶ fundamental and technical breakdown of what is going on with Nvidia stock NASDAQ:NVDA and why:
1. Cooling AI Enthusiasm
Nvidia has been at the forefront of the AI boom, with its chips powering advanced AI platforms. However, investor optimism about AI-related stocks has begun to wane. While Nvidia reported impressive revenue growth (122% in recent earnings), its future guidance failed to meet sky-high expectations. Investors are increasingly concerned that the returns from AI investments may take longer to materialize than initially anticipated. This cooling enthusiasm has led to a reassessment of Nvidia’s valuation, contributing to the stock's decline.
2. High Valuation Concerns
Nvidia’s price-to-earnings (P/E) ratio had soared to levels significantly higher than industry averages, reflecting lofty expectations for its future growth. At its peak, Nvidia was trading at 45 times expected earnings, compared to the S&P 500’s average of 22 times. Such high valuations often make stocks vulnerable to corrections when market sentiment changes or growth slows. The recent sell-off suggests that some investors are beginning to view Nvidia’s stock as overvalued.
3. DOJ Antitrust Investigation
Another factor weighing on Nvidia’s stock is news of a U.S. Department of Justice (DOJ) subpoena investigating potential antitrust violations. The probe reportedly focuses on whether Nvidia’s business practices limit customer options or stifle competition. While no formal charges have been filed, such investigations create uncertainty and make investors jittery about regulatory risks.
4. Broader Market Pressures
The decline in Nvidia’s stock also coincides with broader market challenges. Rising interest rates and concerns about the U.S. economy have led many investors to shift away from high-growth tech stocks like Nvidia toward more stable, rate-sensitive investments. Additionally, a general downturn in the Nasdaq Composite index has amplified the pressure on Nvidia shares.
5. Profit-Taking After a Massive Rally
Before its recent drop, Nvidia had seen meteoric gains—its stock surged over 120% in one year and briefly became the world’s most valuable company. Such rapid growth often attracts profit-taking as traders sell off shares to lock in gains. Analysts described this as a "routine selloff" after an extraordinary rally.
Technical challenge
The main technical 3-month log scaled graph for Nvidia's stock indicates on unattainable highs never seen before since Dotcom crash, reached through a massive long term path inside upside channel.
Conclusion
Nvidia’s stock decline is driven by a combination of factors: tempered AI optimism, valuation concerns, regulatory uncertainty, broader economic pressures, and profit-taking after an exceptional run-up. While some analysts remain bullish on Nvidia due to its dominance in AI hardware, others see the pullback as a natural correction in response to overextended valuations and shifting market conditions.
--
Best schadenfreude wishes,
@PandorraResearch Team 😎

US500:UPDATEHello friends
We witnessed a price drop due to the price reaching an important resistance.
Now, buyers have entered an important support area and by maintaining the support area, we can see the specified price targets.
*Trade safely with us*
