SPY/QQQ Plan Your Trade For 5-5-25 : GAP Reversal PatternToday's pattern suggests the SPY will open with a GAP range from yesterday's candle Body and attempt to reverse the trend we saw last week.
I believe this move will resolve to the downside, as I've been warning of the May 2-5 Major Bottom for many weeks.
I believe the extended uptrend over the last few weeks was pure speculation related to Q1 US earnings. It is hard to argue that traders playing into the Q1 earnings boost didn't play the right side of the trend after watching the markets rally over the past 2+ weeks. But, I still believe the markets will consolidate and attempt to move downward over the next 10- 20+ days.
The one thing that we have to understand is Q1 was almost on auto-pilot from Biden's economy/spending until Trump threw a curveball at the global markets with tariffs.
I don't believe the US & global markets have truly priced in a global -25% to -45% economic contraction because of the ongoing tariff negotiations. It has been reported that shipping rates are down 60% in China. I believe we still need another 30-60+ days to work out the tariff issues and to allow the markets to settle into proper expectations for future economic output/growth.
Because of this, I continue to urge traders to stay cautious.
Sitting on CASH right now (only trading 20% of your total capital) is probably the smartest thing you can do at the moment.
I still expect the July and October 2025 lows to be the base/bottom of the markets, leading to a stronger upward price trend.
Right now, I've very cautious we've just seen a "dead-cat bounce" off recent lows because of Q1 earnings expectations.
Now that we've passed most of the Q1 data - we are staring at Q2 & Q3. What comes next.
I believe Gold/Silver will continue to price in extreme risk factors - resulting in a strong rally through May and into June.
I believe Bitcoin will stall and move back down to the lower consolidation range.
Let's see how things play out this week.
Get some.
#trading #research #investing #tradingalgos #tradingsignals #cycles #fibonacci #elliotwave #modelingsystems #stocks #bitcoin #btcusd #cryptos #spy #gold #nq #investing #trading #spytrading #spymarket #tradingmarket #stockmarket #silver
S&P 500 (SPX500)

S&P 500 Tests Key Zone Ahead of FOMCThe S&P 500 has reached the 5,700–5,800 zone after a nearly 18% rally in just half a month. This zone could determine whether the rally marks the end of the bearish trend or if more pain lies ahead for the stock market.
The 200-day simple moving average, several previous horizontal support levels, and the most recent top all converge in this area. The upward move has been driven by correction dynamics, optimism around potential trade deals, signs of de-escalation with China, and rising expectations for Fed rate cuts in 2025.
This week, the FOMC may either temper those optimistic rate cut expectations or hint at a more dovish tone. In either case, some profit-taking may occur ahead of the meeting, and the 5,700–5,800 zone is a strong candidate for that to happen.

SPX: Short term bearish to touch gap? And fill? Looking like there is apparently “no tariff talks” per China.
We’re still in such an uptrend, but looking for a short-term pull back on negative news. Also we have FOMC this week. Does Powell give what Trump and the people want, a rate cut?
I’m looking for 5678.33 to
- TP1: 5672.46
- TP2: 5635.06
Possible touch or fill gap of below 5603.21?
Let me know what you think. Do your DD, not FA. Let’s see what the week brings.

Week ahead analysis May 4th to 11th**Week Ahead Analysis (May 5 – May 11, 2025)**
### **Baseline: Market Expectations**
- **Tariffs & Fed Policy:** Trump's tariff announcement has heightened concerns about economic slowing, prompting bond markets to price in up to four Federal Reserve rate cuts this year.
- **Trade Talks & Sentiment Shift:** Reports suggest China may restart trade negotiations, boosting risk sentiment. However, China insists the U.S. must first remove all unilateral tariffs, adding uncertainty to the discussions.
- **Market Reaction:** Risk assets—equities and high-beta currencies like AUD, NZD, and CAD—are climbing as volatility cools. Meanwhile, safe havens such as JPY, CHF, and gold are facing selling pressure, though overall risk sentiment remains cautious.
### **Potential Surprise Scenarios**
- **Trade Deal Secured:** A deal would likely send equities higher, strengthen risk-sensitive currencies, and drive safe havens lower.
- **No Deal Reached:** In contrast, safe havens could gain while risk assets retreat.
### **Big Picture Outlook**
Regardless of the immediate outcome, the market's medium-term trajectory hinges on the broader effects of trade policy. If tariffs persist, economic uncertainty may sustain the Fed’s dovish stance. A successful trade deal, however, could restore confidence, shifting expectations back toward growth stabili

S&P ES Long setup target 5963.50 / Calls SPY target 596Fibonacci technical analysis : S&P 500 E-mini Futures CME_MINI:ES1! has already found support at the Fib level 78.6% (5623.50) of my Down Fib. Last Daily candle (May 2) has closed above retracement Fib level 78.6%. My Down Fib guides me to look for CME_MINI:ES1! to eventually go up to hit first target at Fib level 127.2% (5963.50).
CME_MINI:ES1! – Target 1 at 127.2% (5963.50), Target 2 at 161.8% (6205.50) and Target 3 at 178.6 (6322.75)
Stop loss slightly below the 61.8% retracement Fib level (5506.25).
Option Traders : My AMEX:SPY chart Down Fib shows price to go up to Target 1 at 127.2% (595.82), Target 2 at 161.8% (620.50) and Target 3 at 178.6 (632.50)
Stop loss slightly below the 61.8% retracement Fib level (549).
Enjoy the trading process and take time to smell the roses🌹

Chart Called It S&P 500 Bottom on April 7 Confirmed the March 27On March 27, 2025, I published an analysis identifying the potential for a major bottom forming in the S&P 500 near 4,790.57:
Original chart and analysis
At that time, the index was consolidating just above key support, with growing downside pressure ahead of major economic reports. Despite broad caution in the market, the technical setup signaled a potential reversal.
The first rising channel developed in March, helping to support the rebound but it later broke to the downside, leading to another test of support. That move did not invalidate the broader structure.
On April 7, the S&P 500 made its cycle low at 4,835.04, just shy of the target. Since then, a second rising channel has formed, with higher lows and momentum supported by volume.
The price is now approaching major resistance at 5,822.
If it gets rejected, a pullback toward the rising trendline or the 5,438 area is likely. As long as price holds above the April 7 low and respects trendline support, the bullish structure remains intact. A confirmed breakdown below that support would increase the risk of a deeper retracement.
This progression underscores the importance of trusting price structure over sentiment.
The market followed the chart.
The bottom was April 7.
The call was made March 27.
The chart led the move.

The Bitcoin Illusion: Why $300K or $1M Is a Pipe DreamBitcoin enthusiasts love throwing around wild price predictions—$300K, $1M, even $5M per BTC—as if these numbers are inevitable. But let’s break down the math and expose the delusion behind these claims:
Bitcoin at $300K or $1M? Let’s Do the Math
- $300,000 is a number pulled out of thin air by Michael Saylor and Robert Kiyosaki, either deliberately misleading or financially illiterate. They fail to grasp that this would require a market cap of $6 trillion.
- $1 million, as Cathy Wood foolishly claims, would require Bitcoin’s market cap to exceed $20 trillion—more than the entire GDP of the United States.
- The idea that Bitcoin will magically absorb trillions in global wealth is pure delusion.
Now, let’s put this into perspective:
- Bitcoin reaching $100K was relatively easy because it required a market cap of just $2 trillion—a fraction of global liquidity.
- But pushing Bitcoin to $300K or beyond requires trillions more, which is mathematically impossible without a massive influx of new capital—capital that simply does not exist.
Your $100K to $1M Fantasy—Let’s Run the Numbers
- Some Bitcoin holders believe their sub-$100K investment will make them multimillionaires.
That's a lie and delusional:
- If you bought 100k worth of Bitcoin at 83K per BTC, it would need to hit $830K per coin for you to even reach $1M.
- That’s not financial genius—it’s blind faith in an impossible scenario.
You’re Living in "The Matrix" of Crypto Lies
- You’re not stacking wealth—you’re stacking HOPIUM.
State Adoption Won’t Skyrocket the Price
- Even if six U.S. states were considering Bitcoin treasuries, those purchases would be OTC (over-the-counter)—meaning they wouldn’t significantly impact market price.
- Governments negotiate deals strategically; they don’t flood markets like retail investors hoping for price surges.
The End of Bitcoin’s Accumulation Phase
Bitcoin’s early adopters—the billionaires who pumped it up—have already made their money. The accumulation phase is over.
- To push Bitcoin higher, these whales would need to inject substantial amounts of new capital—but they are overleveraged and drowning in debt.
- Borrowed money must be repaid, and we're already past Bitcoin’s peak mainstream adoption which means there are no new waves of buyers to sustain the illusion.
- Bitcoin is now entering a distribution phase, where early holders cash out, leaving retail investors holding the bag.
The Rise of ETFs and Real Investments
The world is moving on. Investors are waking up to the fact that:
- ETFs offer real projects with actual purpose, unlike Bitcoin.
- ETFs pay dividends, generate revenue, and contribute to real economic growth.
- Newer crypto projects—like Stamps, art collections, gaming tokens, and smart contracts—are gaining traction and pulling capital away from Bitcoin.
Bitcoiners will get left behind, holding worthless, declining bags of old-school crypto, while the future thrives in better technologies.
The Harsh Reality: Bitcoin’s Future Is Bleeding Out
Bitcoin isn’t the future—it’s a fading illusion.
- The crypto cartel thrives on believers, feeding them fantasy while they cash out.
- The idea that Bitcoin will replace fiat, become the global payment rail, and make every holder rich is a marketing illusion designed to keep people holding bags.
- The longer people ignore reality, the harder the crash will be for them.
Many think they’re ahead of the curve, but they’re just loyal believers in an unsustainable illusion. When this unravels, it won’t be Bitcoin’s future collapsing—it will be theirs.

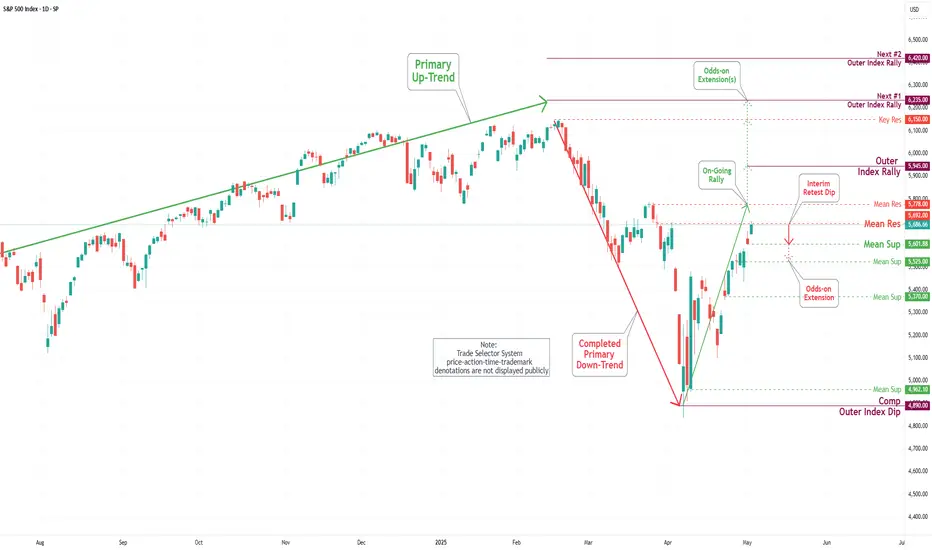
S&P 500 Daily Chart Analysis For Week of May 2, 2025Technical Analysis and Outlook:
During this week's trading session, the Index demonstrated a steady to higher price movement, achieving a key target at the Outer Index Rally level of 5550 and successfully surpassing the Mean Resistance level of 5672. This trajectory establishes the foundation for sustained upward momentum as it approaches the Mean Resistance level of 5778 and sets sights on reaching the next Outer Index Rally target marked at 5945. However, it is essential to acknowledge the substantial risk of a sharp retracement from the current price level to the Mean Support level of 5601, with the potential for further decline to the Mean Support level of 5525.
S&P 500 records 9 days of gains, longest streak in 20 years🚨S&P 500 records 9th consecutive day of gains, the longest winning streak in over 20 years..
🚨
MartyBoots here , I have been trading for 17 years and sharing my thoughts on ETH here.
SP:SPX
Watch video for more details

SPY WEEKLY 2ND MAY 2025Welcome to Spy weekly. I have clearly discussed the price action. If you have any doubts, feel free to leave a comment or DM me.
NOTE:DO NOT SHORT

SPY/QQQ Plan Your Trade For 5-2-25 : Major CRUSH PatternToday's pattern is a Major CRUSH pattern in Counter-Trend mode. These types of patterns (CRUSH patterns) are usually very large range bars that move against the current price trend. A Counter-trend Major CRUSH pattern would likely be a huge bar that moves counter to a counter-trend - thus potentially BULLISH.
Today, I have my reservations related to how this Major Crush pattern will setup. As I stated in my video, yesterday's price bar setup an Island type of bar (in an Evening formation) which is very typical of a topping pattern.
Today, I'm expecting the markets to sell downward into the Major CRUSH pattern. I believe the move of my MRM system into Bullish Trending yesterday sets up a perfect opportunity for the markets to shake out the longs on a big CRUSH pattern today.
But, I've also highlighted bullish breakaway levels on the SPY/QQQ chart for traders to be prepared for any outcome today.
In short, I believe the May 2-5 Major Bottom aligns with this Major CRUSH pattern as a downward price trend today. But, I'll be prepared to take my lumps if I'm wrong and the markets rally straight upward.
Over the past few days, we've seen some interesting developments in China and other places. I do not believe the US market is immune from the global slowdown which is taking place right now. Therefore, I urge traders to continue to stay protected from risks and to keep allocation levels rather small.
It may seem like a fantastic time to throw out some big trades - but it is still very dangerous in this extreme volatility.
I see Gold and Silver trying to base/bottom near recent lows over the next 5+ days. I still believe Gold will be trading at or near $4100 before the end of May.
Bitcoin seems to have followed the SPY/QQQ upward since April 21. I believe this is pure speculation. I'm still very cautious of a breakdown in the markets right now.
Let's see how this Major CRUSH pattern plays out.
It should be interesting - one way or the other (again, I'm still leaning toward a BEARISH breakdown in price today).
Get some...
#trading #research #investing #tradingalgos #tradingsignals #cycles #fibonacci #elliotwave #modelingsystems #stocks #bitcoin #btcusd #cryptos #spy #gold #nq #investing #trading #spytrading #spymarket #tradingmarket #stockmarket #silver

S&P500 INTRADAY ahead of NFP, resistance at 5670The bulls are firmly in control as the S&P 500 heads for its ninth straight daily gain—the longest winning streak since 2004. Optimism is fuelled by:
Expectations of Fed rate cuts due to soft economic data
Hopes for renewed US-China trade talks, easing geopolitical risk
Strong risk appetite, with Bitcoin nearing $100,000 and equity momentum building
Key Risk Today – US Jobs Report:
April Nonfarm Payrolls expected at +138K, down from March’s strong beat
This is the first major labor data since new US tariffs, and could shift market expectations for Fed policy
Conclusion for S&P 500 Traders:
Momentum is bullish, but today’s NFP report is a key risk event. A weaker-than-expected jobs number could reinforce rate cut bets and extend the rally. A surprise beat may trigger profit-taking.
Key Support and Resistance Levels
Resistance Level 1: 5670
Resistance Level 2: 5740
Resistance Level 3: 5820
Support Level 1: 5440
Support Level 2: 5385
Support Level 3: 5316
This communication is for informational purposes only and should not be viewed as any form of recommendation as to a particular course of action or as investment advice. It is not intended as an offer or solicitation for the purchase or sale of any financial instrument or as an official confirmation of any transaction. Opinions, estimates and assumptions expressed herein are made as of the date of this communication and are subject to change without notice. This communication has been prepared based upon information, including market prices, data and other information, believed to be reliable; however, Trade Nation does not warrant its completeness or accuracy. All market prices and market data contained in or attached to this communication are indicative and subject to change without notice.

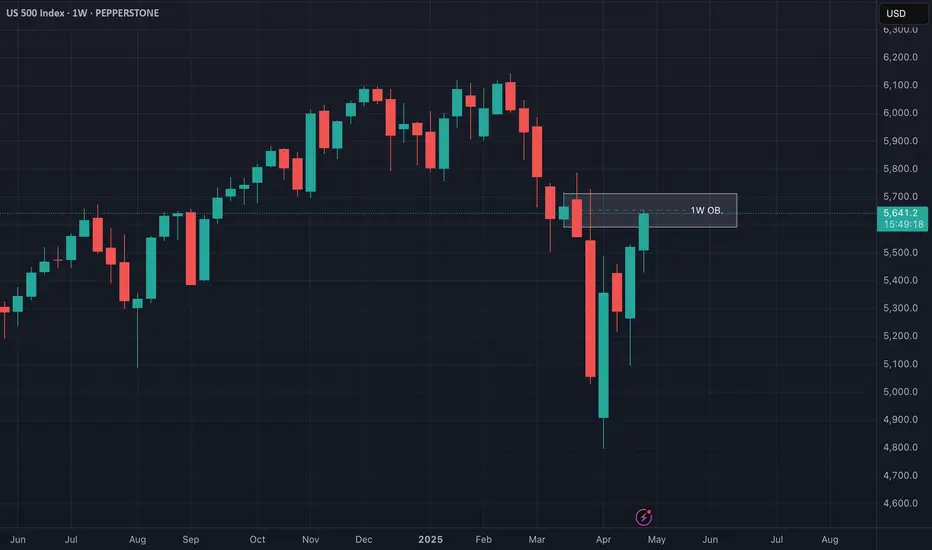
US500 Reversal Zone? My Thought Process Explained 🎯 📉 Earlier today I posted an analysis on the US500, highlighting how price has traded into a weekly bearish order block 🧱 — a key distribution zone where I believe smart money could look to unwind positions. The market is currently overextended and sitting at a premium, which raises the risk of a potential aggressive retrace 🔄, especially heading into the weekend. ⚠️
💭 Here's a video where I break down that exact setup and walk you through my full thought process, including why I’m exercising extreme caution at these levels and what I’m looking for in terms of confirmation.
📚 As always, this is for educational purposes only — not financial advice. 🚫💼

US500 at Critical Resistance - Weekly Chart Breakdown📊 US500 Weekly Chart Analysis
Taking a close look at the US500 on the weekly timeframe, we can see price has now traded directly into a bearish weekly order block 🧱 — a key distribution zone where smart money activity often emerges. At this level, the market is trading at a premium 💰 and appears to be overextended 📈.
⚠️ From a risk management standpoint, I’d advise extreme caution — the current conditions could set the stage for a sharp retracement, especially as we approach week’s end. This level aligns with areas where institutional players may look to offload risk or reverse exposure.
🔁 A potential pullback from here would not be surprising, given the elevated context and technical structure.
📚 This breakdown is for educational purposes only and should not be considered financial advice.
SPY/QQQ Plan Your Trade Update : Behind The Scenes ResearchI want to say thank you to all of you and to share with you all the work/resources/servers/and other data I maintain to help me identify where and how the markets will present opportunities to all of us.
This video shows you a bit of the behind-the-scenes work I do and some of my proprietary modeling systems.
I'm not sharing this with you to try to win you over or to tell you I do more than anyone else in terms of research. I'm sure there are many others who go much further than I do in terms of trying to dissect the markets and the opportunities available.
But I do believe I deliver very unique research, which is a one-of-a-kind solution for traders.
Again, I'm not 100% accurate (I wish I were).
But I am trying to share some of the decision-making solutions I use to understand where the markets are likely to move over the next 2- 4+ months and how traders can profit from my research.
Remember, you are only seeing about 10% of my total research, tools, modeling systems, and capabilities in these Plan Your Trade videos.
I want to thank all of you who continue to value my work. It is not easy. It takes money, time, and resources to continue to monitor all of these systems/algos.
The end result, I believe, is one of the most unique future/current modeling system resources you can find anywhere.
Again, thank you for making my research a success. I promise to do more and improve my tools over the next 12+ months for everyone to find better profits.
Get some.
#trading #research #investing #tradingalgos #tradingsignals #cycles #fibonacci #elliotwave #modelingsystems #stocks #bitcoin #btcusd #cryptos #spy #gold #nq #investing #trading #spytrading #spymarket #tradingmarket #stockmarket #silver

SPY at 3 important event! POC, 200 ema and 30 days reversalHi All SPY is at an interesting intersection:
1) a month from where it crashed and reversed entirely
2) At point of control (POC) from the top in Feb
3) at 200 ema
In Aug 22 SPY reversed from POC, at other times it found support or broke out with a gap
My opinion is, it will continue going up till 13th May (date when CPI is published). Nobody knows for sure how much tariff will impact CPI. It cannot as bad as we had during covid.

Nasdaq-100 Goes Back to 'PRE-PAIN' 20 000 Level. Series IIApril has gone..
Wow.. Duh..!? ..really? ... or still not!?
Briefly a month ago or so, we have examined at our wonderful @PandorraResearch Team what is 'Revenge Trading', watch our recent 'Educational' idea right here (if you missed one), to learn what sort of lessons we should know about it.
Indeed, it was a really bad story, to purchase in late March 2025 most-hyped so-known Mag Seven stock that came flagships of the recent stock market collapse.
First of all, watch how it's been below (late March 2025) 👇👇
What's happened next just in a week or two since our publications has been made?
⚒ Russell 2000 Index TVC:RUT 95% stocks were: DOWN
⚒ S&P500 Index SP:SPX 96% stocks were: DOWN
⚒ Nasdaq-100 NASDAQ:NDX as well as Dow Jones Industrial Averages DJIA indices: 97% stocks were DOWN
⚒ Magnificent Seven: ALL STOCKS WERE DOWN
Since Nasdaq-100 went back to pre-pain 20'000 Level, lets repeat some lessons.
Revenge trading is DANGEROUS AND HARMFUL pracrice where traders, after suffering a loss, attempt to immediately recoup their losses by making impulsive, emotionally-driven trades. This behavior is widely recognized as one of the major reasons traders lose significant amounts of money and often blow up their accounts.
Why Revenge Trading Is Bad
1. Emotional Decision-Making Replaces Strategy
When traders engage in revenge trading, they abandon their carefully crafted trading strategies and risk management rules. Instead, trades are made based on anger, frustration, or the desire to "get back" at the market. This emotional state clouds judgment, leading to irrational decisions such as increasing position sizes recklessly, disregarding stop-loss orders, or chasing trades without proper analysis. As a result, the likelihood of making successful trades plummets.
2. Escalating Losses and Account Blowups
The urge to recover losses quickly often leads traders to double down or over-leverage their positions, exposing a large portion of their capital to additional risk. Statistically, 80% of revenge trading ends disastrously, with only a small fraction experiencing temporary success before ultimately facing larger losses. This cycle of chasing losses can rapidly erode trading capital, making recovery increasingly difficult.
3. Psychological Burnout and Stress
Revenge trading is mentally and emotionally exhausting. The constant cycle of loss and frantic attempts to recover can lead to stress, depression, and burnout. This further impairs decision-making, creating a vicious cycle of poor performance and deteriorating mental health.
4. Long-Term Damage to Trading Habits
Repeatedly succumbing to revenge trading ingrains bad habits, making it difficult for traders to maintain discipline and consistency in the long run. This lack of consistency undermines the potential for sustainable profitability and can end trading careers prematurely.
Recent Real-World Examples
Recent years have seen numerous cautionary tales illustrating the dangers of revenge trading (all links are from r/wallstreetbets subreddit for learing/ educational purposes only):
$40,000 Lost on NVDA Options (2024). A trader repeatedly doubled down on Nvidia (NVDA) put options during its price rally in mid-2024. Despite initial small wins, the trader, driven by the urge to recover losses, continued to increase his position size, ultimately losing over $40,000.
$26,000 Lost in 20 Minutes on SPX. A Reddit user reported losing $26,000 in about 20 minutes trading the S&P 500 index (SPX) after prices dropped sharply. The loss was the result of impulsive trades made in an attempt to quickly recover from earlier setbacks.
From $27,000 to $0 in Three Days. Another trader turned $500 into $27,000 in just a few days, only to lose it all within 48 hours after a market reversal. Instead of taking profits or stepping back, the trader kept chasing losses with increasingly risky trades, ending up with nothing.
$100,000 Loss on a Yen Carry Trade. A trader, influenced by news of geopolitical tensions, made a large leveraged bet on the yen. After an initial loss, he refused to cut his losses and doubled down, ultimately losing $100,000 instead of accepting a smaller $30,000 hit.
More juicy stories are to be collected...
These stories are not isolated incidents. They are echoed across trading forums and social media, serving as stark warnings of how quickly revenge trading can destroy even substantial gains.
Conclusion
Revenge trading is DANGEROUS AND HARMFUL because it replaces rational, strategic decision-making with emotional reactions, leading to escalating financial losses, psychological distress, and long-term damage to trading discipline. The real-world examples from the past year underscore that no trader-regardless of experience-is immune to its risks. The best defense is to recognize the urge, step away, and return only with a clear, objective mindset and a disciplined strategy.
--
Best wishes,
@PandorraResearch Team 😎

S&P500 INTRADAY resistance at 5670Tech Surge Lifts Markets:
Strong earnings from Microsoft (+7.8%) and Meta (+6.2%) are driving early market optimism. Both beat revenue expectations, easing concerns about trade war impacts.
→ S&P 500 futures up over 1%.
Trade Deal Hopes:
Sentiment is boosted by signs that President Trump may soon announce initial trade agreements, reducing geopolitical risk.
Bank of Japan Dovish Shift:
The BoJ cut its growth forecast and delayed its inflation target, signaling caution.
Yen fell as much as 1.2%.
US-Ukraine Investment Deal:
The US secured privileged access to Ukraine’s natural resources, potentially helping ease tensions as part of broader efforts to end the war.
Earnings Watch:
Before Open: Mastercard, Estee Lauder, Eli Lilly, Moderna, McDonald’s
After Close: Apple, Amazon, Amgen, Airbnb, Reddit
Key Support and Resistance Levels
Resistance Level 1: 5670
Resistance Level 2: 5740
Resistance Level 3: 5820
Support Level 1: 5440
Support Level 2: 5385
Support Level 3: 5316
This communication is for informational purposes only and should not be viewed as any form of recommendation as to a particular course of action or as investment advice. It is not intended as an offer or solicitation for the purchase or sale of any financial instrument or as an official confirmation of any transaction. Opinions, estimates and assumptions expressed herein are made as of the date of this communication and are subject to change without notice. This communication has been prepared based upon information, including market prices, data and other information, believed to be reliable; however, Trade Nation does not warrant its completeness or accuracy. All market prices and market data contained in or attached to this communication are indicative and subject to change without notice.

SPY/QQQ Plan Your Trade For 5-1 : Bottom-104Today's Bottom pattern suggests the markets will attempt to move downward - trying to find support.
Even though it may appear my May 2-5 Major Bottom pattern will not happen as I expect - this is a very good lesson for traders.
I'm not 100% accurate all the time. Sometimes, the markets do things that are not aligned with my research/patterns and sometimes the markets can be far more irrational than traders expect.
For example, I believe this current rally is more of a speculative rally in the SPY/QQQ/BTCUSD. There is nothing I'm seeing in the Crash Index (or TRAN) to support this upward price move other than traders attempting to "buy the dip".
Ultimately, I believe the current contraction in the global economy based on policies, tariffs and economic disruptions will continue to drive a consolidation, basing type of price trend, traders are buying into this dip and attempting to drive price upward on expectations of a growing global economy.
Time will tell how things play out - but my longer-term modeling systems are still Bearish.
I will be on the road with my father today - so I'm not going to be as available to answer questions.
Watch this video twice if you need to. It will be interesting to see how the next 5+ days in the markets play out.
As I stated, I'm not 100% accurate all the time. I do my best to try to help guide all of you through these market trends with my research and cycle patterns - but, that is not enough to guarantee 100% accuracy on any trade.
That's just how it is in the world. No one is 100% perfect at predicting market moves.
Get some.
#trading #research #investing #tradingalgos #tradingsignals #cycles #fibonacci #elliotwave #modelingsystems #stocks #bitcoin #btcusd #cryptos #spy #gold #nq #investing #trading #spytrading #spymarket #tradingmarket #stockmarket #silver

SPX Play-by-Play: From Trap to Trend and Back AgainJust price, structure, and volume — tracked in real time.
🧠 Chart Breakdown:
✅ Early Short Trap / Failed Breakdown — Sellers tried to press lower early, but price held key levels and reversed. That shift became the foundation for the entire move that followed.
✅ Breakout Long Trigger — After reclaiming structure, price drove into new highs with strong follow-through. Volume confirmed the breakout.
⛔ Top Rejection — Price pushed into resistance but couldn’t hold. Momentum faded, candles hesitated, and sellers stepped in.
✅ Fib-Based Bounce — After the pullback, price responded cleanly off fib-based support. The bounce was sharp, and volume backed it.
✅ Steady Uptrend Structure — Price moved in an orderly fashion. Small pullbacks held structure, and volume stayed supportive — a textbook controlled climb.
⛔ Range Resistance — Price returned to a previously rejected zone. Wicks and hesitation reappeared.
👀 Current Breakout Watch — Price is testing that resistance again. A reclaim with strength signals continuation. Another fade? Let it go.
Always happy to be helpful.

SPY - dump or bull market is back?hi traders,
Some months ago, we shared the idea where we explained that SPX will experience a correction:
The targets were reached, and next we saw a decent bounce, which is very well visible on the monthly candle.
Today, I see a lot of excitement about the monthly close, and many people call for a new all-time high soon.
I want to bring to your attention the monthly close in 2000.
It looks very similar to what we got yesterday.
A long, lower-shadow wick resulted in a bearish imbalance characterised by an excess of sellers, exerting downward pressure.
I still can see SPY/SPX retesting 570-580 levels, but it doesn't change the fact that lower levels may be tested in the next few weeks/months.
We got a bearish cross on the monthly time frame, which is not a joke.
If bears take control, I expect SPY to visit 460~ levels and later even lower: 410-408.
Long story short:
1. Short-term bounce may continue.
2. Mid-term - bears will take control, and we will see a bigger correction.
Do you agree? Share your opinion in the comments section


Arshitecture / 30 Min Short Position SP500After the price reaches TP1, hold the current short position and consider adding to it on valid signals to ride the move toward TP2. Apply the same strategy for TP3, scaling in cautiously at key resistance zones.
I’ll share the key confirmations on the chart as they appear.
Goodluck BLUEBERRY:SP500
