S&P corrective pullback after bullish breakout to new ATHS&P (US500) index pair price action sentiment appears bullish, supported by the longer-term prevailing uptrend. The recent intraday price action appears to be a sideways consolidation after reaching the intraday all time high.
The key trading level is at 6080 level, the consolidation price range and also the previous resistance now newly formed support zone. A corrective pullback from the current levels and a bullish bounce back from the 6080 level could target the upside resistance at 6140 followed by the 6160 and 6200 levels over the longer timeframe.
Alternatively, a confirmed loss of the 6080 support and a daily close below that level would negate the bullish outlook opening the way for a further retracement and a retest of 6030 support level followed by 6000.
This communication is for informational purposes only and should not be viewed as any form of recommendation as to a particular course of action or as investment advice. It is not intended as an offer or solicitation for the purchase or sale of any financial instrument or as an official confirmation of any transaction. Opinions, estimates and assumptions expressed herein are made as of the date of this communication and are subject to change without notice. This communication has been prepared based upon information, including market prices, data and other information, believed to be reliable; however, Trade Nation does not warrant its completeness or accuracy. All market prices and market data contained in or attached to this communication are indicative and subject to change without notice.
S&P 500 (SPX500)

SPX In Limbo - Which way will it break?SPX in Limbo – Will It Break Up or Down? | SPX Market Analysis 19 Feb 2025
Still waiting. Yep, that’s where we are.
The market is about as exciting as watching paint dry, but this is not the time to get impatient. As much as I’d love to jump into a trade just to feel productive, I know better—waiting for the right entry beats chasing the wrong one.
Let’s break it down while we sip on tea and pretend to be Zen masters of market patience.
---
SPX Deeper Dive Analysis:
Why Patience is Everything in Trading
There’s an old trading rule that never fails—the market will always move… eventually. But right now, it’s in one of those frustrating, indecisive moods where:
Nothing is confirming (so forcing a trade is a bad idea)
It’s stuck between two key levels (meaning we wait for the breakout or breakdown)
Volume is sluggish (which means false moves are more likely)
Still Watching Two Scenarios
☑ Scenario #1 – The Bullish Breakout Entry
Needs price to confirm above key resistance
No fakeouts—just clean, strong momentum
Only then do I consider a bullish trade
☑ Scenario #2 – The Bearish Reversal Entry
Needs clear rejection at resistance
No weak, choppy movements—just a solid confirmation
Only then do I take a bearish setup
Why Forcing Trades is a Losing Game
Let’s be honest—waiting is boring. But do you know what’s worse? Jumping into a trade just because you're impatient… and then watching it immediately go against you.
Every trader, at some point, has thought:
"It looks like it’s going to move, maybe I should enter early…" (Nope.)
"I don’t want to miss the move…" (You won’t—if you follow the plan.)
"Other traders are jumping in—should I?" (Nope. They’re probably wrong.)
The right trade at the wrong time is still the wrong trade.
What’s Next?
✅ Stay patient—the market will tip its hand soon enough
✅ Wait for clear confirmation—not “I think this might be it” confirmation
✅ Don’t trade out of boredom—trade because the setup is 100% valid
📌 Final Takeaway? Patience = profit. I’m still waiting, tea in hand, and when the market finally makes its move, I’ll be ready.
---
Fun Fact
📢 Did you know?
The stock market used to take 5 months to process a trade before the 1970s. Now? It happens in milliseconds—but traders still struggle to wait a few hours for the right setup.
💡 The Lesson?
Patience has always been a trader’s best tool. Some things never change.

XAUUSD ANALYSIS FOR THE WEEKXAU/USD (Gold vs. US Dollar) Analysis: February 17 – Febrauary 25, 2025
This analysis provides an in-depth evaluation of gold’s potential trajectory over the specified period, integrating fundamental drivers, technical indicators, and expert forecasts. Key factors influencing gold include geopolitical risks, monetary policy shifts, inflation trends, and technical patterns.
1. Fundamental Drivers
A. Geopolitical and Economic Uncertainty
Trade Tensions: The U.S. administration’s recent tariffs (e.g., 25% on Mexican and Canadian imports, 10% on Chinese goods) have amplified global trade risks, increasing demand for gold as a safe-haven asset.
Middle East and China Risks: Escalating geopolitical tensions in the Middle East and a slowdown in China’s economy (evidenced by a decline in the Caixin PMI) are further driving investors toward gold.
B. Monetary Policy and Inflation
Fed Rate Cuts: Expectations of two Federal Reserve rate cuts in 2025 and dovish stances from the ECB and BoE are weakening fiat currencies, boosting gold prices.
Inflation Hedge: Persistent inflation, driven by tariffs and supply-chain disruptions, enhances gold’s appeal. Analysts caution that U.S. inflation could exceed targets, forcing the Fed to reverse rate cuts, which may temporarily support the USD but ultimately favor gold.
C. Central Bank Demand
Central banks, notably China’s PBOC, are accumulating gold reserves to diversify away from the USD, creating structural demand.
2. Technical Analysis
A. Short-Term Signals (February–March)
Momentum Indicators: The RSI (26.05) and Stochastic Oscillator (14.5) signal oversold conditions, suggesting a potential rebound.
Key Levels:
Support: $2,830 (February 10 analysis) and $2,720 (ascending channel lower boundary).
Resistance: $2,887 (immediate target) and $2,900 (psychological barrier).
2. Key Technical Levels
Support Levels:
Immediate Support: $2,880 – This level aligns with the 23.6% Fibonacci retracement from the recent rally.
Critical Support: $2,850 – Represents the lower boundary of the ascending channel formed since late 2024.
Resistance Levels:
Immediate Resistance: $2,920 – A breach could trigger bullish momentum toward higher targets.
Key Resistance: $2,959 – The upper boundary of the channel and a major psychological level.
3. Momentum Indicators
Relative Strength Index (RSI): Currently at 62, indicating bullish momentum but approaching overbought territory.
Moving Averages (MA):
50-Day MA: Positioned at $2,910, offering dynamic support.
200-Day MA: Located at $2,780, signaling long-term strength.
Stochastic Oscillator: Signals potential upside as it exits oversold conditions on the 4-hour chart.
4. Chart Patterns and Trends
Ascending Channel: Gold continues to trade within an ascending channel, maintaining a bullish structure.
Bullish Flag Formation: On the daily chart, a bullish flag suggests a potential breakout if prices sustain above $2,920.
Candlestick Signals: Last Friday’s bullish engulfing pattern highlights strong buying interest.
5. Scenarios for the Week
Bullish Scenario:
A breakout above $2,920 could target $2,965 and $3,000.
Momentum indicators support further upside if geopolitical tensions persist.
Bearish Scenario:
A failure to hold $2,880 may lead to a decline toward $2,850.
Profit-taking or USD strength could pressure gold, particularly if U.S. economic data surprises positively.
Bullish Targets/ Resistance
2890
2906
2928
2934
2959
2972
2987
3023
Bearish/Support
2872
2857
2841
2807
2781

SPY/QQQ Plan Your Trade Post Market Update : Big Squeeze CloseToday is quite a day in terms of trading volatility and volume. We've not seen a low-volume day like today in the SPY for more than a year.
It is very likely this rally near the close of trading was more of a short-squeeze and not really a momentum breakout.
We'll see how things play out tomorrow. But, I'm not budging related to my expectations of a breakdown in the markets over the next 5-10+ days.
I see this market as completely over-cooked to the upside - and it seems to be evident in the lack of buying volume playing out.
My Custom Crash index is flat and topping. My Custom Volatility Index is flat and topping. My Custom US Leading Index is actually LOWER so far this week.
One thing is certain, there is a lot of open "air" below the 598 level on the SPY.
Buckle Up.
When it breaks - it may be a BIG BREAKDOWN setting up.
Get Some.
#trading #research #investing #tradingalgos #tradingsignals #cycles #fibonacci #elliotwave #modelingsystems #stocks #bitcoin #btcusd #cryptos #spy #gold #nq #investing #trading #spytrading #spymarket #tradingmarket #stockmarket #silver

S&P 500 BREAKOUT?! 18.2.25Simple as can be.
1. November 2024 - Feb 2025 wedge pattern, converging support and resistance with higher highs and lows.
2. Descending trend-lines within the wedge, first line broken Jan 16th (highlighted) - 3% jump in 3 days of trading, second line broken today, Feb 18th.
3. Potential rise to the top of the wedge pattern, around the mid 6300's.
Stay logical, with a plan and consistent.
Fortune favors the brave!

SPY/QQQ Plan Your Trade For 2-18 : GAP PotentialAs the markets continue to struggle to break away from the current consolidated/sideways price trend, one thing is certain: The current FLAG/EPP pattern is setting up an explosive price move.
My expectations are for a price breakdown, as my predictive modeling and GANN Cycle Patterns suggest that Major Bottoms will set up near February 21 and March 21-23.
These major Bottoms suggest a strong potential for a price breakdown, reflecting uncertainty for the first half of 2025.
Additionally, I believe the strength of the US Dollar is driving a "Capital Shift," where foreign capital is actively moving away from currency and economic risks, pooling aggressively into the safest currency and assets. This translates into capital pooling into US, UK, and EURO assets to avoid broader currency devaluation events.
The dynamics of the global markets are very interesting right now. The influx of capital into the strongest economies with the strongest currencies may present a MELT-UP type of market trend. However, the uncertainty related to future US economic growth and performance may prompt some deep downturns/pullbacks in price.
I don't see how the US markets can move past the economic turmoil of broad government restructuring until after June/July 2025.
Therefore, I continue to urge traders to stay cautious of any melt-up trend. The markets want to move higher, but there are currently extreme volatility risks related to any potential price breakdowns.
I'm watching Gold/Silver and Bitcoin to see if we move back into any euphoric phase. And right now, I'm seeing metals starting to move into a type of panic selloff while Bitcoin is struggling to regain any real strength.
The continued sideways trend of Bitcoin leads me to believe the euphoria is diminishing, and reality may be setting in. That means we may be in for a bumpy ride over the next 90+ days.
Stay fluid and stay cautious of any big breakdowns.
Get some.
#trading #research #investing #tradingalgos #tradingsignals #cycles #fibonacci #elliotwave #modelingsystems #stocks #bitcoin #btcusd #cryptos #spy #gold #nq #investing #trading #spytrading #spymarket #tradingmarket #stockmarket #silver

Daily Market Outlook: BTC, Forex & SPX Setups (#4)Hope you’re all having a great start to the week! I’m Skeptic , and today we’ll break down BTC, Forex, and a key setup on SPX.
📉 BTC Analysis – Stuck in a Range, But Not for Long!
BTC is currently range-bound after getting rejected from $107K. The range is wide and indecisive, signaling that the market is waiting for a strong catalyst before making its next move.
📊 Key Observations:
Low volume & high volatility = poor R/R for trades inside the range.
Breakout traders should wait for confirmation:
✅ Bullish Breakout : Above $98,455, or even earlier if momentum kicks in.
🔻 Bearish Breakdown : Below $95K, which could trigger a stronger move down.
⚠ Until a breakout happens, trading inside this range isn’t ideal due to stop hunts and fake moves.
📊 BTC.D Dropping – Is Altcoin Season Heating Up?
BTC dominance (BTC.D) has been declining recently, which suggests capital rotation into altcoins.
📊 Why This Matters?
Coins like XRP, BNB, and CAKE have started to gain traction.
Watching BTC.D is crucial—it helps determine if money is staying in BTC or shifting to alts.
A continued BTC.D drop could mean more upside for alts.
📉 DXY (Dollar Index) – Entering a Deeper Correction?
We’ve been talking about DXY weakness for a while, and now, after breaking below 107.311, we’re seeing a deeper correction.
📊 Potential Targets Based on Fibonacci:
✅ 105.677 (first level)
✅ 103.306 (deeper retracement)
💡 Since DXY is weak, we might see strength in EUR pairs and stock indices this week.
📈 SPX500 – Major Breakout Watch!
SPX500 has been in a long consolidation phase after hitting an all-time high of 6113.92. Now, it’s approaching 6128.89—its key resistance level.
📊 Trade Setup:
✅ Long Entry: Above 6128.89, with confirmation.
✅ Why This Level? A breakout and confirmation could signal continuation of the uptrend.
✅ Extra Tip: Using momentum indicators like SMA & RSI can help filter out fake breakouts.
Final Thoughts & Risk Management
⚠ BTC is still ranging—stay patient and wait for clear structure before trading.
⚠ DXY weakness could support stocks & EUR pairs this week.
⚠ SPX breakout setup looks promising but needs confirmation.
💬 I’m Skeptic , and I’ll see you tomorrow with another market breakdown! 🚀
⚠ Disclaimer: These trade setups are based on my personal analysis and are not financial advice. If you don’t have a solid risk management plan, these triggers may not be suitable for you. Always do your own research (DYOR) and trade at your own risk. 💡

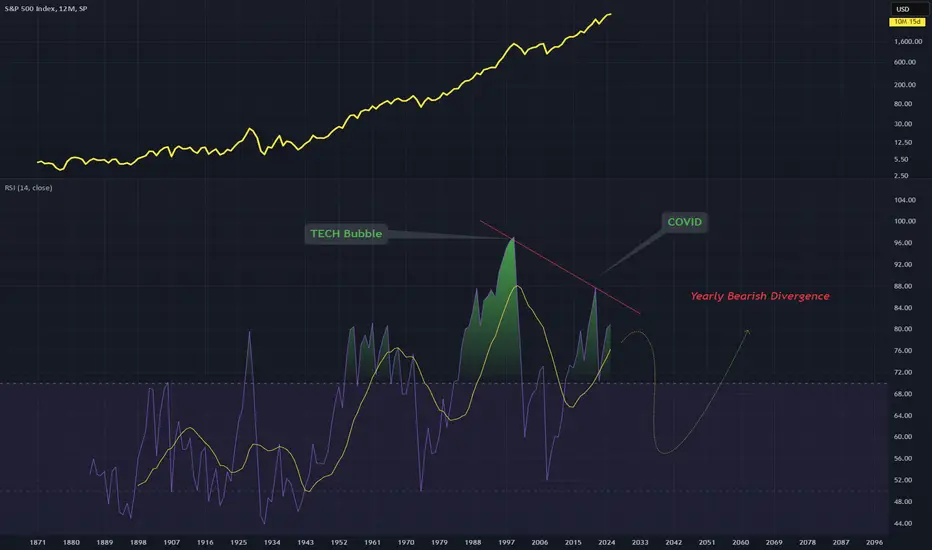
SPX RSI AnalysisThe Tech Bubble (2000) peak and the Peak during covid has formed a large bearish divergence on this yearly timeframe
this points to a potential trend shift on the yearly timeframe and another bear move
I'm bearish on stocks right now and bullish on crypto and rare metals
Additional post to my previous one which shows my downward move thoughts on the SPX
SPX - Extreme Greed SPX value has extended too far from its common trend line that extends a LONG time back
We are in a hyper bubble and don't even know it
I have been bearish on SPX for awhile now and am just waiting for the collapse
Period of extreme greed
Respect the Trend Line
3 Monthly chart

Selling S&P close to the All time highWe are entering this trade because:
1) It is 10 pips away from the all time high
2) There is a harmonic pattern
3) Last weeks high
4) Triple top on H1 with divergence
Target would be 6000 to start off with but will monitor and take profit along the way.

S&P500 retesting ATH,The Week Ahead 17th Feb 25The S&P (US500) index price action sentiment appears bullish, supported by the longer-term prevailing uptrend. However, since reaching an all-time high on Friday 24th Jan the S&P index price action is consolidating in a sideways trading range.
The key trading level is at 6012, which is the current swing low. A corrective pullback from the current levels and a bullish bounce back from the 6012 level could target the upside resistance at 6080 followed by the 6117 and 6130 levels over the longer timeframe.
Alternatively, a confirmed loss of 6012 support and a daily close below that level would negate the bullish outlook targeting a further retracement and a retest of 5964 support level followed by 5925.
This communication is for informational purposes only and should not be viewed as any form of recommendation as to a particular course of action or as investment advice. It is not intended as an offer or solicitation for the purchase or sale of any financial instrument or as an official confirmation of any transaction. Opinions, estimates and assumptions expressed herein are made as of the date of this communication and are subject to change without notice. This communication has been prepared based upon information, including market prices, data and other information, believed to be reliable; however, Trade Nation does not warrant its completeness or accuracy. All market prices and market data contained in or attached to this communication are indicative and subject to change without notice.

S&P 500 Daily Chart Analysis For Week of Feb 14, 2025Technical Analysis and Outlook:
During the recent weekly trading session, the S&P 500 effectively reached and tested the critical Key Resistance level at 6083. It retested the completed Outer Index Rally at 6120, indicating a potential continuation of the bullish trend toward the intermediate target of 6233. However, a market pullback is anticipated due to this price action. Current analyses suggest that the designated downward target is set at the Mean Support level of 6049, with potential extensions to 5995, 5936, and the Outer Index Dip at 5878.

S&P as always goes higherAs a routine for s&p we are waiting to see a rally and it’s very probable that this daily trading range would break to up in order to complete the two leg theory

Mixed Signals. Is Inflation ramping up?As hot data comes with CPI and PPI, the Treasury Yields and DXY have come down somewhat sharply.

SPY/QQQ Plan Your Trade For 2-14-25 : CRUSH PatternHappy Valentine's Day - everyone.
Tell the people around you how much they mean to you and how important they are to your life.
Today's SPY Cycle Pattern is a CRUSH pattern. These types of patterns are usually very large range bars that attempt to REVERT back to a mean price level - in this case - DOWNWARD.
Near the end of this video, I discuss some of my Custom Indexes and explain why the data tells me we are moving into a topping pattern for the US and global markets. Many of you watch my Plan Your Trade videos and probably think I make things up as I go.
Actually, a lot of data and research go into my decision-making. Ninety-nine percent of that data (usually in predictive modeling, Custom Indexes, and other resources) delivers a clear outcome. In this case, the result is "the markets are TOPPING."
So, even though the markets didn't cooperate with my Deep-V breakdown from Feb 10 to 13, I urge you to watch this video until the end, when I start sharing some Custom Index data/charts. Pay attention to what that data tells us.
Notably, the Smart Money Index and the Accumulation Phase Index are screaming, "The markets are TOPPING."
Gold and Silver move into a Gap-Revert-Stall-Flush pattern, again representing a reversion to the mean price level.
I believe today will be another moderately downward-trending Friday, as we've continued to see over the past three or more weeks.
Please spend a little time hitting the pause button and checking out some of my Custom Index charts. They are the data that drives much of my decision-making.
Get some.
#trading #research #investing #tradingalgos #tradingsignals #cycles #fibonacci #elliotwave #modelingsystems #stocks #bitcoin #btcusd #cryptos #spy #es #nq #gold

S&P internals and momentum show waekness These both divergences show short term weakness in the S&P 500
This does not mean that there are opportunities out there, european markets are showing strength
Even some S&P sectors still have good relative strength: AMEX:XSW AMEX:XLY AMEX:XLC
But commodities are even better, just see AMEX:DBA making new 52-week highs

SPX500 Is Bearish! Sell!
Please, check our technical outlook for SPX500.
Time Frame: 12h
Current Trend: Bearish
Sentiment: Overbought (based on 7-period RSI)
Forecast: Bearish
The market is testing a major horizontal structure 6,125.45.
Taking into consideration the structure & trend analysis, I believe that the market will reach 6,020.86 level soon.
P.S
Overbought describes a period of time where there has been a significant and consistent upward move in price over a period of time without much pullback.
Like and subscribe and comment my ideas if you enjoy them!

SPX 500 Returns to All-Time HighsDuring the last session, the SPX 500 index gained more than 1.2% following the release of PPI data in the United States. The core PPI (m/m) remained in line with expectations at 0.3% , providing a slight relief to the market, which had been on the edge after annual CPI inflation came in at 3.0%, exceeding the 2.9% forecast.
This mixed inflation data has given the U.S. index an opportunity to recover, as it remains uncertain whether the Federal Reserve will continue its aggressive interest rate policy. Persistently high rates have been impacting domestic consumption in the U.S. for several months, and if the central bank maintains rates at 4.5% in upcoming decisions, it could eventually become a bearish factor for the SPX 500.
Momentum Builds
In recent weeks, the SPX 500 had been trading within a sideways range, with a ceiling at 6,080 points and a floor at 5,840 points. However, the growing buying momentum has now pushed the index back toward all-time highs. If bullish pressure remains strong through the end of the week, a breakout from this range could pave the way for a more significant upward movement.
MACD Indicator
Both the signal line and the MACD line remain above the neutral level at 0 , adopting a steady upward slope.
The histogram has begun to oscillate slightly above the zero level.
If these conditions persist over the next sessions, bullish momentum could continue in the short term.
Key Levels to Watch:
6,082 points – The most critical resistance level at the moment, corresponding to the previous all-time high. Sustained price action above this level could reinforce the current bullish bias, opening the door to a stronger uptrend.
5,960 points – Nearby support, aligning with the mid-range of the consolidation phase and coinciding with the Ichimoku cloud and the 50- and 100-period moving averages. If price action falls back below this level, it could strengthen selling pressure and delay the possibility of new highs in the short term.
5,840 points – Distant support level, where a pullback to this zone could put the long-term uptrend at risk.
By Julian Pineda, CFA – Market Analyst

xauusd whats next?
**Gold Prices Surge Amid Resilient Market Sentiment**
Gold prices have surged once again, driven by robust buying activity as market participants capitalized on recent dips. As of Thursday, gold (XAU/USD) has climbed to $2,920, recovering sharply from a brief decline the previous day. This rally comes despite macroeconomic and geopolitical headwinds, including persistent U.S. inflation concerns and discussions of a potential peace deal between Ukraine and Russia.
### **Key Drivers of Gold’s Rally**
1️⃣ **Inflation and the Fed:**
Gold’s momentum follows a surprising January Consumer Price Index (CPI) report, which showed hotter-than-expected inflation. While the data initially spurred concerns about prolonged Federal Reserve tightening, market participants remain confident in gold's safe-haven status. Traders seem unfazed by rising U.S. Treasury yields and the Fed’s commitment to elevated interest rates, focusing instead on gold’s resilience amid broader uncertainties.
2️⃣ **Geopolitical Tensions:**
Despite reports of peace talks between U.S. President Donald Trump and Russian President Vladimir Putin concerning the Ukraine conflict, gold's bullish trajectory remains intact. Investors appear cautious, viewing the negotiations as fraught with uncertainty. While a peace deal could ease geopolitical tensions and trigger risk-on sentiment, the market’s current preference for safety has sustained gold’s appeal.
3️⃣ **Weaker Dollar Boosting Gold:**
The U.S. Dollar Index (DXY) softened amid optimism surrounding potential peace talks, alongside currency market volatility. A weaker dollar traditionally supports gold, as the two are inversely correlated, further bolstering the metal’s recent gains.
### **Market Dynamics: Yields and Gold Diverge**
Interestingly, gold’s rally has coincided with rising U.S. Treasury yields—a divergence from historical trends. Typically, higher yields weigh on gold due to its non-yielding nature. However, this time, gold’s safe-haven allure amid inflationary pressures and geopolitical uncertainty appears to be overriding these dynamics.
The CME FedWatch tool indicates a 64.3% probability that the Federal Reserve will keep rates unchanged through June 2025, up from 50.3% before the January CPI release. This shift reflects expectations of prolonged restrictive monetary policy, which could paradoxically support gold as inflation concerns persist.
### **Technical Analysis: Bulls Eyeing Record Highs**
Gold maintains a strong bullish bias, with prices supported by the 50-period Exponential Moving Average (EMA). Currently consolidating within a key buying zone between $2,900 and $2,907, the metal’s upward trajectory remains intact.
**Key levels to watch:**
- **Immediate Resistance:** $2,918 to $2,920. A successful consolidation above this range could set the stage for a test of $2,942 and potentially a new all-time high at $2,980.
- **Support Zone:** Holding above $2,907 will be critical for sustaining bullish momentum.
### **Outlook and Risks**
As markets digest the interplay of macroeconomic data, Federal Reserve policy, and geopolitical developments, gold remains a focal point for traders. While optimism around peace talks between Trump and Putin could introduce volatility, persistent uncertainties ensure gold’s safe-haven demand stays robust.
**Takeaway for Traders:**
Gold’s resilience amidst rising yields, elevated inflation, and geopolitical uncertainty highlights its role as a reliable safe-haven asset. Watch for a breakout above $2,920 for further bullish confirmation, with potential upside targets at $2,942 and beyond.
#gold #trading #marketupdate #CPI #Powell

SPY/QQQ Plan Your Trade for 2-13: Harami Inside PatternToday's pattern is a Harami Inside pattern. This suggests the markets will stay rather muted today - attempting to stay within yesterday's high/low range.
I believe the markets are still struggling to identify a channel that will ultimately break to the downside.
You'll see in this video why I believe the markets are struggling and will attempt to confirm the multiple Excess Phase Peak patterns over the next 20+ days - attempting to move downward.
But, we do have a very interesting FLAG/CHANNEL setup on the NQ, which is somewhat confirmed on the ES.
What I can guarantee is that we will see extreme volatility over the next 20-30+ days as price moves into the Flag Apex - attempting to break away from the Apex level.
Thank you for all your support and understanding yesterday. Dad is good. No issues.
The VA out here is great (Long Beach). Probably the best center for spinal recovery in the US. I love the people up there and how they take care of my father.
I urge everyone to stay cautious until the end of this week. As you know, I expect a breakdown into new lows.
We'll see if it plays out as I expect over the next week+.
Get some.
#trading #research #investing #tradingalgos #tradingsignals #cycles #fibonacci #elliotwave #modelingsystems #stocks #bitcoin #btcusd #cryptos #spy #es #nq #gold

SPX Ready to pop? The pressure is buildingSPX Ready to Pop? The Pressure Is Building… | SPX Market Analysis 13 Feb 2025
The market is wound up tighter than a coiled spring, and I’m starting to wonder what will finally trigger the next move.
From a commentary standpoint, this is snooze-worthy—but from a trading standpoint, the Theta burn is quietly adding pennies to our pockets. Even if the market isn’t moving, we’re still getting paid.
Let’s break it down…
📉 SPX is Stuck – But That’s Not a Bad Thing
The market has been compressing into a tighter range, creating a pressure buildup that could snap in either direction. While traders watching for big swings are frustrated, we’re happily raking in Theta decay.
💰 Theta Burn – The Secret to Profiting in a Boring Market
In choppy or sideways conditions, directional traders get wrecked
But income traders get paid to wait, thanks to option decay
Every day that passes without a move = profits added to our pockets
📌 Overnight Futures – Still No Directional Clues
The futures market isn’t offering any strong signals 📉📈
Price compression continues, across all indexes
🚀 What Happens Next?
Eventually, this coiled spring will snap—we just don’t know when
The key is patience—we don’t need a big move to win
Whether SPX explodes up or down, we’ll be ready 💡
📌 Final Takeaway?
Sideways markets may be boring to talk about, but for income traders, they’re a steady payday. The key is knowing how to extract profits while waiting for the breakout.
Fun Fact:
📢 Did you know? The longest sideways market in history lasted nearly 17 years (1966–1982).
💡 The Lesson? Even in extended choppy periods, there are ways to profit—as long as you have the right strategy.

Bad CPI, Perfect Setup Opportunity for the S&P500Today’s CPI was really bad: 3% vs. 2.9%. Bad for markets, good for the Dollar, and everything got slapped - S&P 500 included.
But honestly, moments like this are often where the magic happens. Zoom in, and you’ll notice that the Monday Low is still sitting there untouched. In a few minutes, the New York Stock Exchange opens. What am I hoping for? A sweep of that Low, followed by a quick reversal and a push to the upside.
On the 1-hour chart, the RSI is already in oversold territory. A sell-off at the open would be the perfect entry, aiming for a 1:3 risk-reward ratio. If the market plays along, this could get real interesting real fast.
🔹 Asset: S&P 500
🔹 Timeframe: 1H
🔹 Entry: 5974.60
🔹 Stop: 5936.90
🔹 Target(s): 6085.86

SPY/QQQ Plan Your Trade For 2-12: Base Rally PatternAlthough I believe the Base Rally pattern is still valid, the markets have been wound tightly near recent highs and I belive this unwinding/breakdown is what I have been suggesting (the Deep-V breakdown) for more than 35+ days.
I believe the sticky inflation data (CPI) will overpower the Base Rally pattern today and we will see the SPY/QQQ move downward into the Deep-V lows - likely setting up by Friday/Monday of this week.
I'm sorry I'm not able to create a morning video. I'm taking my disabled VET father to his annual checkup this morning. He is still sleeping and I don't want to wake him up.
So, you get this content as a substitute.
Be prepared for the markets to FLUSH OUT a low and try to grab some easy profits throughout today and tomorrow as the markets struggle to find support.
Remember, the broader cycle patterns can sometimes overpower the Daily Cycle Patterns. This happens when NEWS overpowers a Daily cycle pattern construct. In this case, the CPI data is overpowering the Base Rally Daily Cycle Pattern.
Ultimately, the markets will find support and move into a brief recovery phase.
Get some.
