AMD'S Monthly indicators are still high Different indicator are still elevated and suggests that there is more room to the down side in the next few months or even 2 years. We have seen much lower numbers accross the board when having a major troughs.
S&P 500 (SPX500)

SPY/QQQ Plan Your Trade For 1-29 : GAP ReversalToday's pattern suggests the markets are going to start off with a bit of a bang.
Although I expect the markets to try to hold up with some support, I believe, ultimately, the markets will break downward - continuing into the Deep-V Feb 9-10 bottom my cycles are projecting.
Gold and Silver are acting to attempt to hedge the global risks and could explode much higher over the next 30 - 60+ days.
Bitcoin looks like it will continue to move downward, first to 98k, then to 92k.
I'm seeing lots of Excess Phase Peak patterns in price action. This suggests the markets are struggling for direction right now and could move aggressively into a downward cycle phase before the Feb 9-10 Deep-V base/bottom.
Either way, we are going to find a lot of opportunities over the next 30+ days as traders.
Get some.
#trading #research #investing #tradingalgos #tradingsignals #cycles #fibonacci #elliotwave #modelingsystems #stocks #bitcoin #btcusd #cryptos #spy #es #nq #gold

AMD'S Short sell volume is screaming for a trough BUT downgradedMost analyst following AMD are downgrading its fundamentally because of the
AI new software coming from small company in China. Well, technically we are completely
going into the other direction which is we are having a major trough in coming weeks/months
in 2025 with + 50% move.
- The big question is when and where ?
WARNING: Some Elliottions are calling for a 1929 bear mkts !!!!!!!!!!

S&P 500 Rebounds After Monday’s DropS&P 500 Rebounds After Monday’s Drop
The S&P 500 index (US SPX 500 mini on FXOpen) has recovered following Monday’s sharp decline, which was triggered by the success of Chinese startup DeepSeek and its AI model. As of this morning, the index is trading above the week’s early high.
This resilience suggests that the stock market has stabilised ahead of the Federal Reserve’s decision, scheduled for today at 22:00 GMT+3. Interest rates are expected to remain unchanged, but the key question is what stance Fed Chair Jerome Powell will take now that Donald Trump has officially assumed the U.S. presidency. Trump has already stated at the Davos forum that interest rates should be lowered. Powell’s press conference is set for 22:30 GMT+3.
Technical analysis of the S&P 500 index (US SPX 500 mini on FXOpen) shows that the price is approaching the 6,100 level for the third time. The first two attempts to break above this level (marked with red arrows) were unsuccessful.
From a bullish perspective:
→ The long-term trend remains upward, as indicated by the moving average.
→ A successful breakout above 6,100 could turn this level into strong support, similar to how 5,660 acted previously.
However, it is also possible that:
→ Powell’s remarks today will be more hawkish than expected.
→ The market may react negatively.
→ The price could make a bearish move, reinforcing the relevance of the downward channel (marked in red).
Prepare for heightened market volatility this evening.
Trade on TradingView with FXOpen. Consider opening an account and access over 700 markets with tight spreads from 0.0 pips and low commissions from $1.50 per lot.
This article represents the opinion of the Companies operating under the FXOpen brand only. It is not to be construed as an offer, solicitation, or recommendation with respect to products and services provided by the Companies operating under the FXOpen brand, nor is it to be considered financial advice.

SPY/QQQ Plan Your Trade For 1-28 : Temp Bottom PatternToday's SPY Cycle Pattern is a Temp Bottom.
After yesterday's big breakdown and consolidation, I believe the SPY will attempt to identify support, possibly near 597, and attempt to move higher a bit today.
Ultimately, a Temp Bottom pattern is where the price seeks out support (moving downward or retesting recent support levels) and then rolls to the upside, creating a base/bottom type of pattern.
The QQQ should follow the same pattern.
Gold and Silver seem trapped for the next 2-3 days (possibly melting a bit higher as the US Dollar appears to be moving downward a bit).
I don't see Gold/Silver starting to make any big moves until Jan 31 or in early Feb.
Bitcoin will likely stall out, just like the SPY/QQQ, over the next 2-3 days, then move into a downward price phase - attempting to move back towards $92k.
I believe the markets are stalling and in a bit of shock at the moment. Don't get too aggressive in any trades unless you are confident in your ability to manage risk levels.
Some sectors/symbols will trend. But the SPY/QQQ will likely stall out for another 2-3 days before making another big move.
Get some.
#trading #research #investing #tradingalgos #tradingsignals #cycles #fibonacci #elliotwave #modelingsystems #stocks #bitcoin #btcusd #cryptos #spy #es #nq #gold

Nothing bad happendThe US markets fell sharply today. The S&P500 lost almost 2%. Many investors, especially on social media, are wondering whether the “Trump Rally” is now over. I think this is extremely unlikely. As is so often the case, markets tend to exaggerate, both upwards and downwards.
The price slide was triggered by news from China. Th AMEX:SPY ere, the start-up “DeepSeek” has announced that it has AI models that work just as well as their US counterparts at a much lower price and with less data.
This will certainly not have a lasting impact, but it should make us aware that the AI party will be over at some point.
SPY/QQQ Plan Your Trade For 1-27 : Consolidation PatternToday is an incredible day in my world.
I have been warning of a major peak/top near Jan 20-23 for more than 45+ days. I have continued to warn traders of a major top/peak near the Inauguration and how I believe the markets would suddenly shift downward - targeting the Feb 9-11 Deep-V bottom.
All of my predictive analysis is based on Gann, Tesla (Energy frequency, amplitude, vibration) and Fibonacci research.
The reason I state this is because I want you to start thinking of price action in terms of energy expulsion and consolidation.
Price is the ultimate indicator. My research proves we can attempt to predict future price moves (tops, bottoms, strength, weakness, and others) with a moderate degree of accuracy.
As I continue to expand my research, tools, and resources, I will continue to improve my analysis/predictive capabilities.
To me, this is very exciting.
Today, I would expect the markets to consolidate in a fairly wide/volatile range.
Gold and Silver will likely continue to try to recover/rally out of these flagging/pennant formations. Silver is set in more of a range-bound price channel, whereas Gold is clearly moving into a Pennant/Flag setup.
BTCUSD appears to have broken the EPP Flag channel and should attempt to move down to GETTEX:92K over the next 5+ days.
Get some.
#trading #research #investing #tradingalgos #tradingsignals #cycles #fibonacci #elliotwave #modelingsystems #stocks #bitcoin #btcusd #cryptos #spy #es #nq #gold

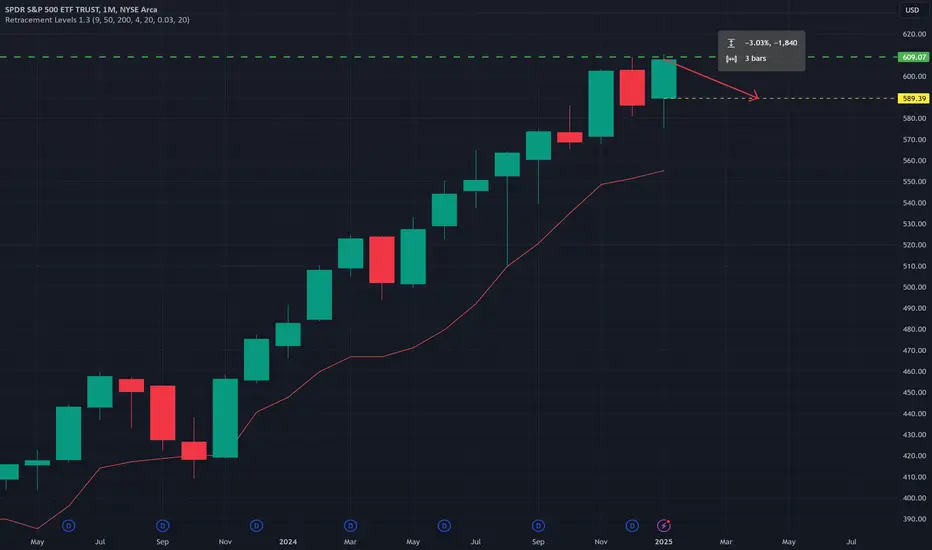
As Goes January So Goes the YearI have written and talked about this statistical superstition born out of trading almanacs of the "January Effect" which proposes that the month of January's direction (a green bar or a red bar) will determine the final close of the year as a whole. I plugged the data into a spreadsheet this year mid-January to get the updated statistic and for the last 97 years this adage has held true 68% of the time. Like all statistics when studying markets "nothing is 100%" but it is safe to say "more often than not" this is true.
The January 2025 Monthly open is -3.03% from the Friday close... SPY is going to open -2.19% as of writing this morning. We still have a whole week of trading days left in January to see how 2025 will MOST PROBABLY play out.
There's a lot of "reasons" talk this morning about some Chinese AI being the culprit of the selloff. I never take heed of the need for the media to publish digestible stories to give such reasons: they are never tradable prior to the event they claim and each is a one-off so knowing the "reason" (if even true) is totally worthless for making money.
The more logical answer according to price which is far more actionable to traders is the failed breakout last Friday. While SPY made a new All Time High the Weekly itself failed to close to confirm it. Not following through on such a move is a clear bearish signal going into a weekend. Now THAT is a much better "reason" to be focused on this week (and every time it happens in the future).
AMD CC with NDX is at one of lowest readings historicallyCorrelation Coefficient with NDX is suggesting a trough is in the making unless 1929 crashes start to happen soon as many Elliootions suggesting we are forming the final WAVE 5 of 1929 wave count.

AMD Hursts cycles, 18M, 4.5Y & 9 Years is closing on a trough!Using day one as the first candle to count
Using three time frames 18 Months, 4.5 Years and 9 Years
All else absolute, we are having a trough right this very moment of very
close by few months as illustrated on the chart.

WTI Crude Oil Futures: The Chokers of the Global EconomyLast Friday, January 10, 2025, the United States announced its most sweeping and aggressive sanctions against Russian oil trade, just ten days before Joe Biden leaves the White House and is replaced by Donald Trump.
In fact, it was more of a soap opera at first, as an unofficial document of unknown origin on the subject of sanctions had been circulating on the Web since the Fridays' morning before the official press release from the US Treasury appeared, causing the stock quotes of the companies affected by the sanctions to experience increased volatility in Friday trading on the local exchange.
Finally, about 160 oil tankers were sanctioned, and India, a key buyer of seaborne barrels, will not allow ships to call at its ports after the end of the curtailment period in March.
If these measures remain in place under Trump, they have a better chance of disrupting Russian oil exports than anything any Western power has done so far.
In addition to the tankers, sanctions were imposed on two major producers and exporters, traders arranging hundreds of shipments were listed, major insurers were named and two U.S. oil service providers were ordered to leave. A Chinese oil terminal operator was also included.
The measures could theoretically reduce what the International Energy Agency forecasts as a supply glut of nearly 1 million barrels a day this year.
Brent and WTI crude futures, which have generally traded lower for the past two and a half years, ended Friday at $80, data from ICE Futures Europe and CME Group's Nymex show.
Surgutneftegaz Sanctions RUS:SNGS and Gazpromneft RUS:SIBN are by far the most direct and aggressive move taken so far by Washington or any other Western power.
Together, the two companies shipped about 970,000 barrels of oil per day by sea in 2024, and their inclusion on the list will be a cause for concern for refineries in India as well as state-owned companies in China.
Putting their seaborne flows in context, that’s more than the global supply glut the International Energy Agency predicts for 2025. It’s also nearly 30% of Russia’s seaborne exports.
No one is suggesting that either company’s shipments will be completely shut down, but the fact that they are under sanctions, as well as other measures announced, means that supply chain disruptions and supply shortages cannot be ruled out.
Global markets, which were also hit by the December NFP report, reacted as expected.
The Nasdaq-100 immediately fell about 1%, the U.S. dollar index TVC:DXY rocketed to the moon while the yield on 10-year U.S. Treasury bonds TVC:TNX jumped nearly 10 basis points to 4.785%, its highest since October 2023.
Futures on the Dow Jones Industrial Average - a benchmark for the global economy - ended last week lower for a sixth straight week, while Bitcoin BITSTAMP:BTCUSD Bears are already dreaming to enter a Bear Market, approaching a 20% decline from the highs of around $108,000 reached in December 2024.
The technical main graph is dedicated specifically to WTI oil futures (the contract following the expiring one), and supported by the averages of the 5- and 10-year SMA.
It points to the reversal of the disinflationary time span seen in the previous two and a half years, from mid-2022.
// Don't say "hop" , before you throned 😏

Corporate earnings Versus SPXCorporate earnings and stock market getting balanced after 50 years weighted to M2 or money supply. We are entering a bubble territory.

SPX WEEKLY 27 JAN 2025Welcome to SPX Weekly. I have clearly explained the levels here. If you have any questions, please leave a comment below.
NOTE: ALWAYS TRADE WITH SL

Hellena | SPX500 (4H): SHORT to the area of 50% Fibo lvl (5972).Colleagues, I believe that price is completing wave “1” and I believe that a correction in wave “2” is inevitable.
I expect the price to reach the area of 38.2% - 50% Fibonacci levels (5972.9). I believe that a small update of the maximum of wave “1” is possible.
Manage your capital correctly and competently! Only enter trades based on reliable patterns!

#202504 - priceactiontds - weekly update - sp500Good Evening and I hope you are well.
comment: Bulls got another two bigger legs up which now makes it 5. Question now is, how likely is a continuation before a deeper pull-back? I do think Friday’s price action could have been the start of a wider profit taking by more bulls but until the bull channel is clearly broken and we have traded consecutive bars below the 4h 20ema, it won’t mean much. In the past 3 months we had very strong looking legs up, followed by deep pull-backs and we have not made a meaningful higher high since 2024-11-11. It’s reasonable to assume that we can hit 6200 before turning but I have big doubts about more upside beyond.
current market cycle: trading range
key levels: 5800 - 6200
bull case: Bulls made 140 points on the week with 5 clear legs up. Buying above 6130 is just bad no matter how you put it. Scalps ok but we have been in this trading range for 3 months now. Bulls want to print another ath and 6200 is the logical target. As long as the bull channel holds, they are favored and in control. Once we start closing gaps below again, more bulls will likely take profits.
Invalidation is below 5790.
bear case: Bears didn’t do much the past week but we are at big resistance again and shorts are great from a risk:reward perspective. The upside potential is probably limited to 6200/6300 but the downside is clear with 5800. For now you can only short this if you are willing to scale in higher, otherwise you have to wait for better selling pressure and a break of the bull trend line.
Invalidation is above 6300.
short term: Neutral 6100 - 6200, bearish below for 6000 and depending on how we get there, either wait for a lower high or we might continue down.
medium-long term - Update from 2025-01-26: Ultimately 5200-5300 in 2025. For now we are stuck in a range 5800 - 6200.
current swing trade: None
chart update: Adjusted targets and added the current bull channel and two big gaps.

S&P 500 Daily Chart Analysis For Week of Jan 24, 2025Technical Analysis and Outlook:
During this week's trading session, the S&P 500 successfully achieved our predefined target of Outer Index Rally, 6123, corresponding to the Key Resistance established at 6090. The market is currently exhibiting a phase of consolidation, as the bullish trend appears to be transiently suspended following the conclusion of the outer index rally. It is, however, essential to acknowledge that the absence of a significant corrective pullback may facilitate the re-initiation of a bullish trajectory toward additional rally targets. Such a development would position the market advantageously for the forthcoming phase of the bullish trend.

S&P 500: Bullish Breakout or False Move?Chart Analysis:
The S&P 500 is at a critical juncture, trading just below a significant horizontal resistance level near 6,114.
1️⃣ Key Resistance Level:
The horizontal level at 6,114 represents a pivotal resistance, as prior attempts to breach this zone were met with selling pressure.
A successful breakout above this level could signal further upside potential and a continuation of the bullish trend.
2️⃣ Moving Averages:
50-day SMA (blue): Rising around 5,980, providing dynamic support and reflecting sustained upward momentum.
200-day SMA (red): Trending upward near 5,628, confirming the long-term bullish trend.
3️⃣ Momentum Indicators:
RSI: Hovering near 65, indicating strong bullish momentum but approaching overbought conditions.
MACD: Bullish momentum remains intact, with the MACD line rising and staying above the zero line.
What to Watch:
Traders should monitor for a confirmed breakout above 6,114 on increased volume to validate further upside potential.
Failure to break above this resistance could lead to a retracement toward the 50-day SMA or previous support levels.
Keep an eye on RSI for any bearish divergence or signs of momentum weakening.
The S&P 500 is at a make-or-break level, and its reaction at 6,114 will determine the next directional move.
-MW

SPY/QQQ Plan Your Trade For 1-24 : CRUSH patternToday's CRUSH pattern should resolve as a very big and very volatile price move. Based on my experience with CRUSH patterns, I believe today's move will be to the downside.
The current trend is bullish/up (over the past 3+ days) and the SPY has just closed at a new closing price ATH.
The QQQ is still below ATH levels and is moving cleanly in an EPP Flagging channel.
I believe the SPY will stall out and revert downward today - essentially touching the new ATH levels yesterday, then rolling downward into my 1-20 through 1-23 topping pattern.
Gold and Silver are moving strongly higher today as metals finally start to hedge against global risk factors. Get ready, I see metals moving much higher over the next 60 to 90+ days.
BTCUSD has moved into a dual flagging pattern that I believe will resolve to the downside by about 9AM PT (12 noon ET). If my analysis is correct, this breakdown in BTCUSD could be the catalyst for a broader market downturn.
It sure looks like today is going to be a great day for traders.
Get some.
#trading #research #investing #tradingalgos #tradingsignals #cycles #fibonacci #elliotwave #modelingsystems #stocks #bitcoin #btcusd #cryptos #spy #es #nq #gold

Dollar down, Metals, Miners, Crude Up! SPX new high, Bitcoin???Premarket US dollar down while precious metals and mining stocks get a bid higher. SPX closes above 6118$ making new record high. Crude oil gets a minor bounce, can it retrace to $77? What is Bitcoin doing next? Will it close higher or sell off from here? That is the question.

S&P 500 Index Sets Record HighS&P 500 Index Sets Record High
As shown by the S&P 500 chart (US SPX 500 mini on FXOpen), the stock index:
→ has increased by approximately 3.5% since the start of the year;
→ surpassed its previous all-time highs set in December.
Market participants’ optimism was driven by:
→ a strong start to earnings season and expectations of robust reports from major tech companies;
→ statements made by Donald Trump at the Davos forum, where the US president urged Saudi Arabia to lower oil prices and expressed the view that interest rates should be reduced. Overall, such measures are expected to foster economic growth.
Reuters quoted Lindsay Bell, Chief Strategist at 248 Ventures: buyers "like the idea of interest rates coming down, of oil prices coming down. All in all, the market is optimistic the more they hear about Trump policies. We're just seeing a reflection of that optimism."
Technical analysis of the S&P 500 chart (US SPX 500 mini on FXOpen) reveals:
→ At the end of 2024, price fluctuations formed an ascending channel (marked by blue lines).
→ The December dip appears to be a correction within the prevailing uptrend. Bears managed to push the price below the lower blue line, but only for about a week.
→ After breaking the correction channel (shaded in orange), bulls faced brief resistance (indicated by the arrow) at the 6040 level.
→ The RSI indicator is in the overbought zone and signals divergence. This suggests a minor pullback could occur, potentially testing the aforementioned 6040 level.
Trade on TradingView with FXOpen. Consider opening an account and access over 700 markets with tight spreads from 0.0 pips and low commissions from $1.50 per lot.
This article represents the opinion of the Companies operating under the FXOpen brand only. It is not to be construed as an offer, solicitation, or recommendation with respect to products and services provided by the Companies operating under the FXOpen brand, nor is it to be considered financial advice.

SPX500 ICC Long Trade SetupPrice dropped from 6070 creating the bottom (L).
Before that bottom, price made that push upside (H).
After (L) price broke above (H), giving us an indication.
We knew that every time price broke back above (H) buyers were ready to buy.
First entry was valid, it was on session and zooming in the 15m buyers were strong and price was creating higher lows.
Although price didn't hit TP, stopped us and continued down to grab the liquidity sitting below the last low (L).
Then again, higher supports, zoom into 15m around the level of reaction to find highs breaking highs.
Back in session, price broke above the level so we re-entered buys, same trade as before, same SL and TP.
Some we lose some we win, what's important is sticking to the plan and managing risk!

S&P500 - Preparing For The Final Bullrun!S&P500 ( TVC:SPX ) is still heading higher:
Click chart above to see the detailed analysis👆🏻
Although the S&P500 has been creating new all time highs for the past couple of months, charts are clearly telling us that this bullrun is not over yet. We already saw two textbook cycles of +90% each and during 2025, we will see the completion of the third and final bullrun.
Levels to watch: $7.000
Keep your long term vision,
Philip (BasicTrading)

SPX500 SELL...Hello guys
Considering that the price reaches the resistance range, we can enter into the transaction with capital and risk management.
*Trade safely with us*
