Daily SPY (US500) Outlook - Prediction (10 NOV)📊 Market Sentiment
Market sentiment remains slightly bearish as expectations for a December rate cut may be postponed into 2026. We have seen some sell-offs, likely due to hedging or profit-taking activity. However, the market experienced a healthy bounce last Friday, as anticipated in my previous Daily SPY Outlook on November 7.
Trump announced that American citizens, excluding high-income individuals, will receive a $2,000 payment. This news could inject additional liquidity into risk assets, similar to what occurred during his first term. In my opinion, this may create a short-term bullish narrative for the markets.
📈 Technical Analysis
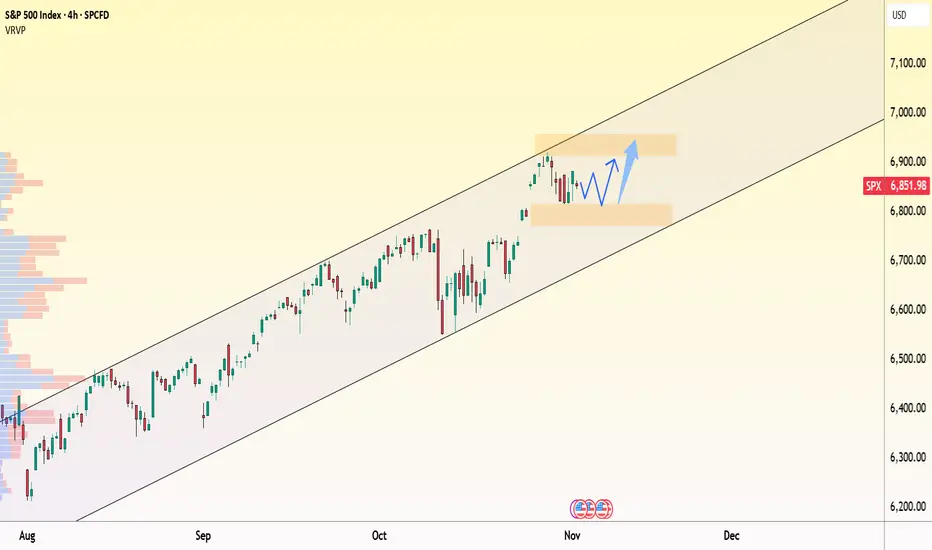
The ES market is showing strong pre-market inflows. I think the price may continue seeking higher levels, possibly targeting the 681 zone today.
📌 Game Plan
In my opinion, calls may perform well today. I plan to buy at the market open and take profits around the 681 level.
💬For detailed insights and broader market context, please check my Substack link in profile.
⚠️ For educational purposes only. This is not financial advice.
S&P 500 (SPX500)

SPX | Daily Analysis #12 - 10 November 2025Hello and Welcome Back to DP,
Review and News:
Last week was quite eventful. The index plunged toward the 6,640 area before a sharp rebound—helped in part by a series of market-friendly statements and tweets from former President Trump, which appeared to lift sentiment. Despite trading down more than 1.3% intraday, the market recovered impressively and ultimately closed the session in the green.
This week, investors will be watching closely to see whether Trump continues to influence sentiment with further comments or appearances that could help fuel market volatility and optimism. The shutdown remains at the center of U.S. politics. The Senate has advanced a temporary funding bill extending federal funding through January and reversing some layoffs, but final approval by the House and the President’s signature is still pending. Until a resolution is reached, uncertainty will linger across markets and public services.
The October Consumer Price Index (CPI) report—typically one of the most closely watched inflation indicators—is likely to be delayed due to the ongoing federal government shutdown. The lack of fresh data is creating a “data fog” for policymakers and traders alike.
Technical Analysis:
🟩 Demand Zones (Support Areas)
6,735 – 6,748 region
Multiple touches and strong buying reaction.
Large bullish candles emerged after price retested this area → indicates strong institutional demand.
It’s the nearest demand and acts as immediate support.
If broken, next possible downside continuation zone would be near 6,700 – 6,710.
Lower demand extension (6,730 – 6,740)
Good confluence with volume spike at lows → buyers defended this region before a sharp move up.
🟥 Supply Zones (Resistance Areas)
6,813 – 6,834 region
Clear previous consolidation before a breakdown.
This area now acts as a major supply / resistance zone.
Expect sellers to step in if price retests this zone — first test may trigger rejection.
It’s aligned with a local structure high; several long upper wicks in the past confirm supply pressure.
Above 6,834 → potential next supply
Around 6,850 – 6,860 (top of previous distribution).
Disclaimer:
This content is for informational purposes only and does not constitute financial or investment advice. © DIBAPRISM
Amir D.Kohn

US500 Intraday Technical Analysis📊 US500 Intraday Technical Analysis - 10 Nov 2025
S&P 500 at 6,792 (4:45 PM UTC+4) — Major breakout setup with confluence
━━━━━━━━━━━━━━━━━━━━━━━━━━━━━━━━━━━━
🔍 MARKET STRUCTURE
🔸 Wyckoff Phase D re-accumulation; Dow Theory primary uptrend intact
🔸 Gann Square-of-9 targets: 6,950 (resistance) / 6,650 (support)
🔸 Elliott Wave (3) extension in progress toward 6,950-7,050
━━━━━━━━━━━━━━━━━━━━━━━━━━━━━━━━━━━━
📈 TIMEFRAME MATRIX
Daily (1D): Rising channel 6,700-6,900; RSI 62 (bullish); Ichimoku cloud support 6,550
4H: Broadening wedge 6,750-6,900; EMA21>EMA50>EMA200 (golden cross); VWAP 6,680
1H: Cup-and-handle pattern; BB expanding; VWAP slope bullish
30M: Symmetrical triangle 6,780-6,850; hidden bull divergence on RSI; volume contracting
15M: Bull flag above 6,790; Tenkan>Kijun bullish; stochastic reset ready
5M: Falling wedge retest 6,800; hammer shows demand; watch false breakout
━━━━━━━━━━━━━━━━━━━━━━━━━━━━━━━━━━━━
🎯 PRIMARY LONG (HIGH PROBABILITY)
Entry: 6,790-6,820 (flag support + VWAP confluence)
SL: 6,750 (below triangle base)
TP1: 6,880 (+90 pips)
TP2: 6,950 (+160 pips — channel resistance)
TP3: 7,050 (+260 pips — harmonic extension)
Confirmation: RSI >55, volume +20%, VWAP holding
⚡ MOMENTUM SCALP
Add above 6,950 ONLY if RSI >65 + volume surge; trail stop 6,920
🔻 REVERSAL SHORT
Entry: 6,950-7,000 (supply resistance)
SL: 7,050 (above wedge)
Targets: 6,900 → 6,820 → 6,750 (Gann support)
Trigger: Bearish engulfing + RSI divergence on 5M/15M
━━━━━━━━━━━━━━━━━━━━━━━━━━━━━━━━━━━━
🚨 BREAKOUT ALERTS
✅ BULL: 1H close >6,950 confirms breakout → target 7,150; move SL to BE+25
✅ BEAR: 1H close <6,780 with volume → retest 6,650 cloud support
━━━━━━━━━━━━━━━━━━━━━━━━━━━━━━━━━━━━
📊 INDICATOR SNAPSHOT
BB Squeeze (30M) expanding | MACD histogram positive | VWAP slope up | EMA21 = trigger line | Hidden bull divergence confirmed on RSI
⚠️ PATTERN RECOGNITION
Harmonic Bat PRZ: 7,050 | Rising Wedge failure <6,790 = Wyckoff spring | H&S risk if 6,700 breaks | Bull trap risk above 6,950 without volume
📈 TIMING & VOLATILITY
Gann 90° window 21:00 UTC (US close) | ATR(14) ≈100 pts | Earnings whispers elevate risk | Risk ≤1% per setup; lock TP1; avoid chasing sub-avg volume
Educational analysis only. Follow your plan, manage risk, adapt to live price action.
━━━━━━━━━━━━━━━━━━━━━━━━━━━━━━━━━━━━
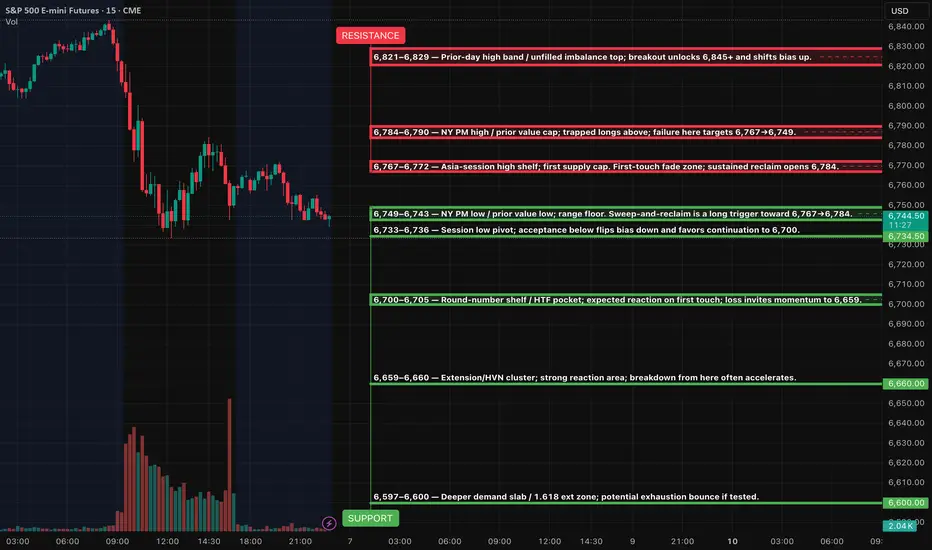
ES (SPX, SPY) Week Ahead Analysis, Levels (Nov 10th - 14th)Context (HTF)
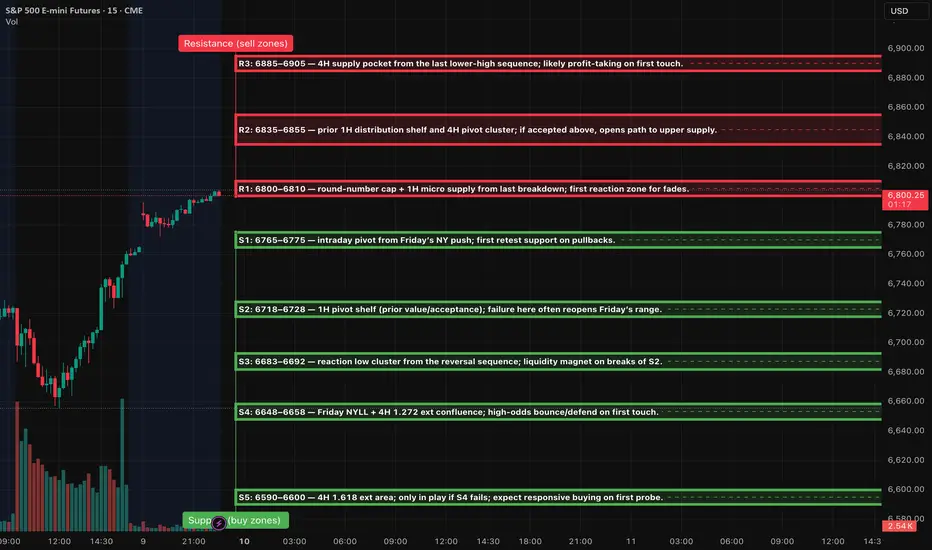
Price action has shown a notable rebound from the 6655 level, currently approaching the 6800 to 6810 range, which is characterized by recent supply identified on the 1-hour and 4-hour charts. Despite the ongoing lower-highs structure observed on the 4-hour timeframe, momentum appears to be shifting positively following Friday’s significant low. Traders should anticipate a period of two-way trading early in the week, likely within the 6650 to 6850 corridor, until mid-week economic data provides clearer direction.
Setups (Level-KZ Protocol 15/5/1)
1) Rejection Fade @ 6800–6810 (Tier-1 if first touch)
15m rejection back inside → 5m re-close below with LH → 1m first pullback fail.
Entry: 6798–6808 on 1m fail. SL: 15m wick-high +0.25–0.50.
TP1: 6768–6775 (S1). TP2: 6723 (S2). Viability gate: TP1 ≥ 2.0R using the 15m-wick stop.
2) Acceptance Continuation > 6810
15m full-body close above → 5m pullback holds 6805–6810 → 1m HL entry.
Entry: 6808–6812. SL: 6794–6798 (15m wick).
TP1: 6838–6848 (R2). TP2: 6885–6905 (R3). No trailing before TP2; at TP1 close ~70%, set runner to BE.
3) Quick-Reclaim Bounce @ 6765–6775 (Tier-2)
Sweep S1 → instant reclaim on 5m → 1m HL.
Entry: 6767–6774. SL: 6756–6759.
TP1: 6798–6810. TP2: 6835–6845.
4) Exhaustion Flush Bounce @ 6648–6658 (Tier-3)
Capitulation wick into S4 → 5m reversal signal → 1m HL.
Entry: 6651–6657. SL: 6639–6642.
TP1: 6686–6692. TP2: 6718–6728.
What can move ES this week (keep risk light around release windows)
• Tue (Nov 11): Veterans Day — equities open, U.S. bond market closed; liquidity can be thinner.
• Thu (Nov 13, 8:30 ET): October CPI.
• Thu (Nov 13, 8:30 ET): Initial jobless claims (weekly).
• Fri (Nov 14, 8:30 ET): October PPI and Advance Retail Sales.
• Fed speakers/boards: See the Fed’s official calendar for any added talks this week.
• Earnings of note: Several large caps report mid-week (e.g., Cisco; Disney). Expect single-name volatility spillover.
Notes for execution: mark the zones on 15m; wait for your 15→5→1 confirmation sequence; enforce the 2.0R viability gate using the 15m wick stop; no partials before TP1; max two tries per level.
S&P 500 Daily Chart Analysis For Week of Nov 7, 2025Technical Analysis and Outlook:
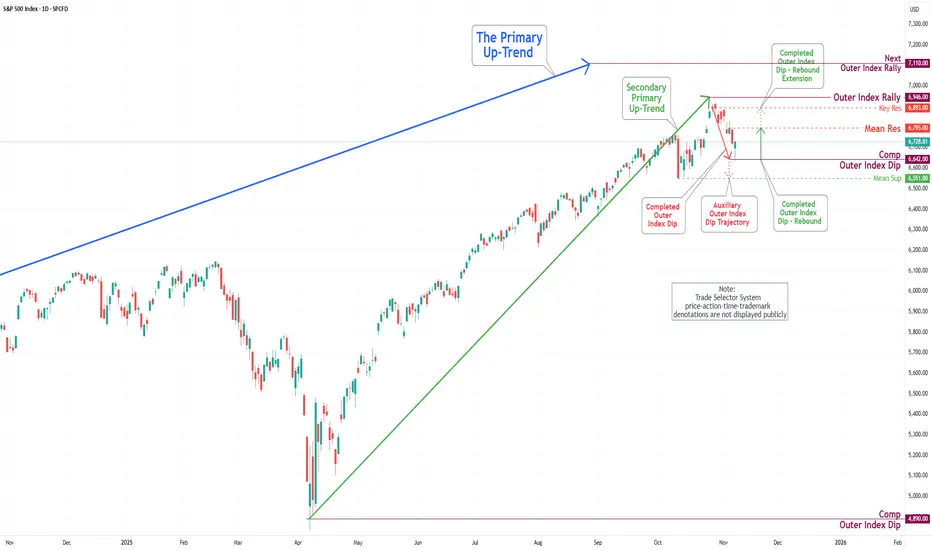
During the recent trading session, the S&P 500 Index experienced a notable decline, underscoring the significance of our key target, situated at the Mean Support level of 6,740. The index has now completed the Outer Index Dip at 6,642. This positioning indicates the potential for further upward movement, with the target established at the Mean Resistance level of 6,795. The prevailing trend suggests a well-structured extension towards the Key Resistance level of 6,893, with an ultimate target for the Outer Index Rally set at 7,110.
Nevertheless, it is crucial to acknowledge the possibility of a substantial drawdown in the forthcoming week’s trading session. This may lead to a retest of the Outer Index Dip at 6,642, possibly resulting in a further decline to the Mean Support level at 6,551 before ultimately resuming an upward trajectory.
EUR/USD - AUDNZD - GBP/USD - BTC - S&P500In this weekly video; I am analyzing the previous week and forecasting the next week.
EUR/USD - AUDNZD - GBP/USD - BTC - S&P500
Markets were quiet last week, and next week is very obvious.
Good luck to all of us.
Markets Titan

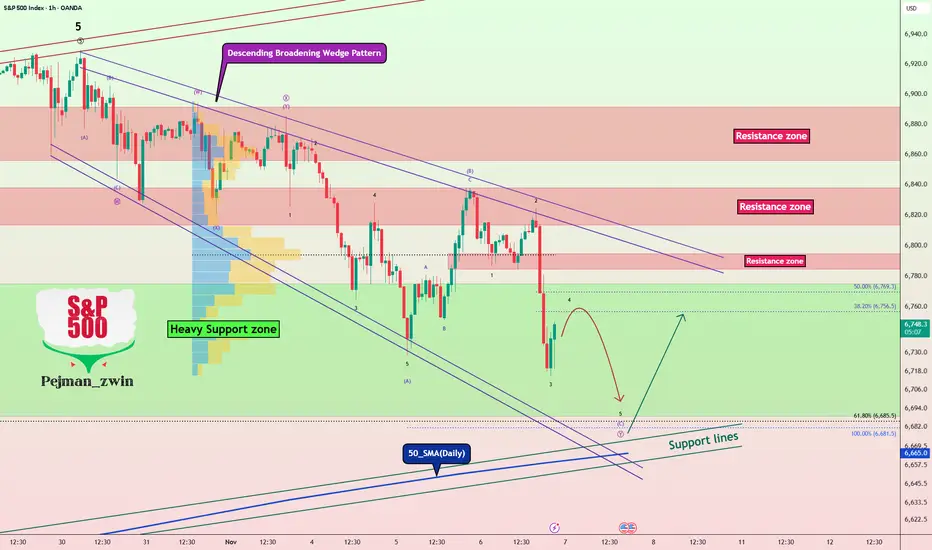
S&P 500 at Make-or-Break Level – Bulls’ Last Chance!As I expected in the previous idea , the S&P 500 index ( SP:SPX ) has reached its target.
Given that the S&P 500 index has a strong correlation with other financial markets, especially Bitcoin ( BINANCE:BTCUSDT )—sometimes even tracking them candle-by-candle—it's a good idea to pay extra attention to the S&P 500 index these days.
Currently, the S&P 500 index is moving in a Heavy Support zone($6,775_$6,689) , although it entered this zone with a lot of downside momentum.
From a classic technical analysis perspective, there's still a chance that the descending broadening wedge pattern will hold. As long as this pattern isn't invalidated, we can still hope for at least a short-term bullish move.
From an Elliott Wave perspective , it seems like the S&P 500 index is completing the microwave 4 of the microwave C of the main wave Y within the descending broadening wedge.
I expect that after the next small dip, the S&P 500 index will start rising again from near the lower boundary of the wedge, the 50_SMA(Daily) , and Support lines .
Note: If the S&P 500 index falls below about $6,650, we should expect further downside. So let's keep an eye on that level.
Please respect each other's ideas and express them politely if you agree or disagree.
S&P 500 Index Analyze (SPX500USD), 1-hour time frame.
Be sure to follow the updated ideas.
Do not forget to put a Stop loss for your positions (For every position you want to open).
Please follow your strategy and updates; this is just my Idea, and I will gladly see your ideas in this post.
Please do not forget the ✅' like '✅ button 🙏😊 & Share it with your friends; thanks, and Trade safe.
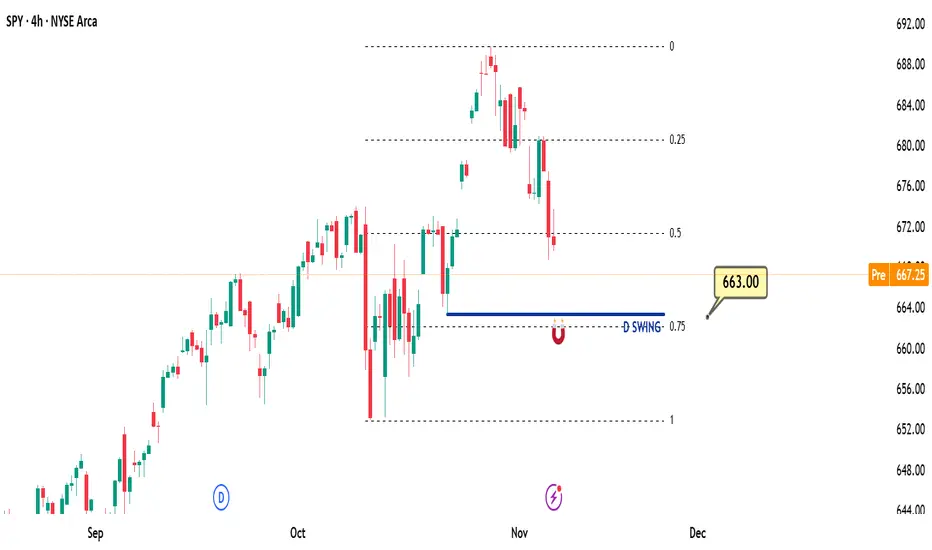
Daily SPY Outlook - Prediction (07 NOV)Daily SPY Outlook - Prediction (07 NOV)
📊 Market Sentiment
Market sentiment is slightly bearish as expectations for a December rate cut may be delayed into 2026. We have seen some sell-offs, likely due to hedging or profit-taking activity.
📈 Technical Analysis
Price is currently pulling back from the all-time high and moving within the equilibrium zone near the 670 level, which acts as short-term support. This is where I think accumulation may occur.
📌 Game Plan
In my opinion, price could reach the 663 level before showing a potential rebound. Therefore, I plan to stay short-biased toward 663, as puts might perform well today — unless I see a strong 4H candle close after the market open.
💬For detailed insights and broader market context, please check my Substack link in profile.
⚠️ Disclaimer: For educational purposes only. This is not financial advice.
Long BitcoinBitcoin! I took a small long. Minimal Stop-Loss: entry at 101850, SL at 99000. Lets see if this PIG tries to fill the Book again at 118k level ...

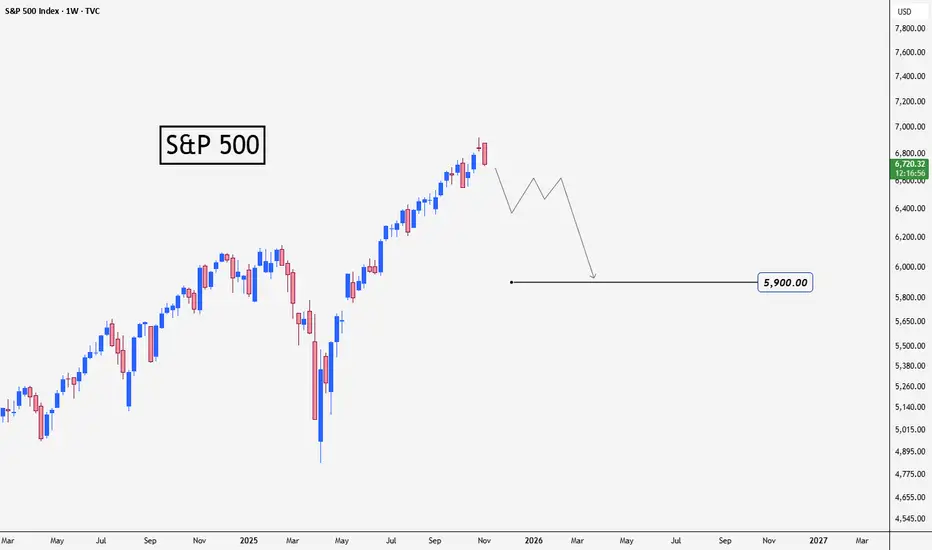
S&P 500 Predict the next waveHello everyone, I hope you are all well.
I wanted to share my prediction for the next wave of the S&P 500 index. It's as shown in the chart
The chart is on the weekly timeframe. I expect the decline to last for a period of time that could reach 6 months or more
This is not investment advice; please take full responsibility for your buying and selling decisions.
Warning: Be careful not to use this idea with leverage, as you could lose all your money
ES (SPX, SPY) Key Levels, Analysis and Setups for Fri (Oct 7th)EVENTS (ET, unaffected by shutdown): 3:00am NY Fed Williams speech; 7:00am Fed Vice Chair Jefferson speech; 10:00am Univ. of Michigan Consumer Sentiment (prelim); 2:00pm Fed G.19 Consumer Credit. Employment Situation report is postponed due to the shutdown (treat as no 8:30am print).
SETUPS (Level-KZ Protocol 15m→5m→1m)
ES LONG (A++) — 6,767 reclaim → 6,784 → 6,821
Entry: 6,768–6,772 after a 5m close and hold above 6,767 with 1m HL confirmation.
Hard SL: 6,755.
TP1: 6,784. TP2: 6,821. TP3: 6,845 if momentum persists.
ES SHORT (A++) — 6,784–6,790 pop-and-fail → 6,749 → 6,733
Entry: 6,782–6,789 on a 15m rejection close back inside the band followed by a 5m re-close down.
Hard SL: 6,796.
TP1: 6,767. TP2: 6,749. TP3: 6,733.
ES LONG (A+ Bounce) — 6,742–6,749 sweep & instant reclaim → 6,767 → 6,784
Entry: 6,750–6,753 after a swift reclaim and 1m HL.
Hard SL: 6,740.
TP1: 6,767. TP2: 6,784. TP3: 6,821.
ES SHORT (A+ Continuation) — 6,733 breakdown & retest → 6,700 → 6,659
Entry: 6,732–6,728 on 15m acceptance below 6,733 and a 5m LH retest.
Hard SL: 6,744.
TP1: 6,700. TP2: 6,659. TP3: 6,597.
KILL-ZONES & MANAGEMENT
Asia 20:00–00:00 optional and lighter size, London 02:00–05:00 optional, NY AM 09:30–11:00 primary for entries, Lunch 12:00–13:00 manage only, NY PM 13:30–16:00 allows second push or reversal plays. Daily guardrails: stop at −2R net or lock in ≥+3R net.
S&P 500 ROAD TO 7000 $SPX1. Executive Summary:
Following a significant correction from the 5000 level, the S&P 500 showed initial signs of stabilization on April 7th, 2025. The index had previously been rejected from a major resistance zone near the psychologically significant 7000 mark, having peaked around 6900. The current technical structure suggests a period of consolidation or pullback is underway. Critical support is identified in a layered zone between 6600 and 6200. A key finding from Fibonacci retracement analysis indicates that a hold above the 0.236 level (6428.21) could provide the necessary momentum for a renewed bullish assault, with the ultimate objective of retesting and breaking the 7000 level.
2. Recent Price Action & Market Structure:
Bullish Regeneration (7th April): The price action on this date is technically significant as it represents the first meaningful attempt to "regain" footing after a sustained drop. This could indicate that the initial wave of selling has exhausted itself, allowing buyers to step in.
Key Resistance & Rejection: The prior rejection from the ~6900 zone is a pivotal event. The failure to break through 7000 created a clear ceiling, establishing this area as a major resistance level that the market must now overcome to resume a long-term bullish trend.
3. Support Zone & Fibonacci Analysis:
The market has defined a clear hierarchy of potential support levels that will be critical in determining the next major directional move.
Layered Support Levels:
Immediate Support (6600): This is the first line of defence for the bulls. A bounce from here would indicate underlying strength and suggest the pullback is shallow.
Primary Support (6400): This level converges closely with the key Fibonacci level and is therefore a high-priority zone for buyers.
Significant Support (6200): A breach below 6400 would make this the next critical floor. A hold here is essential to prevent a deeper correction.
Fibonacci Retracement Context:
The Fibonacci tool has been applied to the most relevant upward move (likely from the 5000 low to the 6900 high).
0.236 Fibonacci Level (6428.21): This level is critically important. It represents a shallow retracement of the prior uptrend. The fact that it aligns with the identified 6400 support zone adds significant technical confluence.
Bullish Implication: A successful "bounce" from this ~6400/6428 confluence zone would be a strongly bullish signal. It would indicate that the broader uptrend remains intact and that the drop from 6900 is merely a healthy correction within a larger bull market. This would be the confirmation needed to project a move back towards the 7000 resistance.
Deeper Retracement Scenario (0.382 at 6123.76): Should the 0.236 level fail, the next major support resides at the 0.382 Fib level (6123.76), which aligns with the 6200 support. A bounce from this deeper level would still be constructive but would indicate a longer and more significant period of consolidation before a new high can be attempted.
4. Synthesis and Forward Projection:
The technical picture presents two primary scenarios:
Bullish Scenario (High Probability if 6400 Holds): The index finds strong support at the 6400/6428 confluence zone. The bounce initiated on April 7th accelerates, pushing the price back through the 6600 level and setting the stage for a retest of the 6900-7000 resistance area. A breakout above 7000 would then open the door for further all-time highs.
Consolidation Scenario (If 6400 Breaks): A break below the 0.236 Fib support shifts focus to the 6200/6123 zone. The market would likely enter a longer period of range-bound trading between ~6100 and ~6800 before gathering enough momentum for its next sustained move.
Conclusion:
In summary, while the S&P 500 faces clear overhead resistance following its rejection near 7000, the pullback is currently testing a critical support confluence near 6400. The bullish thesis for a "bounce back to 7000" is technically valid, but it is entirely contingent upon the index defending the 0.236 Fibonacci retracement level (6428.21) and the 6400 support zone. A trader should watch for confirmed bullish reversal signals (e.g., strong bullish engulfing candles, positive RSI divergence) at this level as the potential trigger for the next leg up.

S&P500 index weekly logarithmic chart hitting 2,618 extensionI have meticulously tagged every turn and twist since 2009 on this chart. Using elliottwave theory I believe that this structure is ending. Bear market next? I do not know, what I do know is that it's been a fabulous run since 2009. I'm short NQ futures December contract. Good luck

S&P500: Rebound S&P 500 futures managed to stage a modest rebound in yesterday’s session and are now showing renewed upward momentum. In our primary scenario, we expect magenta wave (5) to continue climbing and to ultimately mark a final high that completes the larger blue wave (III). Afterward, we anticipate a corrective phase via magenta wave (A), which should pull the index toward support at 6,371 points. However, if prices drop directly below the 6,371 points support, our alternative scenario will come into play. In that case, the alternative wave alt.(4) would likely extend further downward, finding its low within the magenta alternative Target Zone between 6,055 and 5,822 points.

S&P500 resilient US data reignited riskRisk appetite returned to markets over the last 24 hours, with the S&P 500 rising +0.37% as stronger US data and optimism over a potential end to the government shutdown lifted sentiment.
The ADP private payrolls report surprised to the upside at +42k (vs. +30k expected), while the ISM Services index jumped to 52.4 (vs. 50.8 expected) with new orders at a 12-month high, easing fears of an economic slowdown after Monday’s weak manufacturing data.
The improved tone triggered a broad risk-on rally:
US HY spreads tightened (-9bps) for the first time in a week.
Bitcoin rebounded (+3.38%) after recent losses.
Asian equities followed through overnight, with the Nikkei up +1.48% and Hang Seng +1.61%.
Despite solid data, Treasuries rallied as markets priced a higher chance of a December Fed rate cut, sending the USD to its biggest 3-week drop.
In corporate news, SpaceX agreed to buy EchoStar’s AWS-3 spectrum licenses for $2.6bn in stock, while EchoStar booked a $16.5bn non-cash charge tied to its 5G network wind-down.
However, some valuation concerns are re-emerging — the “Buffett Indicator” now shows US equities worth over twice GDP, with total market cap around $72tn, underscoring stretched levels after a +36% rally since April lows.
Bottom line: The S&P 500 regained momentum as resilient US data reignited risk appetite and rate-cut hopes, though extended valuations remain a potential headwind.
This communication is for informational purposes only and should not be viewed as any form of recommendation as to a particular course of action or as investment advice. It is not intended as an offer or solicitation for the purchase or sale of any financial instrument or as an official confirmation of any transaction. Opinions, estimates and assumptions expressed herein are made as of the date of this communication and are subject to change without notice. This communication has been prepared based upon information, including market prices, data and other information, believed to be reliable; however, Trade Nation does not warrant its completeness or accuracy. All market prices and market data contained in or attached to this communication are indicative and subject to change without notice.

The system is engineered for you to lose!Hey @TradingView Community
I want to be real with you.
Most traders don’t lose because they are bad at trading.
They lose because the whole system is built to make them lose.
Your broker wants you to believe they are helping you.
But in reality, they make money when you lose money (The B-Book Module).
Yes of course not all the brokers, but the majority.
It’s like a casino. The house always wins.
They want you to take big risks.
They want you to use crazy leverage so they can collect faster when your trade goes wrong.
And when it does, you blame yourself instead of the system.
You keep trying harder, but the game is not made for you to win.
Here is what I want you to know:
You don’t need to trade more.
You don’t need to chase every candle.
You need a system that is built to protect you, not your broker.
So in short, you have to have a proven trading system in place and a trading plan to follow every single time you take a trade.
That is what we created, a clear trading system that helps you focus on a few strong trades every week.
No guessing, no stress, no gambling.
And don't forget WTW 4 Golden rules!
1) Do not jump in
2) Do not over risk/trade
3) Do not trade without Stop Loss
4) Never ever add to a losing position!
Take with care,
Alain M(Coach)
WTW Team
FX:XAUUSD NYSE:DOW NASDAQ:NDX SP:SPX

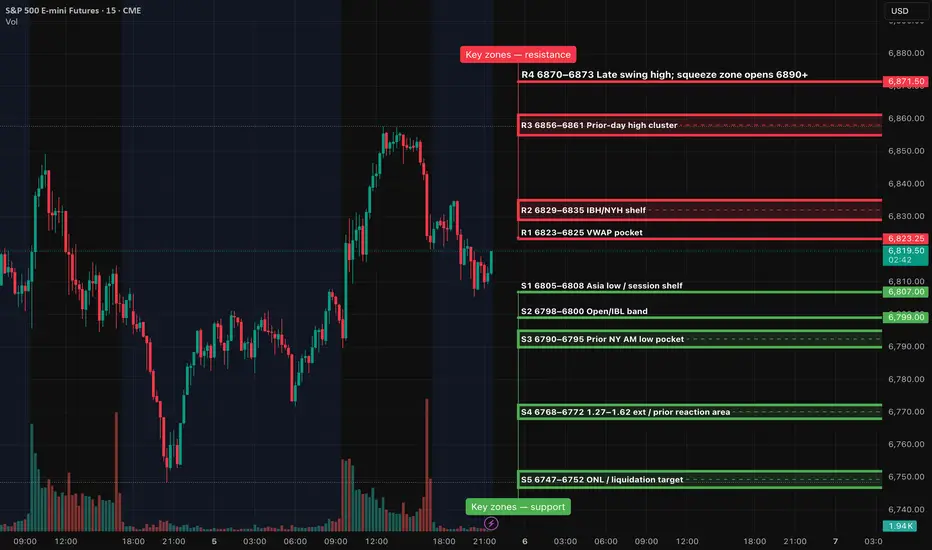
ES (SPX, SPY) Analysis, Key Zones, Setups for Thu (Nov 6)The daily trend has softened following the formation of a lower high. Analysis of the 4-hour chart indicates a bounce that encountered resistance near the 6860–6870 range, subsequently retreating to the 6810 support level. As we look ahead to tomorrow's trading, consider the 6805–6808 range as the key intraday “threshold” while the 6830–6835 zone will serve as the first significant resistance level to watch.
Setups (Level-KZ Protocol 15/5/1; NY KZ 09:30–11:00 & 13:30–16:00 ET)
1. Acceptance long from support
Trigger: 15m holds S1 6805–6808 → 5m reclaim 6823 VWAP → 5m close above 6830.
Entry: 6831–6834 on first 1m HL after the 5m re-close.
SL: 6821 (hard) or 15m trigger-wick −0.25–0.50 pt.
TP1: 6856–6861 (≥2R gate).
TP2: 6870–6873.
TP3: 6890–6895 if squeeze.
Management: No partials before TP1; at TP1 close 70%, set 30% runner to BE; no trail before TP2.
2. Rejection fade short from resistance
Trigger: Pop into 6856–6861, stall, then 5m full-body re-close back below 6856 with 1m LH.
Entry: 6850–6854.
SL: 6864.25 (hard) or 15m wick +0.25–0.50.
TP1: 6830–6832.
TP2: 6823 VWAP.
TP3: 6805–6808.
Note: If 5m re-claims 6861 after entry, exit early; setup invalid.
3. Breakdown continuation short
Trigger: 5m body close below 6805 with retest fail from beneath.
Entry: 6800–6803.
SL: 6810.75 (hard) or 15m wick +0.25–0.50.
TP1: 6790–6795.
TP2: 6768–6772.
TP3: 6747–6752.
Note: If reclaim and 5m closes back above 6808, cancel.
4. Breakout continuation long
Trigger: 5m acceptance above 6861 and hold on retest.
Entry: 6862–6865 on first 1m HL.
SL: 6853.25.
TP1: 6870–6873.
TP2: 6885–6890.
TP3: 6905–6912.
Note: If acceptance fails (5m body back under 6861), flip bias back to fade R3.
Event map for Thursday (ET)
FOMC meeting Day 1 (runs Thu–Fri; Fed is not affected).
EIA Weekly Natural Gas Storage 10:30.
Most BLS/DOL macro releases (e.g., Productivity & Costs, Weekly Jobless Claims) are suspended during the shutdown. Expect fewer 8:30 prints and thinner liquidity until the cash open.
S&P 500 at Critical Support – Last Line of Defense?Since the S&P 500 index( SP:SPX ) is one of the key indicators in the financial markets, and it’s been highly correlated with parallel markets recently, it's always a good idea to keep an eye on its analysis.
Now, for example, Bitcoin ( BINANCE:BTCUSDT ) started to decline as the S&P 500 index dropped, and right now the S&P 500 index is at a pretty critical Support zone($6,774_$6,689) and Support lines. It's essentially moving right around its last line of hope.
From an Elliott Wave theory perspective, in this current zone, the S&P 500 index could be completing the Triple Three Correction(WXYXZ)=main wave 4.
Looking ahead, we might expect the S&P 500 index to climb up toward its Resistance zone($6,894_$6,859). And given the current positioning, the risk-to-reward ratio looks quite favorable—as long as you keep a reasonable stop loss in place and practice good risk management.
Note: if these Support lines break downward, we could see further declines in the S&P 500 index and in those correlated markets as well. So it's definitely something to monitor closely.
Please respect each other's ideas and express them politely if you agree or disagree.
S&P 500 Index Analyze (SPX500USD), 1-hour time frame.
Be sure to follow the updated ideas.
Do not forget to put a Stop loss for your positions (For every position you want to open).
Please follow your strategy and updates; this is just my Idea, and I will gladly see your ideas in this post.
Please do not forget the ✅' like '✅ button 🙏😊 & Share it with your friends; thanks, and Trade safe.

DXY-USD Game PlanDXY-USD Game Plan
📊 Market Sentiment
On 29/10, the FED lowered rates by 25BPS as expected. However, Powell’s remarks introduced uncertainty regarding December’s potential cut, stating that decisions will depend on upcoming data.
One FED member dissented, preferring no cut, a shift from September’s unanimous decision.
As a result, rate cut expectations dropped from 95% to 68%, sparking short-term bullish sentiment for the USD, as traders adjusted portfolios toward defensive positioning.
📈 Technical Analysis
The Dollar Index (DXY) hit its HTF Weekly Bullish Trendline and got rejected, forming a structural reversal pattern.
We’ve now seen a break of short-term daily bearish trend, confirming strength and a potential leg higher toward 102.00 (Monthly FFVG).
📌 Game Plan / Expectations
Expecting price to wick or close above 100.25, then potentially retrace before resuming the bullish leg.
Primary upside target: Monthly FFVG zone at 102.00.
Sentiment remains bullish for the dollar short term, which may pressure risk assets (stocks and crypto) temporarily.
💬 If this DXY breakdown supports your macro view, like, comment, and follow.
For deeper insights and liquidity-based macro models, subscribe to my Substack (free access available).
⚠️ Disclaimer
This analysis is for educational purposes only and does not constitute financial advice. Always conduct your own research before trading or investing.

Bull Run Stumbles: S&P 500 Heads Toward a Potential Correction After a rough day on Wall Street, the S&P 500 dropped about 1.2%, pulling U.S. markets lower. But there’s more behind this fall than just profit-taking.
What’s Really Happening?
Warning Signs from Wall Street
Two top banking leaders raised caution. Morgan Stanley’s Ted Pick expects a 10–15% correction, calling it a “healthy normalization.”
Goldman Sachs’ David Solomon warned that tech stocks are showing bubble-like behavior, with prices running much faster than earnings.
AI Boom Driving Market Concentration
The AI craze and tech optimism have made a few mega-cap companies dominate the market. In fact, just 10 big tech firms now make up nearly 40% of the S&P 500’s total value, making the market more fragile.
Fed Confusion Adds to Uncertainty
The Federal Reserve is sending mixed signals — some officials talk about possible rate cuts by December, while others say rates should stay high because the economy is still strong.
Adding to the mess, a partial U.S. government shutdown has delayed key data, leaving investors and the Fed guessing about what’s really happening in the economy.
What the Chart Reveals
From a technical standpoint, the U.S. market’s rally has been nothing short of extraordinary. Since the April bottom near 4,835, the index has soared nearly 42%, touching a recent peak around 6,920 — and even gained about 12–13% before the latest (April 2025) pullback began.
But now, the momentum seems to be fading. The chart is flashing early warning signals — RSI divergence suggests that while prices made new highs, the underlying strength (momentum) did not. That often hints at a potential trend reversal.
If this weakness deepens, the index could correct swiftly by around 10%, targeting the 6,200–6,100 zone. And if the “healthy normalization” predicted by Morgan Stanley’s Ted Pick (a 15% drop) plays out, the index might slide further to around 5,700 — a level that would reset valuations to more reasonable territory after the sharp run-up.
Valuation Check
Let’s set aside all the opinions and headlines for a moment and focus on the key valuation metrics that truly help us understand the real picture of the U.S. market.
The Price-to-Earnings (P/E) Ratio — The Market’s Mood Meter
P/E Ratio = Current Market Price/Earnings Per Share (EPS)
So, Current Market Price = P/E Ratio*EPS
Currently, the S&P 500’s P/E ratio stands at 30.8x, with an EPS of $222.5.
When you multiply the two — 30.8 × 222.5 = roughly $6,800 — it perfectly aligns with the index’s recent market level.
Now, to find out what the fair value of the market should be, let’s use the 5-year median P/E ratio, which is around 25.4x.
Fair Market Price = 25.4*222.5 = 6,650.
This aligns perfectly with the technical chart levels, suggesting that a 15% correction would be a healthy pullback to help cool down the overheated U.S. market.
The Buffett Indicator — Market Cap vs. GDP
One of Warren Buffett’s favorite valuation tools compares the total U.S. stock market capitalization to the country’s GDP — essentially measuring how large the market has grown relative to the real economy.
At present, this ratio stands at around 224%, far above the long-term fair value range of 100–120%. Even when compared to its 5-year median level of 192%, the market still appears significantly overvalued.
To return to its median level, the ratio would need to drop by roughly:
100 = 16.6%
That’s roughly a 15–16% correction, which again perfectly aligns with both the technical chart signals and Ted Pick’s projection of a healthy market normalization.
The Bottom Line
The U.S. market’s extraordinary rally has been built on a mix of AI optimism, liquidity hopes, and investor euphoria, but the fundamentals are starting to whisper caution.
Both valuation metrics and technical signals point to the same conclusion — the market is stretched, and a 10–15% correction wouldn’t be a disaster; it would be a return to balance.
History shows that every overheated bull run needs a pause — not to end the story, but to give it a stronger foundation.
So if the coming months bring some red on the screen, smart investors will see it not as fear, but as the market taking a deep breath before its next big move.

SPX500 - Biggest Weekly Loss as AI Valuations Face ScrutinySPX500 – MARKET OUTLOOK | Biggest Weekly Loss as AI Valuations Face Scrutiny 🇺🇸
The S&P 500 posted its largest weekly loss in weeks as investors questioned high AI stock valuations and shifted toward safer assets.
The index remains under bearish pressure while trading below 6,770, with momentum favoring further downside.
🔽 Below 6,770: Bearish continuation toward 6,705 → 6,670 → 6,610.
🔼 Above 6,782: Bullish correction toward 6,814 → 6,842.
Pivot Zone: 6,755–6,765
Support: 6,705 · 6,670 · 6,610
Resistance: 6,798 · 6,814 · 6,842
SPX500 remains bearish while below 6,770, but a confirmed 1H close above 6,782 could trigger a short-term recovery toward 6,814–6,842.

ES (SPX, SPY) Analysis, Levels, Setups for Wed (Nov 5th)News & timing (ET): ADP 8:15; ISM Services PMI 10:00; EIA Crude 10:30. Release status: all three are scheduled to run (not shutdown-affected).
Bias & context: Short-term trend remains lower after a sequence of 15m lower-highs/lows and failure to hold 6,793–6,805. Expect dip-buys to be sold unless 6,860+ is reclaimed and defended.
Overnight → NY forecast:
Base path: probe 6,748–6,756 into Asia/London, bounce to 6,793–6,805, then decide at NY open. Lose 6,748 on momentum and the magnet becomes 6,713–6,725.
Alt squeeze: reclaim and hold above 6,852–6,860, push to the 6,900–6,906 “gate”, then 6,940–6,955. Only above 6,955 can 6,968–6,985 and 7,020–7,052 come into play.
Bear extension: clean break and 15m body acceptance below 6,713–6,725 opens 6,660s (deeper extension) before any meaningful bounce.
Key-Zones
Resistance (top→bottom):
7,020–7,052 premium band (W3 major; first touch favors profit-taking)
6,968–6,985 measured-extension / weak-high pocket (W2)
6,940–6,955 prior distribution top / supply shelf (W2)
6,900–6,906 immediate ceiling “gate” (W2 pivotal)
Support (top→bottom):
6,852–6,860 defended floor / quick-reclaim bounce zone (W2)
6,793–6,805 swing-equilibrium magnet (W2)
6,748–6,756 next demand shelf / measured support (W2)
6,713–6,725 extension target and last strong shelf before deeper repricing (W3)
Setups (Level-KZ Protocol 15/5/1)
Rejection Fade (short): sell 6,852–6,860 or 6,900–6,906 after a 15m rejection close back inside → 5m re-close in your favor; use the 15m wick +0.25–0.50 pts as hard SL. TP1 = next opposing MAJOR level (e.g., 6,805 then 6,756).
Acceptance Continuation (long): only after a full-body 15m close above 6,860 and a 5m pullback that holds; target 6,900–6,906 → 6,940–6,955; invalidate on a 15m close back below 6,852.
Quick-Reclaim Bounce (Tier-2): flush into 6,748–6,756, instant reclaim on 1–5m, enter on first HL; TP1 = 6,793–6,805; invalidate on a 15m close back below the shelf.
Exhaustion Flush (Tier-3): if 6,748 breaks with force and a 15m body holds below, sell the first 1–5m LH; TP1 = 6,713–6,725; runner eyes 6,660s if momentum persists.
Risk & management (use consistently):
Instructions: only take a setup if TP1 ≥ 2.0R using the 15m-wick SL.
At TP1: close 70%, set 30% runner to BE; runner aims TP2 at the next major level.
No trailing before TP2. Time-stop 45–60m if neither TP1 nor SL hits. Max 2 attempts per level per session.
Kill-zones (ET): London 02:00–05:00 (optional ½–¾ size); NY AM 09:30–11:00 (primary); NY PM 13:30–16:00 (primary). Manage only 12:00–13:00.
What flips decision:
Bullish: sustained 15m acceptance above 6,860 then above 6,906 turns path toward 6,940–6,955 → 6,968–6,985.
Bearish: 15m acceptance below 6,748 invites 6,713–6,725; losing that level opens 6,660s before any notable bounce.

SPX:uptrend remains intact – consolidating for the next breakoutOn the 4-hour chart, the S&P 500 (SPX) continues to move firmly within its ascending channel , with the current range around 6,850–6,900 representing a healthy pause after a strong rally. The nearest support sits at 6,800, where buyers previously stepped in, while short-term resistance remains near 6,900.
From a news perspective, the rally is still being driven by tech and AI sectors , especially after the Amazon–OpenAI partnership deal , which reignited positive sentiment across the market. However, investors remain cautious ahead of upcoming U.S. ADP employment and ISM PMI data , which could influence the Fed’s next rate-cut decision.
Overall, the technical structure still supports an upward bias: SPX is consolidating between 6,800–6,900 before potentially breaking toward the 7,000-point zone , aligning with the upper boundary of the trend channel.
As long as the 6,800 support holds, the market retains room for another bullish leg in the sessions ahead, backed by renewed capital inflows into leading sectors.