SPX ATH fluctuacionSPX managed to gap down after a freshly created all time high (ath), which proved to be a strong resistance. Weekly close left us in no man's land.
The new ath also came short 5 points off 3000.
Spx500long

SPX bounced from support, potential for a further rise!
SPX bounced off its support at 2956.1 where it could potentially rise further to 3105.3.
Trading CFDs on margin carries high risk.
Losses can exceed the initial investment so please ensure you fully
understand the risks.
Elliott Wave View: More Upside in S&P 500 Futures (ES_F)Elliott wave view in S&P 500 Futures (ES_F) shows a bullish sequence from December 26, 2018 low favoring further upside. In the short term chart below, the pullback to June 27 low (2914.5) ended wave ((ii)). Wave ((iii)) remains in progress as an impulse Elliott Wave structure looking for more upside. Up from June 27 low, wave (i ) ended at 2981.75 with subdivision as another impulse in lesser degree. Wave i of (i) ended at 2944.75 and wave ii of (i) pullback ended at 2935. Index then resumes higher in wave iii of (i) towards 2977.5, wave iv of (i) ended at 2963 and wave v of (i) ended at 2981.75.
Wave (ii) pullback ended at 2955.5. Wave (iii) is in progress and short term, while dips stay above 2955.74, expect the Index to extend higher. We don’t like selling the Index. As far as pullback stays above July 2 low (2955.74), expect Index to continue higher. If pivot at 2955.74 gives up, the Index is still expected to remain supported against June 4 low (2728.75). The Index has potential target to the upside towards 100% extension from December 26, 2018 low which comes at 3377 – 3529 area.

S&P 500 4H LongAn inverse head and shoulders formed, with a right shoulder break of the neckline. Measuring the distance from the head to the neckline, a reasonable target could be found slightly less than this distance applied to the breakout. In addition, long term resistance line can be found to intersect with this potential target zone.
The ADX line looks to be turning upwards after a downward trend, currently at 38.
A Stop Loss zone below the right shoulder would be appropriate.
*Not financial advice*

SPX bounced from support, potential for a further rise!
SPX bounced off its support at 2956.1 where it could potentially rise further to 3105.3.
Trading CFDs on margin carries high risk.
Losses can exceed the initial investment so please ensure you fully
understand the risks.

SPX bounced from support, potential for a further rise!
SPX bounced off its support at 2956.1 where it could potentially rise further to 3105.3.
Trading CFDs on margin carries high risk.
Losses can exceed the initial investment so please ensure you fully
understand the risks.

SPX bounced from support, potential for a further rise!
SPX bounced off its support at 2956.1 where it could potentially rise further to 3105.3.
Trading CFDs on margin carries high risk.
Losses can exceed the initial investment so please ensure you fully
understand the risks.

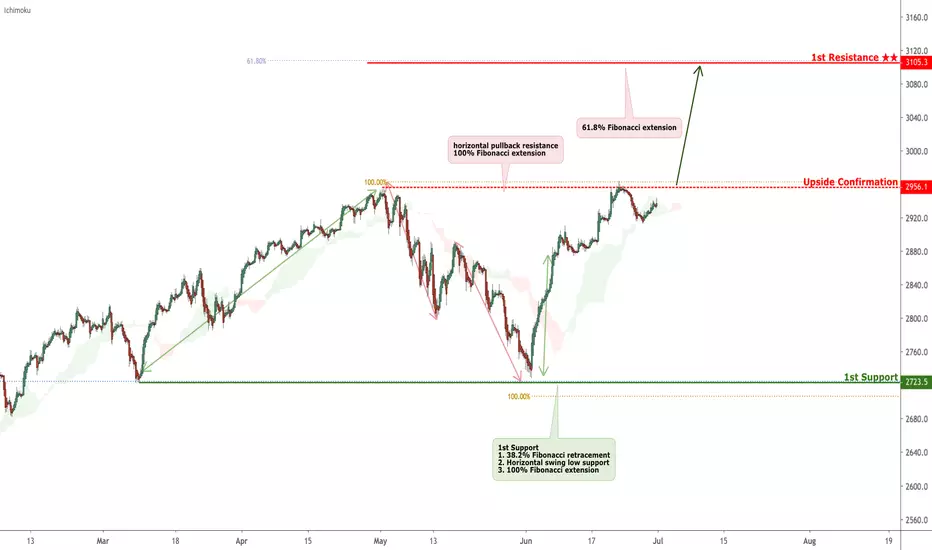
SPX bounced from support, potential for a further rise!
SPX bounced off its upside confirmation support at 2956.1 where it could potentially rise further to 3105.3.
Trading CFDs on margin carries high risk.
Losses can exceed the initial investment so please ensure you fully
understand the risks.

SPX LongStocks will perform better than the past few weeks with the truce between China and the US coming into effect as investors will see reason to buy. USD or Dxy should see strength as well.

SPX500 - Pendant breakout UP or DOWNOn the hourly SPX500 formed another pendant. Good news from G20 today - UP. No news or negative news - DOWN. Most likely we're going to breakout UP.

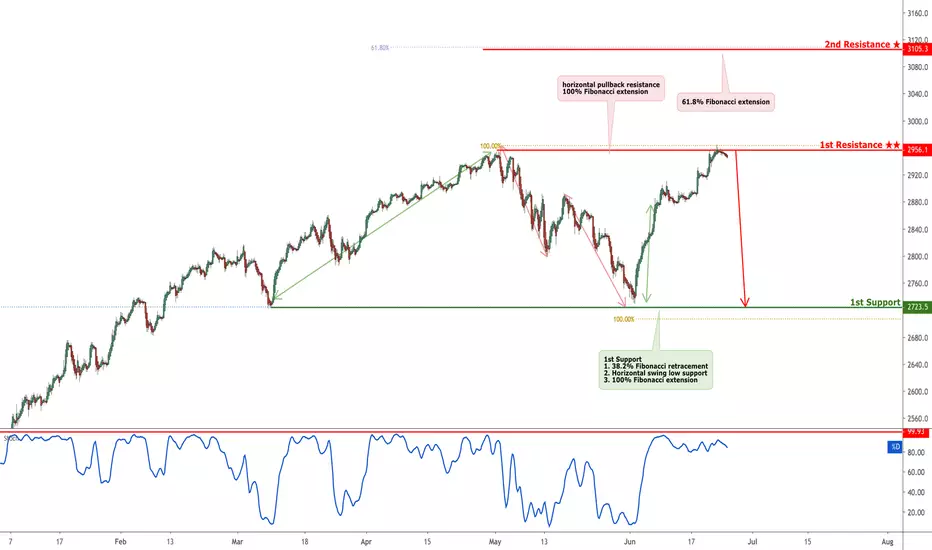
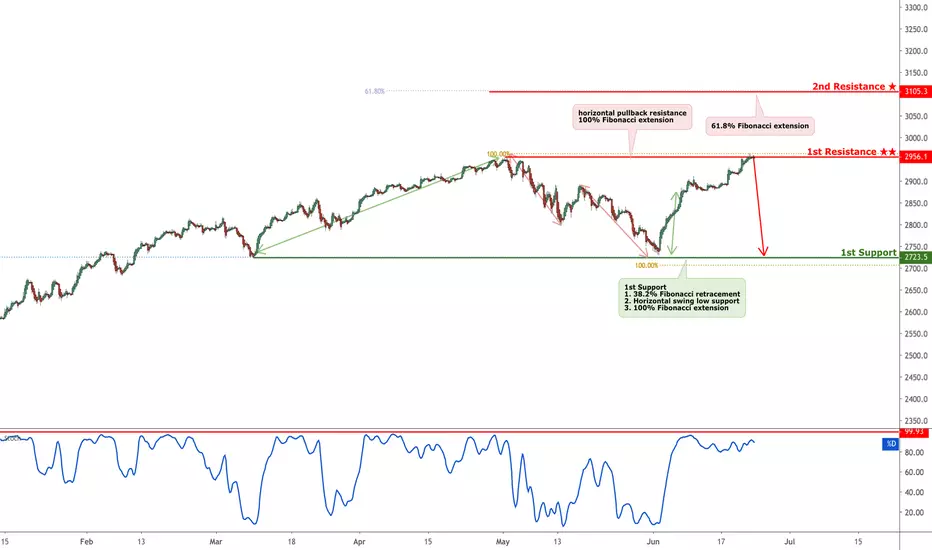
SPX reversed from resistance, potential drop!
SPX reversed off its resistance at 2956.1 where it could potentially drop further to 2723.5.
Trading CFDs on margin carries high risk.
Losses can exceed the initial investment so please ensure you fully
understand the risks.

Will the big breakthrough be in the coming week? #SP500The last fall came after the SP500 failed for the third time to break the resistance in 2957.
Once the SP500 will break this resistance, the rise will be very sharp.
Stochastic in its very low area for buy).
Support at 2911.
Small target: 2958
The big target: 3000

SPX reversed from resistance, potential drop!
SPX reversed off its resistance at 2956.1 where it could potentially drop further to 2723.5.
Trading CFDs on margin carries high risk.
Losses can exceed the initial investment so please ensure you fully
understand the risks.

SPX reversed from resistance, potential drop!SPX reversed off its resistance at 2956.1 where it could potentially drop further to .2723.5
Trading CFDs on margin carries high risk.
Losses can exceed the initial investment so please ensure you fully
understand the risks.


SPX500 - Bounced from 50 Fib - LONGSome soft of consolidation is required before moving higher up. SPX lost momentum yesterday, was pulled back. We are still seeing bulling movement which might climax on Friday late afternoon (before G20).
If G20 summit opens a door for further negotiations between Trump and Xi, we shall see another ATH or at least confirm it.
-=Never give up=-

SPX - another all time high is on the horizon? S&P500SPX is missing a 5th wave up (Elliot) and looks like there might be another push up to $2995-3010 area??? This would play out well with GOLD set up. Triple top and a massive crash afterwards. This will catch all of the FOMOs out there, squeeze all of the juices that are left in the lemon, destroy all of the shorters and Debbie-Downers and then a massive Bye Bye? Just an observation.

SPX reversed from resistance, potential drop!SPX reversed off its resistance at 2956.1 where it could potentially drop further to 2723.5.
Disclaimer:
Trading CFDs on margin carries high risk.
Losses can exceed the initial investment so please ensure you fully understand the risks.
SPX reversed from resistance, potential drop!SPX reversed off its resistance at 2956.1 where it could potentially drop further to 2723.5.
Disclaimer:
Trading CFDs on margin carries high risk.
Losses can exceed the initial investment so please ensure you fully
understand the risks.
SPX reversed from resistance, potential drop!SPX reversed off its resistance at 2956.1 where it could potentially drop further to 2723.5.
Disclaimer:
Trading CFDs on margin carries high risk.
Losses can exceed the initial investment so please ensure you fully
understand the risks.

SPX Next Target 3050-3100Similar pullback pattern developing which should take the $SPX to new ATH in the coming weeks. As long as the long term technicals remain bullish, then buying pullbacks is in order. Trade war talk is just that. Lots of bears on this case but SPX only dropping 3% on such news doesn't resemble a bearish omen so far. Looking to take longs via ES futures shortly. PT = 3050-3100 range.

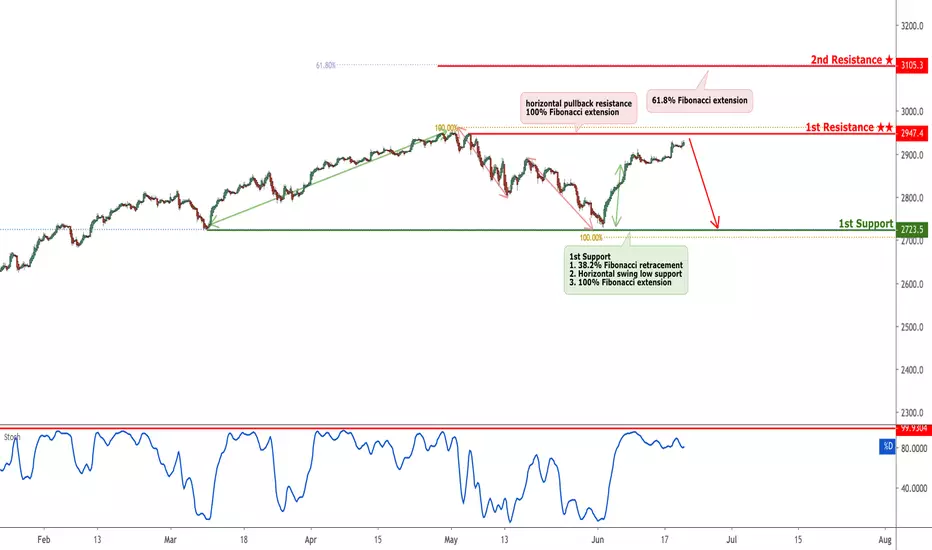
SPX approaching resistance, look out for a potential reversalSPX is approaching its resistance at 2947.4 where it is could reverse down to its support at 2723.5.
Trading CFDs on margin carries high risk.
Losses can exceed the initial investment so please ensure you fully
understand the risks.