Tracking of the Trading Plans Published In the MorningThe chart shows how our A.I. Powered Model Trades tracked the S&P 500 Index today. For detailed results of hypothetical trades based on these trading levels, check back after 7pm ET at tradersaiDotCom.
Spx500long

SPY ES1! SPX Still Bullish, Pause before higherThe weekly SPY chart continues to look positive.
I circled areas where strong bounce weeks ended up failing and reversing to new lows.
But IMO, those reversals came with poor technicals (MACD trending down and/or negative) and showed big red candles right away. Now, we're seeing different action - MACD is turning up now and last week was flattish, closing at support. Stay long

Interest Rates, Range Consolidation to dominate the marketsWith the markets hoping for a cut, the stakes are high on how the Fed is going to balance whatever stand they take this week.
The chart shows our A.I. powered models' trading plans for the day! For details, please read the published outlook at tradersaiDotCom
Good luck with your trading today!

TRADERSAI - A.I. Driven Model Trades for FRI 06/14Earnings and Economic Headlines to begin to Replace Geopolitical Concerns?
No market-moving geopolitical news overnight and that might be allowing the markets to focus on economic and earnings related headlines. Chip stocks' earnings concerns (read, Broadcom's), China's weak economic numbers, IEA's oil demand outlook, and Gold's rise...these are likely to consume investors' sentiments today, heading into the weekend.
Detailed trading plans at TradersAIdotCom under S&P OUTLOOK for FRI 06/14

A.I. Powered SPX Trading Levels for THU 06/13Choppiness Driven by Geopolitical Headlines
Our models continue to indicate consolidation of the recent steep gains with narrow, range-bound trading to dominate. Visit our site for specific trading plans.
#ES #SP500 #SPX #SPY


A.I. Driven SPX Model Trades for Wed 06/12This Morning's "No Inflation, No Problems" (Good) News Bad for the Markets?
The CPI release this morning points to no concerns about inflation or the health of the economy. While this is good for the common man, and the general well being of the economy, the equity market players could take this as a bit disappointing to their hopes of an imminent Fed rate cut.
Our models indicate chances for stalling in the markets today while the recent steep gains consolidate. They indicate the following trading plans for the regular session of the S&P 500: SP:SPX


SPX Approaching Resistance, Prepare For A Reversal
SPX is approaching its resistance at 2900.7(61.8% Fibonacci extension , 61.8% Fibonacci retracement , horizontal swing high resistance) where it is expected to reverse down to its support at 2723.5(38.2% Fibonacci retracement , 100% Fibonacci extension , horizontal swing low
support).

BUY S&P500Bullish signal was confirmed. Entered at open. Let's see how the bulls deal with the bears on this rebound aiming to at least test all time highs.

A.I. Driven Trading Plans for 20190607 - Medium Freq ModelsNew to Trading View here - trying to experiment how our daily Trading Plans can be published for the community here, in a Pine Editor script. Looking forward to hearing back comments, suggestions, ideas on how best to do this. Thanks!
TradersAI
"Powered by Artificial Intelligence
Driven by Human Wisdom"

Updated SPX Short termFed Chairman Powell sent the market higher. If June 19th comes and there is no rate cut, I expect a big selloff
Short from 2900

SPY SPX Bullish Breakout ConfirmedIts not an ideal set-up, but its still a breakout with multiple levels of support below.
Bottom line, we have a downtrend breakout and some technical confirmation. Again, its not a slam dunk.
But my gut tells me sentiment got overly bearish, so there is fuel for a rally. And we have a whole lot of support levels all the way down to $277 SPY to hold a sell-off - trendline, 100-day moving average, 200-day.
On the upside, clear sailing at least to $287. Probably higher


SPX500 will be bullish for the rest of the week? 6 May 19A very nice morning star formation. With market participants expecting the Chair of Federal Reserve reducing interest rate in the near future, we might see 2879 by the end of this month. This is a trend continuation trade.
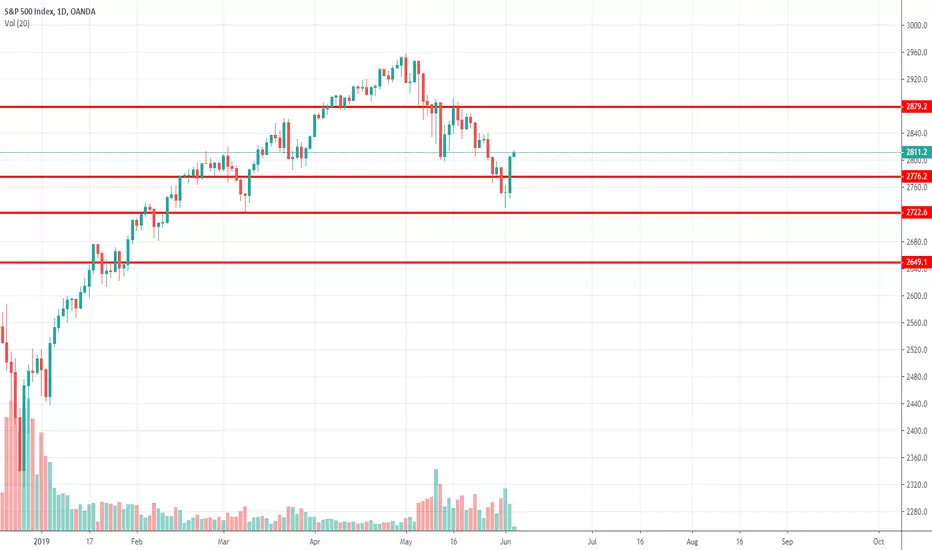
SPX Approaching Support, Prepare For A Bounce
SPX is approaching its support at 2723.5 (38.2% Fibonacci retracement, horizontal swing low support,61.8% Fibonacci extension) where it could potentially bounce to its resistance at 2809.9(61.8% &161.8%Fibonacci extension).
Stochastic (89, 5, 3) is approaching its support where a corresponding bounce could occur.
