Some stocks do +1,650% verticals while the rest of market dropsNot all stocks follow overall market direction, just 80% of them. NASDAQ:AREB wasn't one of them.
We focus on the other 20% which are having massive verticals no matter the overall market or economy situation.
TOTAL Week: +121.4% realized profit from alerts posted in chat 💯
To good to be true?
Been doing it for 20+ years.
When should one beat the market with perfected strategy if not after 2 decades and nearly 100k hours invested?
Ever heard of 10,000 hours invested to master something.
Then what does 100k make you?
Master Jedi?
Sure feels like it if your 2 stocks are doing +70% +300% in a day while the world is crashing 🤷🏻♂️
All fully verified with timestamps, feel free to check and verify.
SPDR S&P 500 ETF (SPY)

SPX POSSIBLE RECOVERY UP TO 7000-7500first quarter wasn't bright for spx. but it can recover at moderate phase.

Using Put Options to Protect Your Stock PortfolioCME: Options on E-Mini S&P 500 Futures ( CME_MINI:ES1! )
Last week’s bloodshed of global financial market made history. Nearly all major asset classes fell into a market turmoil driven by tariffs and retaliations.
Let’s focus on the US stock market:
• Dow Jones Industrial Average dropped 7.76% in the week of March 31st to April 4th, making it the 4th worst weekly performance on record
• S&P 500 slipped 8.77%, the 4th worst week in history
• Nasdaq Composite fell 9.18%, the 2nd worst week
• Russell gave up 9.34%, the 3rd worst week
All four stock index futures were in negative territory year-to-date. On Sunday evening, E-Mini S&P 500 opened 178 points lower to 4,932, losing 17.1% YTD.
All parties ultimately come to an end. After two years of double-digit gains, the unstoppable US stock market finally cracked. As more tariffs and retaliations are expected to escalate, I am afraid that we are only seeing the beginning, rather than the end.
For stock investors, this is a good reminder of market risk, something we always talk about but seldomly pay attention to. The “return of investment” should be focusing on the repayment of your money, a safety issue. Only after that should we talk about the gain from the investment. It is a necessity to protect your portfolio to achieve long-term growth.
Trading with Options on E-Mini S&P 500 Futures
For investors with a diversified portfolio, Put Options on the E-Mini S&P 500 futures are effective and cost-efficient tools. Investors who long the stocks will lose money, should stock prices fall. Put options would gain in value, providing a hedge to the portfolio.
The following illustration shows a hypothetical example, given:
• An investor has a $250,000 portfolio holding a diversified pool of U.S. stocks
• CME E-Mini S&P 500 futures ( NYSE:ES ) have a contract size of $50 times the index value
• The June contract (ESM5) was quoting at 4,935 Sunday evening Friday, making the notional value of 1 contract $246,750, approximately equal to our portfolio value
• Assuming the portfolio moves closely in line with the S&P 500
• The investor wants to limit the loss of his portfolio to 12%. If the S&P 500 index is currently around 4950, a put option with a strike price of 4350 would roughly correspond to a 12% decline
Hedging trade illustration:
• The investor buys 1 put option on the June futures with the strike price of 4,600
• CME quote on that Put option is 223. As the contract is $50 times the index, the premium upfront for one put option contract is $11,150 (223*$50), ignoring any commissions
• The put premium is calculated as 4.46% of the $250K portfolio
If S&P drops to 4,200 (-15.15%) by the end of April:
• Without the put, the portfolio lost $37,879, assuming the same loss with the S&P
• The 4600-strike put is now 400 points in-the-money
• The investor sells the put and receives $20,000 (= 400 x 50)
• The loss of portfolio will be 37879+11150-20000 = $29,029
• With an E-mini S&P put protection to mitigate loss from the stock portfolio, the investor lost 11.6% (= 29029 / 250000), which is 3.5% lower than the S&P loss and with the preset loss limit
If S&P drops to 4,000 (-19.2%) by the end of May:
• Without the put, the portfolio lost $47,980, assuming the same loss with the S&P
• The 4850-strike put is now 600 points in-the-money
• The investor sells the put and receives $30,000 (= 600 x 50)
• The loss of portfolio will be 47980+11150-30000 = $29,130
• With an E-mini S&P put protection to mitigate loss from the stock portfolio, the investor lost 11.6% (= 29,130 / 250000)
As we can see here, when the S&P falls sharply, the investor will be able to cap his loss to 11.6%. In a “protective put” strategy, we would consider the option premium an insurance contract for owning stocks. If the index rises, the portfolio return would be lowered a little because of the premium upfront, that is, the cost of insurance. However, the protection is a lifesaver if the index falls.
Before jumping into action, the investor needs to run a correlation analysis using the daily value of the portfolio against the S&P 500 closing prices. Here is how:
• Some trading software has correlation feature built in already
• If not, pull 1-year daily portfolio balance and 1-year S&P closing prices, export them to Excel. Run correlation test with these two data series using Excel data analysis tool.
• Alternatively, we could drop the data into ChatGPT and ask AI to do the work for us.
If the correlation is greater than 50%, it means that S&P 500 is a good fit to hedge the portfolio. If it is not, we could try the correlation analysis using the other stock index closing prices, such as the Dow, the Nasdaq 100 and the Russell 2000. Then replace E-Mini S&P 500 futures with the stock index futures contract best fit the portfolio.
Happy Trading.
Disclaimers
*Trade ideas cited above are for illustration only, as an integral part of a case study to demonstrate the fundamental concepts in risk management under the market scenarios being discussed. They shall not be construed as investment recommendations or advice. Nor are they used to promote any specific products, or services.
CME Real-time Market Data help identify trading set-ups and express my market views. If you have futures in your trading portfolio, you can check out on CME Group data plans available that suit your trading needs www.tradingview.com

Weekly $SPY / $SPX Scenarios for April 7–11, 2025🔮 🔮
🌍 Market-Moving News 🌍:
🇺🇸📈 New U.S. Tariffs Begin April 9: Trump’s “Liberation Day” tariffs — 10% on all imports, 25%+ on key sectors — could stir volatility.
🇨🇳📦 China Retaliates April 10: A 34% retaliatory tariff on U.S. goods raises trade war fears and inflation concerns.
🏦💰 Big Bank Earnings Kick Off: JPMorgan, Wells Fargo, and BlackRock will report. Markets will watch closely for financial health signals.
📉📊 March CPI Report Coming April 10: Inflation data could sway the Fed’s rate path. Forecasts call for a 0.1% increase.
⚠️ Volatility Alert: Piper Sandler projects a possible 5.6% move in the S&P 500 this week — up or down.
📊 Key Data Releases 📊
📅 Monday, April 7:
🗣️ Fed Gov. Kugler Speaks (10:30 AM ET)
💳 Consumer Credit (3:00 PM ET) — Forecast: $15.5B | Prev: $18.1B
📅 Tuesday, April 8:
📈 NFIB Small Biz Optimism (6:00 AM ET) — Forecast: 100.7
🗣️ Fed’s Mary Daly Speaks (8:00 AM ET)
📅 Wednesday, April 9:
📦 Wholesale Inventories (10:00 AM ET) — Forecast: 0.4% | Prev: 0.8%
🗣️ Fed’s Barkin Speaks (11:00 AM ET)
📝 FOMC Minutes (2:00 PM ET)
📅 Thursday, April 10:
📉 Jobless Claims (8:30 AM ET) — Forecast: 219K
📊 CPI (8:30 AM ET) — Forecast: 0.1% | Prev: 0.2%
🗣️ Fed Gov. Bowman Testifies (10:00 AM ET)
📅 Friday, April 11:
🏭 PPI (8:30 AM ET) — Forecast: 0.2% | Prev: 0.0%
🗣️ Fed’s Musalem Speaks (10:00 AM ET)
⚠️ Disclaimer: This information is for educational and informational purposes only and should not be construed as financial advice. Always consult a licensed financial advisor before making investment decisions.
📌 #trading #stockmarket #economy #news #trendtao #charting #technicalanalysis

SPY w/ 2022 Fibonacci levels. The chart is the SPY with FIB levels from the 2022 bottom or close to give you an idea of where we might find support levels.

Weekly Market Forecast: Short Term Buys, Then Sells! In this video, we will analyze the S&P 500, NASDAQ, AND DOW JONES Futures for the week of April 7 - 11th.
The Stock Market Indices may find support at current levels for a Bear Market Rally. Wait for the market structure shift to the upside before taking any buys. Let the market confirm it's intended direction first, then look for valid buy setups for a short term countertrend play.
Enjoy!
May profits be upon you.
Leave any questions or comments in the comment section.
I appreciate any feedback from my viewers!
Like and/or subscribe if you want more accurate analysis.
Thank you so much!
Disclaimer:
I do not provide personal investment advice and I am not a qualified licensed investment advisor.
All information found here, including any ideas, opinions, views, predictions, forecasts, commentaries, suggestions, expressed or implied herein, are for informational, entertainment or educational purposes only and should not be construed as personal investment advice. While the information provided is believed to be accurate, it may include errors or inaccuracies.
I will not and cannot be held liable for any actions you take as a result of anything you read here.
Conduct your own due diligence, or consult a licensed financial advisor or broker before making any and all investment decisions. Any investments, trades, speculations, or decisions made on the basis of any information found on this channel, expressed or implied herein, are committed at your own risk, financial or otherwise.

3-MONTH THE SQUID GAME II 'JUBILEE'. WHAT IS NOW & WHAT IS NEXTIt's gone three months or so... (Duh..? WTF.. 3 months, really? 😸😸😸) since "The Squid Game" Season II has been released on December 26, 2024.
Nearly month later comrade Trump entered The White House (again).
Still, everyone was on a rush, chatting endless "Blah-Blah-Blah", "I-crypto-czar", "crypto-capital-of-the-world", "we-robot", "mambo-jumbo", "super-duper", AI, VR and so on hyped bullsh#t.
Here's a short educational breakdown, what we think about all of that, at our beloved @PandorraResearch Team.
Trading can easily resemble gambling when approached without discipline, strategy, or proper risk management. Here are key reasons to avoid gambling-like trading behaviors, supported by real-world examples:
1. Lack of Strategy and Emotional Decision-Making
Trading becomes gambling when decisions are based on emotions, intuition, or market hype rather than thorough analysis. For instance, Geraldine lost £15,000 on a spread-betting platform after attending a workshop that taught ineffective strategies. She believed the platform profited from her losses, highlighting how impulsive, uneducated decisions can lead to significant financial harm. Similarly, traders who overtrade or ignore risk management often experience devastating losses, as they rely on luck rather than a structured plan.
2. Overleveraging and One-Sided Bets
Overleveraging—opening excessively large positions—is a common gambling behavior in trading. This approach increases stress and the likelihood of substantial losses. A trader who lost $400,000 on a single Robinhood bet exemplifies this. He overinvested in a call option, hoping for a quick profit, but the trade turned against him, wiping out nearly all his capital. Opening one-sided bets or adding to losing positions further compounds risks, as traders attempt to recover losses through increasingly risky moves.
3. Ignoring Stop Losses and Risk Management
Failing to set stop losses or refusing to exit losing trades is another form of gambling. Traders who cling to their biases and avoid cutting losses often face irreversible damage to their portfolios. For example, many traders refuse to take stop losses, leading to catastrophic losses that erode their confidence and capital. This behavior mirrors the destructive cycle of gambling addiction, where individuals chase losses in hopes of a turnaround.
4. Psychological and Financial Consequences
Gambling-like trading can lead to severe psychological and financial consequences. Harry, a trader with a gambling addiction, repeatedly lost money despite asking his trading platform to restrict his account. His inability to control his trading behavior highlights the addictive nature of high-risk trading and its potential to ruin lives. Similarly, excessive gambling has been linked to increased debt, bankruptcy, and mental health issues, such as anxiety and depression.
5. Long-Term Sustainability
Smart trading focuses on steady gains and minimal losses, whereas gambling relies on luck and high-risk bets. Traders who chase big wins often lose their profits in subsequent trades, perpetuating a cycle of losses. Studies show that frequent trading, driven by overconfidence or problem gambling, reduces investment returns and increases financial instability.
In conclusion, avoiding gambling-like trading requires discipline, education, and a well-defined strategy. Real-world examples demonstrate the dangers of emotional decision-making, overleveraging, and ignoring risk management. By adopting a structured approach and prioritizing long-term sustainability, traders can mitigate risks and avoid the pitfalls of gambling.
--
Best 'squid' wishes,
@PandorraResearch Team

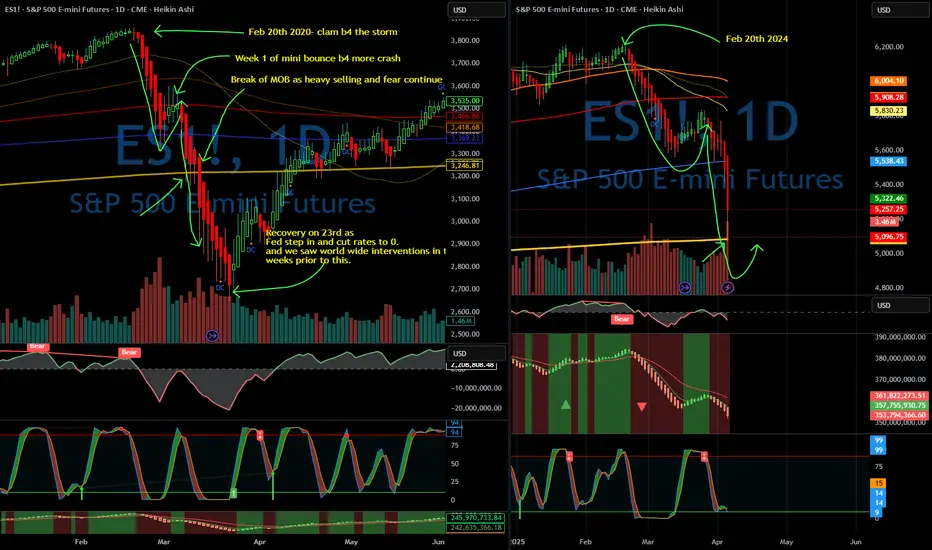
Are We Witnessing a Black Swan Event?I’ve spent most of the day digging through charts and studying past crashes — because what we’re living through right now might be a once-in-a-decade opportunity.
This current market crash feels eerily close to a black swan event.
No one really expected Trump to push tariffs this far, and the consequences are already rippling through global markets. If this escalates into true economic isolation, the effects could be both tremendous and long-lasting.
That said, there’s another possibility:
This might just be a blip in history — a bold negotiating tactic that works out, shocks the system temporarily, and fades away.
There’s even speculation this could mirror the 1989 crash, with some analysts warning of a potential 20% drop by Monday.
If that happens, I’d rather not be frozen by fear. I want to act with intention. I want my plan in place and my orders ready.
Before I share stock ideas I believe can outperform in the long run…
Let’s first walk through what I believe might be playing out — at least for now. (Keep in mind, these theses can change fast.)
Before the crash, it looked like a replay of 2022:
Markets were clearly overvalued and due for a correction — back then, it was driven by regional bank failures, and the Fed quickly stepped in to stabilize things.
But now, selling pressure is accelerating.
This looks less like 2022 and more like 2020 — where markets broke down in response to a larger, fast-moving, global crisis.
Even though we’re seeing similarities, things can shift very quickly.
We still haven’t seen key reversal signs — like a Doji candle — and more importantly, there’s been no intervention yet from the government or global forces.
Until that happens, panic may continue to snowball.
And as we know from history, panic doesn’t operate on logic.
Source:
📚 2020 Stock Market Crash en.wikipedia.org
Reversal soonAs you can see we've nearly completed the same amount of distance as the covid crash. With resistance provided by the ichimoku cloud and previous price level. Full recovery by August.

Is Stock Market Bouncing Here or Continue Crashing?Stock Market Analysis | NASDAQ:QQQ & AMEX:SPY
Mag 7 Analysis | NASDAQ:TSLA NASDAQ:NVDA AAPL AMZN MSFT GOOGL META

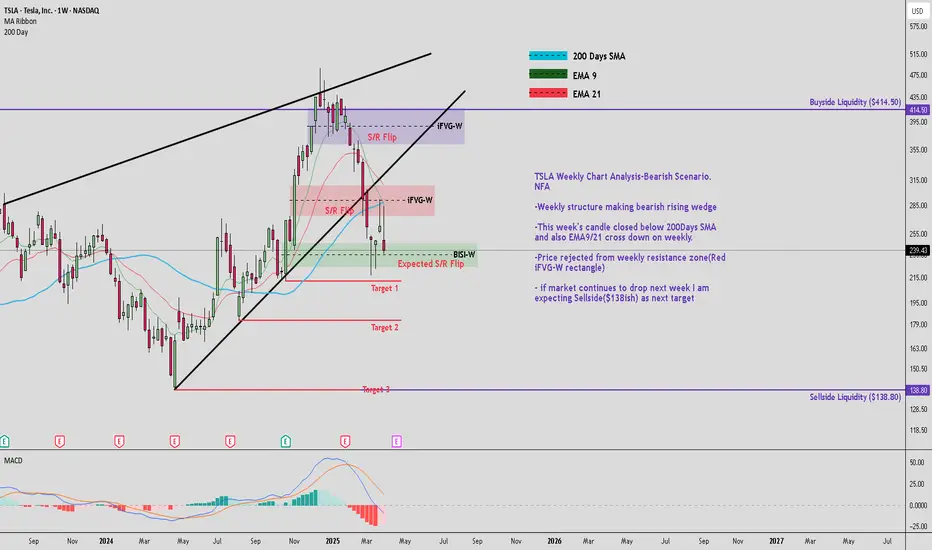
TSLA Weekly Chart Analysis-Bearish Scenario. NFATSLA Weekly Chart Analysis-Bearish Scenario. NFA
-Weekly structure making bearish rising wedge
-This week's candle closed below 200Days SMA and also EMA9/21 cross down on weekly.
-Price rejected from weekly resistance zone(Red iFVG-W rectangle)
- if market continues to drop next week I am expecting Sellside($138ish) as next target
WOW Two +2,000% stocks during crash week? $ICCT and $AREBNASDAQ:ICCT from $0.33 to $7.60 🚀
NASDAQ:AREB from $1.15 to $22.80 🚀
🚨 7 Buy Alerts sent out on ICCT this week, first two at $0.75! Wrote and posted about them continually through the week
14 Trades made total this week
12 Wins ✅
2 Losses ❌
TOTAL Week: +121.4% realized profit 💯
Not counting CBOE:UVXY swing pick buy alert at $21.65 reaching $41+ also posted many times in trading view chats
Monday: +46.2%
Tuesday: +17.7%
Wednesday: +34.1%
Thursday: +14.4%
Friday: +9.0%
Total March: +358.0% awesome month thanks to many big movers triggering. The overall market turn is helping bring more volume to our type of stocks which showed nicely with AREB, normally when you see a stock like that do $4 to $20 in a day and drop to $10 it's over, but with all green-hungry traders out there they bought it right back up to new highs bove $20 again. Expect more of such power next week.
All of trade alerts fully verified with timestamps in chat ✅

$SPY obvious? Can we believe it?All from standpoint’s of chart, politics, consumerism, fear, uncertainty, and ego, this shows all signs to $455-$470, right? It would only be a 23% decline off the highs which were trading 6 weeks ago, lol.
WSL.

Combined US Indexes - Lower High Lower Low checked; What next...As previously expected, a lower low has been achieved.
What was not expected was the speed, magnitude and extent of the fallout.
Next up, since it is about 3.5 Standard Deviations out, we can start looking for a consolidation, although there might be slightly more downside and we need a higher low in the expected range within box. Having said that, it is possible to see it overextend downwards briefly.
There is a long term support, Fibonacci downside target zone just below.
So expecting a short term bounce between Monday to Wednesday at the earliest, and following that a consolidation area formation.

Geopolitics, Rates, and Risk: Why 1987 Is Back on the RadarThe current mix of geopolitical tensions, policy uncertainty, and fragile market sentiment brings to mind the setup ahead of October '87.
Without stabilizing signal, especially from the U.S. administration this weekend, the risk of a sharp correction is not negligible.

SPY: Breaking Levels; TASPY broke down the Weekly demand line and now looking to break the Monthly demand.
Looking to possibly test the bottome weekly trendline.
Possibly a 530 price target and if weakness continues, possibly below more to 520 then 510.46 to fully retest that bottom trendline.
The market has bene crazy, people calling bottom, wanting to catch the reversal. I mean, I would want to catch this “V” up too, but have to see if it keeps trending down to the bottom trendline.
LMK what you think and if you have any TA, tag me!
*Not FA

Post-Liberation Day Sell-Off – Crash or Correction?Liberation Day has turned into a dramatic "blow the markets back out" day for the SPY , with a significant daily drop of nearly 6%, slicing decisively below the critical 200-day moving average at $574.46. Historically, breaking below the 200-day MA is a strong bearish signal, indicating potential further downside momentum.
The previously identified key bearish pivot, the "Best Price Short" at $565.16, served as a crucial resistance level from which sellers aggressively stepped in, intensifying today's sell-off. Given the current bearish sentiment, the next immediate downside targets without a significant bounce (dead-cat bounce) include:
Half 1 Short (Momentum target): $505.28 (already tested)
High Vol Momentum Target 1a: $497.66
Half 2 Short (secondary bearish momentum): $486.41
Extended Momentum Target (HH Vol Momo Target 2a): $475.16
For traders who missed the initial move, look to re-enter shorts if there's a modest retracement toward the previously broken "Weeks High Short" at $520.16, maintaining tight risk control with stops ideally set just above the "Best Price Short" ($565.16).
Critical levels summary:
Ideal Short Re-entry Zone: $520.16
Profit Targets: $497.66, $486.41, and ultimate $475.16
Stop Loss Area: Slightly above $565.16
Major Broken Support (Resistance now): 200-day MA at $574.46
Today's significant volume spike further reinforces bearish conviction. RSI is deeply oversold at 23.24, suggesting caution for potential short-term bounce, but any bounce is likely to be short-lived unless there's a substantial political or economic pivot soon.
These levels are algorithmically defined, designed to remove emotions from trading. Trade responsibly, adhere to your strategy, and protect your capital.

04/04 aka Doomsday Daily Trade RecapEOD accountability report: +$725
Sleep: 6 hour, Overall health: rly bad
**Daily Trade Recap based on VX Algo System **
9:49 AM Market Structure flipped bearish on VX Algo X3!
11:00 AM VXAlgo NQ 10M Buy Signal (triple buy signal)
1:02 PM VXAlgo ES 10M Buy signal,
1:25 PM VXAlgo ES 10M Buy signal,
Another wild day, market went extremely bearish and has been rejecting the 1 min resistance and playing out as expected.

S&P 500 to tank to 5,100 pointsPEPPERSTONE:US500
The S&P 500 broke below critical support after Trump announce massive tariffs on everyone, worst than expected. Volume is increasing to the downside, and it looks like the next wave down has already started.
Wave C is supposed to be equal or larger than wave A, and reach the next critical support, which will lead us to 5,100 points in the next couple of weeks.
I heard that net tariffs on China are 54%, does than means that iPhones are going to rise in price 54%?
Maybe it will be reconsidered later, and the market will bounce in the future, but not likely in the short term.
Good luck to you

Tariff FUD is reking ports. SPY 505 First Stop. 460 Second.Trading Fam,
It's no surprise that Trump's implementation of high tariffs would cause initial FUD. This can be observed in the massive spikes on the $VIX. What is unknown and has caught many traders by surprise, myself included, is how substantial of a drop would be incurred by investor uncertainty.
Initially, it did appear that 500 might hold. That was a huge support. I knew if it broke, the sell-off would be deep. But I held hope that the market would hold above this trendline. It did not. So, yesterday and today, investors who held are incurring substantial losses.
For those who were smarter than me and sold at or near the top, congratulations! You've saved yourself some duress and cash. Now, some are calling this the beginning of a longer bear market. I still don't see it that way. Honestly (and I know this will be hard to believe), I still see the SPY hitting my target #3 at 670-700 before 2026 comes to an end. Longer-term we still remain in a massive secular bull market since 2009 and to break this long-term trend, the SPY would actually have to break below 300. That is a long way down and I just don't see that happening, though as always, I definitely could be wrong.
Shorter-term I am seeing two prominent areas of support. The first has almost been reached at 505. If I would have played this correctly, I'd be DCA'ing in my first load of cash here. The second area of support is at around 460 and slightly rising daily. This would be where I DCA'ed in another load of cash. However, if that broke, I'd exit immediately and reassess the charts. 300 is a long way down, but over the past 5 years we have seen some extraordinary market price action and volatility. TBH, even the best of us technicians are struggling to understand the larger macro-economic picture, but I'd wager to say that tariff fears may be overexaggerated as market reactions often tend to be.
One interesting note is that crypto price action no longer seems to correlate and prices have help up surprisingly well. Could this be our first indicator that the markets are due to turn up again in a few weeks/months? Unknown. But I can promise you I'll be watching this all closely.
✌️Stew

Markets hate tariffs but traders love discounts
SPX500 is down over 12.2% YTD
Volatility Index (VIX) is above 40 — elevated fear in the market
SPX support zone likely around 4,888
Historical patterns show strong rebounds near similar volatility spikes
This could be a prime entry point — keep your cash ready
With tariffs back in play, volatility could spike — stay ready for discounted entries

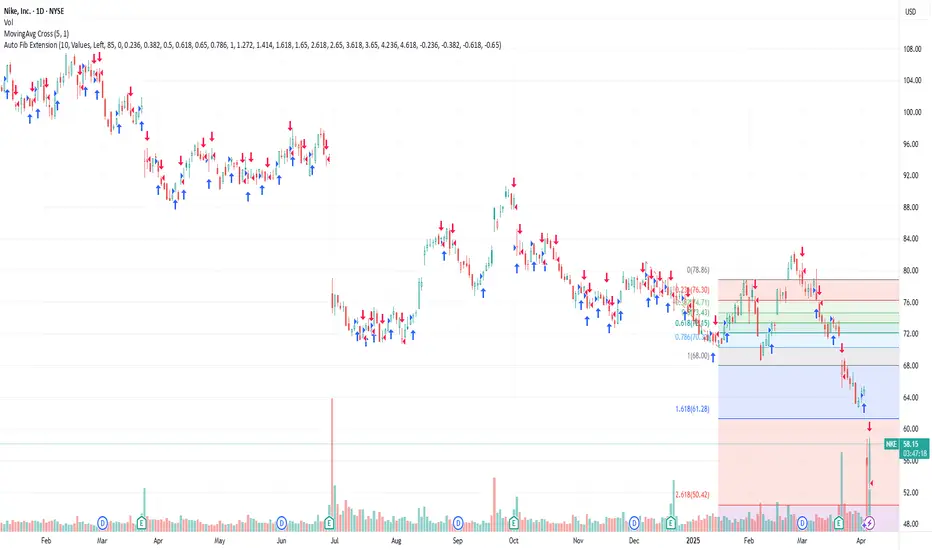
If you own a pair or NIKE! then this is your time #Shareholder Confessions from the Desk: Kim K Didn’t Move Nike, But Let’s Be Real…
So, it turns out Kim K’s magic touch didn’t send Nike stock into orbit. Shocking, I know. Apparently, even the queen of shapewear can’t single-handedly inflate a multi-billion-dollar company’s share price.
But let’s take a step back—because at this price, Nike is looking very interesting.
Forget the short-term noise. Nike is still the #1 IT gear for young adults and Generation Chic. You know, the people actually setting trends and spending money:
#Rappers – Because what’s a flex without fresh kicks?
#Tech bros – Coded an app? Great. Now go drop $200 on some sneakers.
#Creatives – The artists, designers, and influencers making sure you think about buying Nikes even when you’re not.
At the end of the day, Nike isn’t just a brand—it’s a lifestyle, a uniform, a status symbol. Stocks go up and down, but when it comes to culture, Nike runs the game.
So yeah, maybe the Kim K collab didn’t ignite a moonshot. But give it time. The streets, the startups, and the studios are still rocking the Swoosh. And that’s why I’m watching.
+10% from tomorrow till mid-MaySPX is getting ready to rebound with around 10% till mid-May. Invalidated if breaks below 5400.
