INVERSE CUP AND HANDLE $TSLA TO $120 The inverted cup and handle, also known as the upside-down cup and handle pattern, is a bearish chart formation that can occur in both uptrends and downtrends. Unlike the traditional bullish cup and handle pattern, this inverse pattern features two key components: the "cup," which forms an inverted U-shape, and the "handle," a brief upward retracement following the cup.
Sell NASDAQ:TSLA right now with fact check:
brand reputation risk, high competition, loss of EV market leadership, cyber truck/ product recalls, declining sales with lower margin, stock volatility concern, insider selling, investors buy it based on expected future earnings rather than its current profitability.
+ Head and shoulder/ inverse cup and handle, P/E ratio 79.8-161.23 (overpriced), falling knife, dead cat bounce, the lowest target estimate stands at $120.00, below the 50-day, 100-day, and 200-day moving averages, MACD indicator is -19.8, bearish signals.
+ potential stagflation, tariff war, slow economic growth, inflation, rising public debt, geopolitical tensions, ai bubble, and more
SPDR S&P 500 ETF (SPY)

SPY/QQQ Plan Your Trade For 3-31 : Carryover PatternToday's pattern suggests the SPY/QQQ will attempt to carryover Friday's selling trend.
I do believe the SPY/QQQ will attempt to find some support as we move into a Temp Bottom pattern tomorrow. So be aware that the SPY/QQQ may attempt to find support near 535-540/450-455 over the next few days.
I would also urge traders to not get very aggressive in terms of trying to pick a bottom in this downtrend.
In my opinion, I don't see any reason why anyone should be buying into this breakdown unless you are prepared to take a few big lumps. Just wait it out - wait for a base/bottom to setup.
Gold and Silver are moving higher and I believe this trend will continue for many weeks/months.
BTCUSD should continue to move downward - trying to establish the Consolidation Phase range.
As we move into trading this week. Be aware that Tuesday/Wednesday of this week are more ROTATION type days. They may be wide-range days - but they are still going to be ROTATIONAL.
Get some.
#trading #research #investing #tradingalgos #tradingsignals #cycles #fibonacci #elliotwave #modelingsystems #stocks #bitcoin #btcusd #cryptos #spy #gold #nq #investing #trading #spytrading #spymarket #tradingmarket #stockmarket #silver

Bear Hedge Trigger Hit - It’s Risk-Off This WeekBear Hedge Trigger Hit - It’s Risk-Off This Week | SPX Analysis 31 Mar 2025
Well, it’s officially the start of a new week... and the end of the month. A time when markets often go a bit boing-boing as portfolio managers do their monthly “window dressing.” But let’s not get distracted by the glitter - Friday’s price action just ripped the rug out from under the bulls.
My SPX slippers barely had time to get comfy before I was forced to swap them for spiked bear boots. Again.
Friday’s break through my bear hedge trigger flipped the script, and now I’m locked into bear mode until the charts convince me otherwise. And right now? They’re not even trying.
---
Bear Flag Breakdown: What the Charts Are Screaming 🐻
Let’s break it down trader-to-trader...
Friday’s move confirmed the break of a textbook bear flag.
My target for this bear swing now sits at 5140, and unless we break above 5700, the bear case remains fully intact.
Short-term? I'm bearish through 5500, watching 5555 as a gamma inflection point which could accelerate the bear move.
Here’s what makes this particularly spicy:
Overnight futures are down nearly 1% - not the Monday morning bounce you’d expect if bulls were in charge.
GEX is stacked with puts - if we breach 5555, market makers may accelerate the drop by hedging and reducing positive gamma exposure.
Momentum is gaining. And it feels like we’ve seen this film before...
🎞️ Rewind to 2022…
Remember that slow grind lower in 2022 where every bounce got sold, and traders kept trying to “buy the dip” only to get steamrolled?
Yeah. This move is shaping up the same way.
A pattern break. A bearish continuation. And if we follow the 2022 script... buckle up. The bears may just be getting started, and the rest of the year could get nasty.
---
Expert Insights: Avoid These Bear Market Mistakes
🔻 Mistake #1: Trading What You Hope Will Happen
Stop “buying the dip” because you want it to bounce. Trade what’s in front of you.
🔻 Mistake #2: Using the Wrong System for This Environment
Bullish systems don’t work in bear trends. You need a mechanical system that thrives on volatility (like mine).
---
Fun Fact
In 2018, the S&P 500 plunged nearly 20% in December alone, marking one of the worst year-end sell-offs in history. The culprit? A mix of Fed tightening and market-wide panic.
🧐 Fast forward to today… and while the catalyst may differ, market structure patterns have a funny way of rhyming, don’t they?

SPY divergenceI see a lot of divergence in the SPY.
Looks like a push into trend-line support for me then we add tier 3 buys.

$KRE CRASH COMING ... Not yet tho..we'll find out..Regional Banks seem to be heading on a slippery path identical to the most previous crash pattern back when they needed all the loan Bailouts. Now that all the loans have stopped, I'm sure some banks may be heading towards loan restructuring perhaps, maybe defaults, I'm not sure honestly. I just know that the chart never lies and I've been watching and waiting for a long while. I predicted the first crash back then and I currently have no doubts with the current chart ahead of me. As always, I will do my best to provide the best insight possible into these speculations. Currently we have the Daily breaking trend and the bar count getting close to the previous 141 bars. The only difference is that we bounce off the 100% retracement. If we continue to lose the 1.27, we'll be headed for the 1.61..... updates soon.

SPY: SPY looking a bit like scary hour? Continuous tariff new’s scaring the market. Many continue to say Bearish then some say Bullish.
Looking like it can retest the demand zone I see at the 1M at 584.83 but today 3/30 on AH looks like things may be gapping down already.
What are your thoughts?

Weekly $SPY / $SPX Scenarios for March 31 – April 4, 2025🔮 🔮
🌍 Market-Moving News 🌍:
🇺🇸📈 Anticipated U.S. Jobs Report: The March employment data, set for release on Friday, April 4, is expected to show a slowdown in job growth, with forecasts predicting an increase of 140,000 nonfarm payrolls, down from 151,000 in February. The unemployment rate is projected to remain steady at 4.1%. This report will be closely monitored for signs of economic momentum and potential impacts on Federal Reserve policy.
🇺🇸💼 President Trump's Tariff Announcement: President Donald Trump is scheduled to unveil his "reciprocal tariffs" plan on Wednesday, April 2, dubbed "Liberation Day." The announcement is anticipated to include a 25% duty on imported vehicles, which could significantly impact the automotive industry and broader market sentiment. Investors are bracing for potential volatility in response to these trade policy developments.
🇺🇸📊 Manufacturing and Services Sector Updates: Key indicators for the manufacturing and services sectors are due this week. The ISM Manufacturing PMI, scheduled for Tuesday, April 1, is expected to show a slight contraction with a forecast of 49.5%, down from 50.3% in February. The ISM Services PMI, set for release on Thursday, April 3, is projected at 53.0%, indicating continued expansion but at a slower pace. These reports will provide insights into the health of these critical sectors.
MarketWatch
📊 Key Data Releases 📊
📅 Monday, March 31:
🏭 Chicago Business Barometer (PMI) (9:45 AM ET):
Forecast: 45.5
Previous: 43.6
Measures business conditions in the Chicago area, with readings below 50 indicating contraction.
📅 Tuesday, April 1:
🏗️ Construction Spending (10:00 AM ET):
Forecast: 0.3%
Previous: -0.2%
Indicates the total amount spent on construction projects, reflecting trends in the construction industry.
📄 Job Openings (10:00 AM ET):
Forecast: 7.7 million
Previous: 7.7 million
Provides insight into labor demand by measuring the number of job vacancies.
📅 Wednesday, April 2:
🏭 Factory Orders (10:00 AM ET):
Forecast: 0.6%
Previous: 1.7%
Reflects the dollar level of new orders for both durable and non-durable goods, indicating manufacturing demand.
📅 Thursday, April 3:
📉 Initial Jobless Claims (8:30 AM ET):
Forecast: 226,000
Previous: 224,000
Measures the number of individuals filing for unemployment benefits for the first time, providing insight into labor market conditions.
📊 Trade Balance (8:30 AM ET):
Forecast: -$123.0 billion
Previous: -$131.4 billion
Indicates the difference between exports and imports of goods and services, reflecting the nation's trade activity.
📅 Friday, April 4:
💵 Average Hourly Earnings (8:30 AM ET):
Forecast: 0.3%
Previous: 0.3%
Measures the change in earnings per hour for workers, indicating wage inflation.
⚠️ Disclaimer: This information is for educational and informational purposes only and should not be construed as financial advice. Always consult with a professional financial advisor before making investment decisions.
📌 #trading #stockmarket #economy #news #trendtao #charting #technicalanalysis

The Greatest Opportunity of Your Life : Answering QuestionsThis video is an answer to Luck264's question about potential price rotation.
I go into much more details because I want to highlight the need to keep price action in perspective related to overall (broader) and more immediate (shorter-term) trends.
Additionally, I try to highlight what I've been trying to tell all of you over the past 3+ years...
The next 3-%+ years are the GREATEST OPPORTUNITY OF YOUR LIFE.
You can't even imagine the potential for gains unless I try to draw it out for you. So, here you go.
This video highlights why price is the ultimate indicator and why my research/data is superior to many other types of analysis.
My data is factual, process-based, and results in A or B outcomes.
I don't mess around with too many indicators because I find them confusing at times.
Price tells me everything I need to know - learn what I do to improve your trading.
Hope you enjoy this video.
Get Some.
#trading #research #investing #tradingalgos #tradingsignals #cycles #fibonacci #elliotwave #modelingsystems #stocks #bitcoin #btcusd #cryptos #spy #gold #nq #investing #trading #spytrading #spymarket #tradingmarket #stockmarket #silver

SPY: Bulls Will Push
The price of SPY will most likely increase soon enough, due to the demand beginning to exceed supply which we can see by looking at the chart of the pair.
Disclosure: I am part of Trade Nation's Influencer program and receive a monthly fee for using their TradingView charts in my analysis.
❤️ Please, support our work with like & comment! ❤️
SPY Price Projection: Mid-2025 TargetRevealing Market Trends: Logarithmic Regression Analysis Indicates Bullish Path for SPY
In the ever-evolving realm of financial analysis, the search for reliable predictions remains ongoing. Logarithmic scale regression analysis, coupled with potent indicators, has emerged as a promising tool for discerning trends, particularly regarding assets like the SPY.
This analysis delves into the utilization of logarithmic scale regression alongside two robust indicators, offering insights into the potential trajectory of the SPY's price movement. It's essential to note that the interpretations and predictions presented are based on my analysis alone and should not be construed as financial advice. As with any market analysis, uncertainties persist, and actual outcomes may diverge from projections.
Logarithmic scale regression accounts for the exponential nature of price movements, providing a nuanced perspective on long-term trends. When combined with indicators such as moving averages or momentum oscillators, the analysis gains depth, revealing not only the direction but also the strength of the trend.
After meticulous examination of historical data and the application of analytical tools, our analysis suggests a bullish trajectory for the SPY, with a projected price nearing 620 EUR by mid-2025. This projection implies a significant uptrend from the current date, with a potential increase of approximately 20% over the specified timeframe.
However, it's crucial to approach such forecasts with caution, recognizing the inherent risks associated with financial markets. While our analysis indicates a positive outlook, market conditions can change rapidly, leading to deviations from expected trends.
In summary, logarithmic scale regression analysis, supported by robust indicators, offers valuable insights into market trends and potential price movements. While our analysis suggests a bullish sentiment for the SPY, investors should conduct thorough research and seek professional advice before making investment decisions.
Disclaimer: The analysis provided is based on personal interpretation and should not be considered financial advice. Investing in financial markets carries risks, and actual outcomes may differ. Readers are encouraged to conduct their own research and consult with financial professionals before making investment decisions.

Is Stock Market Going to Crash?Stock Market Analysis | NASDAQ:QQQ AMEX:SPY
Mag 7 Price Forecast | NASDAQ:TSLA NASDAQ:NVDA AAPL AMZN META MSFT GOOGL

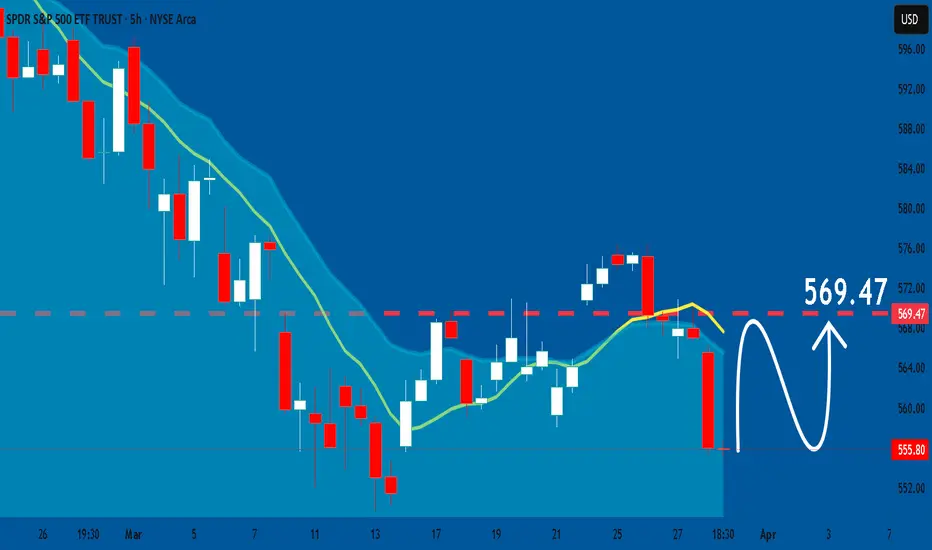
SPY Set To Grow! BUY!
My dear friends,
SPY looks like it will make a good move, and here are the details:
The market is trading on 555.80 pivot level.
Bias - Bullish
Technical Indicators: Supper Trend generates a clear long signal while Pivot Point HL is currently determining the overall Bullish trend of the market.
Goal - 569.99
Recommended Stop Loss - 549.79
About Used Indicators:
Pivot points are a great way to identify areas of support and resistance, but they work best when combined with other kinds of technical analysis
Disclosure: I am part of Trade Nation's Influencer program and receive a monthly fee for using their TradingView charts in my analysis.
———————————
WISH YOU ALL LUCK

SPY is still on thin iceA month back I wouldn't have believed this post though I did expect 10% correction and exited my major position at the top. I post this as pure academic purpose and my own record. I find volume profile the most important tool in technical analysis. Whatever I present here is an educated guess and not pure speculation. Before doing the profile I did a VP study on major stocks, since VP shows more clarity on the stocks
Based on Volume profile the sellers will have little resistance breaking through thin ice zone. We could still be looking at 514 easily. Then it starts facing some resistance
Market is still breaking through bubble territory. The reason I call bubble territory is because the volume became significantly lower after May 24. Most of the large investors and funds had bought their major holding by then. If fact based on news Warren Buffet and Michael Burry started selling USA market in August and kept selling till end of Dec. WB sold his entire holding of American express, one of his favourite company Berkshire was holding largest cash balance in is history by Dec. Smart guy. So I just followed him. Then I ask If these heavy weights are selling will they back after 10% correction? No way, they would wait for at least 20% or more markdown
This give me confidence in my analysis and economic environment supports that too
The market will quick fall through low volume region or imbalances. These act like magnets for the price and stop or pause for a breath at High volume nodes and even bounce back to take back some the low volume nodes. These can create a flag structure. This what happened when the market bounced back from 5500 to 5790 and reversed again. I correctly said in a previous post it was a bear flag
When the market is euphoric and in FOMO stage it will leave lots of volume gaps which attracts the market back to those levels

Daily Trade Recap based on VX Algo SystemEOD accountability report: +$537.50
Sleep: 8 hour, Overall health: Energized
As mentioned in our trade recap video yesterday, today was suppose to be really bearish and go down more,
However, the inflation report ended up being really bad and that just crashed the market all day.
I was expecting to see some bounces here and there along the way but it was just straight drill with no buyers in sight.
Daily Trade Recap based on VX Algo System
8:24 AM Market Structure flipped bearish on VX Algo X3! Look to STR at 1 min MOB or resistance.
11:10 AM VXAlgo NQ 10M Buy Signal
3:36 PM VXAlgo NQ 48M Buy Signal

SPY/QQQ Plan Your Trade For 3-28-25 EOD Review : Brutal SellingI sure hope all of you were able to profit from this big selling trend today.
And I also hope you didn't get trapped in the potential for a base/bottom rally off the recent lows.
This move downward reminds me of the 2022-2023 downward trending pattern when the Fed was raising rates.
What Trump is doing with tariffs is very similar. It is slowing the economy in a way that will not break it - but it will result in slower, more costly, economic function.
Watch this video and I sure hope all of you have great (profitable) stories to share with me today.
I know I do. And, I'm positioned for the weekend. Ready to profit no matter what the markets do.
Get some.
#trading #research #investing #tradingalgos #tradingsignals #cycles #fibonacci #elliotwave #modelingsystems #stocks #bitcoin #btcusd #cryptos #spy #gold #nq #investing #trading #spytrading #spymarket #tradingmarket #stockmarket #silver

SPY Bearish wave count The only one !The chart posted is that of the spy updated for the bearish wave structure . I have now exited my 125 % long position as the formation is forming SO FAR an ABC rally up with two legs if equal we should top today in cash at 5796 5805 in spy 575/577.9 IF the beasish count is correct we should see a 3 wave drop to retest the low or make a small new low for wave B then I will enter the long calls once again for a 5 wave rally under the bearish count the limit is .786 but based on history dated back to 1902 we should peak at .618 to .66 if The bearish wave count is were we are in the Cycle . But if we rally from here and close above 5805 I would see the market making New all time Highs .Best of trades WAVETIMER 1

Bear Flag Broken on the $SPYBear Flag Broken on the AMEX:SPY ‼️🙀
- Rejection off the 200DMA
- 25DMA Bearish Cross of the 200DMA
Look Left 🎯 is $549.68
⛳️Measured Move 📏 is $538.73
Not financial advice

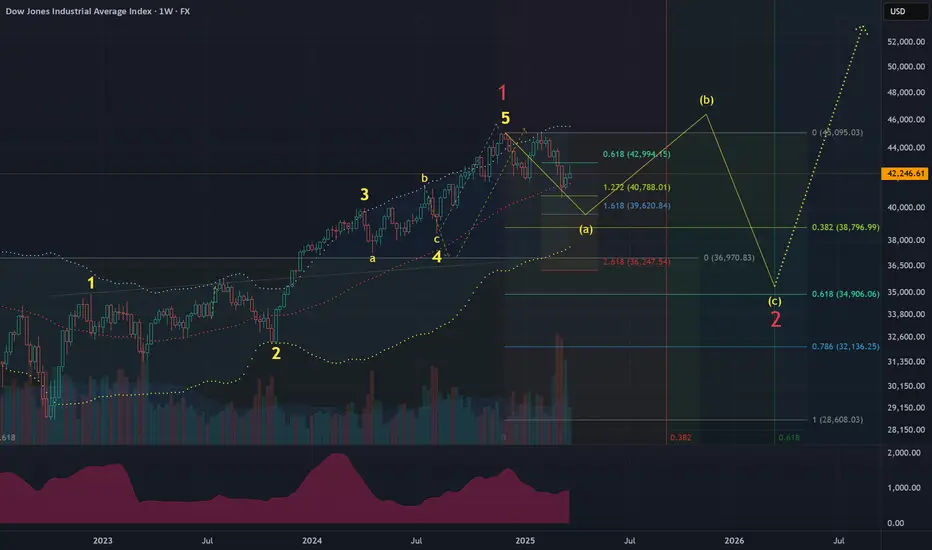
DJI US stock market forecast 2025-2026Assumption:
oct-22 — nov-24 (1-2-3-4-5) wave is over.
correction (a)-(b)-(c) is expected.
likely structure is a 3 wave regular flat.
Time:
the correction is expected to last until at least sep-25.
Price:
it's too early to predict final price for wave (c).
anticipated range is 35000-39000.
wave (a) shall reach 39600.
Long term waves:
Major uptrend lasts 25 years.
Major correcting downtrend lasts 9 years.
Next major downtrend is expected to start in 2033-2034.
3/21 Gap Fill Bullish BounceUS indices are poised to fill downside gaps from Friday's close. Could be good for a bounce w/ upside cash gap targets higher.

Morning Market AnalysisToday or Monday should be a low. The possibility of a move up after open to squeeze out shorts before a larger down move is there.

SPY/QQQ Plan Your Trade For 3-28-25 : Carryover in Counter TrendToday's pattern suggests the SPY/QQQ will attempt to move downward in early trading. The SPY may possibly target the 564-565 level before finding support. The QQQ may possibly attempt to target the 475-476 level before finding support.
Overall, the downward trend is still dominant.
I believe the SPY/QQQ may find some support before the end of trading today and attempt to BOUNCE (squeeze) into the close of trading.
Gold and Silver are RIPPING higher. Here we go.
Remember, I've been telling you of the opportunities in Gold/Silver and other market for more than 5+ months (actually more than 3+ years). This is the BIG MOVE starting - the BIG PARABOLIC price rally.
BTCUSD has rolled downward off the FWB:88K level - just like I predicted. Now we start the move down to the $78k level, then break downward into the $58-62k level looking for support.
Love hearing all of your success stories/comments.
GET SOME.
Happy Friday.
#trading #research #investing #tradingalgos #tradingsignals #cycles #fibonacci #elliotwave #modelingsystems #stocks #bitcoin #btcusd #cryptos #spy #gold #nq #investing #trading #spytrading #spymarket #tradingmarket #stockmarket #silver

Nightly $SPY / $SPX Scenarios for March 28, 2025🔮 🔮
🌍 Market-Moving News 🌍:
🇺🇸📊 Core PCE Inflation Data Release: The Personal Consumption Expenditures (PCE) Price Index for February is set to be released. Economists anticipate a 0.3% month-over-month increase and a 2.5% year-over-year growth, aligning with previous figures. As the Federal Reserve's preferred inflation gauge, this data could influence monetary policy decisions.
🇺🇸🛍️ Consumer Spending and Income Reports: February's personal income and spending reports are due, with forecasts indicating a 0.4% rise in personal income and a 0.5% increase in personal spending. These figures will provide insights into consumer behavior and economic momentum.
🇺🇸🏠 Pending Home Sales Data: The Pending Home Sales Index for February is scheduled for release, with expectations of a 2.0% increase, following a 1.0% rise in January. This index offers a forward-looking perspective on housing market activity.
📊 Key Data Releases 📊
📅 Friday, March 28:
💵 Personal Income (8:30 AM ET):
Forecast: +0.4%
Previous: +0.9%
Measures the change in income received from all sources by consumers.
🛍️ Personal Spending (8:30 AM ET):
Forecast: +0.5%
Previous: -0.2%
Tracks the change in the value of spending by consumers.
📈 PCE Price Index (8:30 AM ET):
Forecast: +0.3% month-over-month; +2.5% year-over-year
Previous: +0.3% month-over-month; +2.5% year-over-year
Reflects changes in the price of goods and services purchased by consumers.
🏠 Pending Home Sales Index (10:00 AM ET):
Forecast: +2.0%
Previous: +1.0%
Indicates the number of homes under contract to be sold but still awaiting the closing transaction.
⚠️ Disclaimer: This information is for educational and informational purposes only and should not be construed as financial advice. Always consult a licensed financial advisor before making investment decisions.
📌 #trading #stockmarket #economy #news #trendtao #charting #technicalanalysis
SPX - Where Rebound?Possible reversal level is at the lower boundary of the channel in wave 4 of the upper order
