Effective inefficiencyStop-Loss. This combination of words sounds like a magic spell for impatient investors. It's really challenging to watch your account get smaller and smaller. That's why people came up with this magic amulet. Go to the market, don't be afraid, just put it on. Let your profits run, but limit your losses - place a Stop-Loss order.
Its design is simple: when the paper loss reaches the amount agreed upon with you in advance, your position will be closed. The paper loss will become real. And here I have a question: “ Does this invention stop the loss? ” It seems that on the contrary - you take it with you. Then it is not a Stop-Loss, but a Take-Loss. This will be more honest, but let's continue with the classic name.
Another thing that always bothered me was that everyone has their own Stop-Loss. For example, if a company shows a loss, I can find out about it from the reports. Its meaning is the same for everyone and does not depend on those who look at it. With Stop-Loss, it's different. As many people as there are Stop-Losses. There is a lot of subjectivity in it.
For adherents of fundamental analysis, all this looks very strange. I cannot agree that I spent time researching a company, became convinced of the strength of its business, and then simply quoted a price at which I would lock in my loss. I don't think Benjamin Graham would approve either. He knew better than anyone that the market loved to show off its madness when it came to stock prices. So Stop-Loss is part of this madness?
Not quite so. There are many strategies that do not rely on fundamental analysis. They live by their own principles, where Stop-Loss plays a key role. Based on its size relative to the expected profit, these strategies can be divided into three types.
Stop-Loss is approximately equal to the expected profit size
This includes high-frequency strategies of traders who make numerous trades during the day. These can be manual or automated operations. Here we are talking about the advantages that a trader seeks to gain, thanks to modern technical means, complex calculations or simply intuition. In such strategies, it is critical to have favorable commission conditions so as not to give up all the profits to maintaining the infrastructure. The size of profit and loss per trade is approximately equal and insignificant in relation to the size of the account. The main expectation of a trader is to make more positive trades than negative ones.
Stop-Loss is several times less than the expected profit
The second type includes strategies based on technical analysis. The number of transactions here is significantly less than in the strategies of the first type. The idea is to open an interesting position that will show enough profit to cover several losses. This could be trading using chart patterns, wave analysis, candlestick analysis. You can also add buyers of classic options here.
Stop-Loss is an order of magnitude greater than the expected profit
The third type includes arbitrage strategies, selling volatility. The idea behind such strategies is to generate a constant, close to fixed, income due to statistically stable patterns or extreme price differences. But there is also a downside to the coin - a significant Stop-Loss size. If the system breaks down, the resulting loss can cover all the earned profit at once. It's like a deposit in a dodgy bank - the interest rate is great, but there's also a risk of bankruptcy.
Reflecting on these three groups, I formulated the following postulate: “ In an efficient market, the most efficient strategies will show a zero financial result with a pre-determined profit to loss ratio ”.
Let's take this postulate apart piece by piece. What does efficient market mean? It is a stock market where most participants instantly receive information about the assets in question and immediately decide to place, cancel or modify their order. In other words, in such a market, there is no lag between the appearance of information and the reaction to it. It should be said that thanks to the development of telecommunications and information technologies, modern stock markets have significantly improved their efficiency and continue to do so.
What is an effective strategy ? This is a strategy that does not bring losses.
Profit to loss ratio is the result of profitable trades divided by the result of losing trades in the chosen strategy, considering commissions.
So, according to the postulate, one can know in advance what this ratio will be for the most effective strategy in an effective market. In this case, the financial result for any such strategy will be zero.
The formula for calculating the profit to loss ratio according to the postulate:
Profit : Loss ratio = %L / (100% - %L)
Where %L is the percentage of losing trades in the strategy.
Below is a graph of the different ratios of the most efficient strategy in an efficient market.
For example, if your strategy has 60% losing trades, then with a profit to loss ratio of 1.5:1, your financial result will be zero. In this example, to start making money, you need to either reduce the percentage of losing trades (<60%) with a ratio of 1.5:1, or increase the ratio (>1.5), while maintaining the percentage of losing trades (60%). With such improvements, your point will be below the orange line - this is the inefficient market space. In this zone, it is not about your strategy becoming more efficient, you have simply found inefficiencies in the market itself.
Any point above the efficient market line is an inefficient strategy . It is the opposite of an effective strategy, meaning it results in an overall loss. Moreover, an inefficient strategy in an efficient market makes the market itself inefficient , which creates profitable opportunities for efficient strategies in an inefficient market. It sounds complicated, but these words contain an important meaning - if someone loses, then someone will definitely find.
Thus, there is an efficient market line, a zone of efficient strategies in an inefficient market, and a zone of inefficient strategies. In reality, if we mark a point on this chart at a certain time interval, we will get rather a cloud of points, which can be located anywhere and, for example, cross the efficient market line and both zones at the same time. This is due to the constant changes that occur in the market. It is an entity that evolves together with all participants. What was effective suddenly becomes ineffective and vice versa.
For this reason, I formulated another postulate: “ Any market participant strives for the effectiveness of his strategy, and the market strives for its own effectiveness, and when this is achieved, the financial result of the strategy will become zero ”.
In other words, the efficient market line has a strong gravity that, like a magnet, attracts everything that is above and below it. However, I doubt that absolute efficiency will be achieved in the near future. This requires that all market participants have equally fast access to information and respond to it effectively. Moreover, many traders and investors, including myself, have a strong interest in the market being inefficient. Just like we want gravity to be strong enough that we don't fly off into space from our couches, but gentle enough that we can visit the refrigerator. This limits or delays the transfer of information to each other.
Returning to the topic of Stop-Loss, one should pay attention to another pattern that follows from the postulates of market efficiency. Below, on the graph (red line), you can see how much the loss to profit ratio changes depending on the percentage of losing trades in the strategy.
For me, the values located on the red line are the mathematical expectation associated with the size of the loss in an effective strategy in an effective market. In other words, those who have a small percentage of losing trades in their strategy should be on guard. The potential loss in such strategies can be several times higher than the accumulated profit. In the case of strategies with a high percentage of losing trades, most of the risk has already been realized, so the potential loss relative to the profit is small.
As for my attitude towards Stop-Loss, I do not use it in my stock market investing strategy. That is, I don’t know in advance at what price I will close the position. This is because I treat buying shares as participating in a business. I cannot accept that when crazy Mr. Market knocks on my door and offers a strange price, I will immediately sell him my shares. Rather, I would ask myself, “ How efficient is the market right now and should I buy more shares at this price? ” My decision to sell should be motivated not only by the price but also by the fundamental reasons for the decline.
For me, the main criterion for closing a position is the company's profitability - a metric that is the same for everyone who looks at it. If a business stops being profitable, that's a red flag. In this case, the time the company has been in a loss-making state and the size of the losses are considered. Even a great company can have a bad quarter for one reason or another.
In my opinion, the main work with risks should take place before the company gets into the portfolio, and not after the position is opened. Often it doesn't even involve fundamental business analysis. Here are four things I'm talking about:
- Diversification. Distribution of investments among many companies.
- Gradually gaining position. Buying stocks within a range of prices, rather than at one desired price.
- Prioritization of sectors. For me, sectors of stable consumer demand always have a higher priority than others.
- No leverage.
I propose to examine the last point separately. The thing is that the broker who lends you money is absolutely right to be afraid that you won’t pay it back. For this reason, each time he calculates how much his loan is secured by your money and the current value of the shares (that is, the value that is currently on the market). Once this collateral is not enough, you will receive a so-called margin call . This is a requirement to fund an account to secure a loan. If you fail to do this, part of your position will be forcibly closed. Unfortunately, no one will listen to the excuse that this company is making a profit and the market is insane. The broker will simply give you a Stop-Loss. Therefore, leverage, by its definition, cannot be used in my investment strategy.
In conclusion of this article, I would like to say that the market, as a social phenomenon, contains a great paradox. On the one hand, we have a natural desire for it to be ineffective, on the other hand, we are all working on its effectiveness. It turns out that the income we take from the market is payment for this work. At the same time, our loss can be represented as the salary that we personally pay to other market participants for their efficiency. I don't know about you, but this understanding seems beautiful to me.
Strategy!

[03/03] SPY GEX Analysis (Until Friday Expiration)Overall Sentiment:
Currently, there’s a positive GEX sentiment, suggesting an optimistic start to the week following Friday’s bounce. However, the key Call resistance appears at 600, and it may not break on the first attempt. If optimism remains strong, there’s a chance SPY 0.09%↑ could still push above that zone after some initial back-and-forth.
🟢Upside Levels:
600–605 Zone: This is a major resistance area. Should SPY move decisively through 600/605, the next potential target could be 610.
610: This is currently the largest positive GEX zone for the week. Current option pricing suggests only about a 9% chance of closing at or above 610 by Friday, so it might require a particularly strong move to break through.
🔵 Transition Zone: Roughly 592–599. The gamma flip level is near 592, and staying above that keeps the market in a positive gamma range for now.
🔴 Downside Risk:
If 592 Fails (or HVL climbing up during the week, and after that HVL fails…): A drop could accelerate toward 585, which may act as the first take-profit zone for bears. Below that, 580 could be in play if selling intensifies.
Lower Support: 575 is the last strong support mentioned, but current option probabilities suggest about an 88% chance of finishing above that level, making a move below 575 less likely—though still possible given the higher put skew.
🟣Volatility & Skew:
IVR (Implied Volatility Rank) is quite high on SPY, with a notable put pricing skew (around 173.1%).
This heightened put skew indicates the market is pricing in faster, more volatile downward moves compared to upside.

MSTR IS JUST GETTING STARTED - ONLY FOOLS SELL NOW!MSTR and Bitcoin are gearing up for the biggest bull run you've ever seen. Its unbelievable how many people are selling now thinking the bear market is starting and the bull run is over. Its crazy how many bears are flooding X and other platforms. It makes me laugh people calling Saylor a top signal and stupid. Saylor is not stupid and to think that you're smarter than him is just dumb. These rich dudes and hedge funds know whats going on, way better than anyone on here or any other platform. They control the markets, they have the money to make the charts do what they want. Dont be fooled.
None of this is financial advice. Just my opinion. Follow me for more charts and updates.

How to develop a simple Buy&Sell strategy using Pine ScriptIn this article, will explain how to develop a simple backtesting for a Buy&Sell trading strategy using Pine Script language and simple moving average (SMA).
Strategy description
The strategy illustrated works on price movements around the 200-period simple moving average (SMA). Open long positions when the price crossing-down and moves below the average. Close position when the price crossing-up and moves above the average. A single trade is opened at a time, using 5% of the total capital.
Behind the code
Now let's try to break down the logic behind the strategy to provide a method for properly organizing the source code. In this specific example, we can identify three main actions:
1) Data extrapolation
2) Researching condition and data filtering
3) Trading execution
1. GENERAL PARAMETERS OF THE STRATEGY
First define the general parameters of the script.
Let's define the name.
"Buy&Sell Strategy Template "
Select whether to show the output on the chart or within a dashboard. In this example will show the output on the chart.
overlay = true
Specify that a percentage of the equity will be used for each trade.
default_qty_type = strategy.percent_of_equity
Specify percentage quantity to be used for each trade. Will be 5%.
default_qty_value = 5
Choose the backtesting currency.
currency = currency.EUR
Choose the capital portfolio amount.
initial_capital = 10000
Let's define percentage commissions.
commission_type = strategy.commission.percent
Let's set the commission at 0.07%.
commission_value = 0.07
Let's define a slippage of 3.
slippage = 3
Calculate data only when the price is closed, for more accurate output.
process_orders_on_close = true
2. DATA EXTRAPOLATION
In this second step we extrapolate data from the historical series. Call the calculation of the simple moving average using close price and 200 period bars.
sma = ta.sma(close, 200)
3. DEFINITION OF TRADING CONDITIONS
Now define the trading conditions.
entry_condition = ta.crossunder(close, sma)
The close condition involves a bullish crossing of the closing price with the average.
exit_condition = ta.crossover(close, sma)
4. TRADING EXECUTION
At this step, our script will execute trades using the conditions described above.
if (entry_condition==true and strategy.opentrades==0)
strategy.entry(id = "Buy", direction = strategy.long, limit = close)
if (exit_condition==true)
strategy.exit(id = "Sell", from_entry = "Buy", limit = close)
5. DESIGN
In this last step will draw the SMA indicator, representing it with a red line.
plot(sma, title = "SMA", color = color.red)
Complete code below.
//@version=6
strategy(
"Buy&Sell Strategy Template ",
overlay = true,
default_qty_type = strategy.percent_of_equity,
default_qty_value = 5,
currency = currency.EUR,
initial_capital = 10000,
commission_type = strategy.commission.percent,
commission_value = 0.07,
slippage = 3,
process_orders_on_close = true
)
sma = ta.sma(close, 200)
entry_condition = ta.crossunder(close, sma)
exit_condition = ta.crossover(close, sma)
if (entry_condition==true and strategy.opentrades==0)
strategy.entry(id = "Buy", direction = strategy.long, limit = close)
if (exit_condition==true)
strategy.exit(id = "Sell", from_entry = "Buy", limit = close)
plot(sma, title = "SMA", color = color.red)
The completed script will display the moving average with open and close trading signals.
IMPORTANT! Remember, this strategy was created for educational purposes only. Not use it in real trading.

#TATAMOTORS Demand ZoneBuying pressure is strong enough to overcome selling pressure.
The price has historically reversed upward from this zone.
Traders expect the price to bounce back if it reaches this zone again.

$3.35 to $8.50 New highs power vertical predicted from lows$3 to $8+ 🚀 New highs power vertical predicted from lows after shortseller manipulation trick on NASDAQ:ACON
4 Buy Alerts sent our along with multiple chat messages confirming the expected move
It closed the day at highs looking good for continuation tomorrow

ETHUSD WEEKLY CHARTS (ETHUSD)Alternative (Bullish) Analysis
1. Potential Breakout Above 2835 Resistance
The current analysis assumes Ethereum will reject from the 2835 resistance and drop back to 2146.
However, given the strong upward momentum (+13.46%), ETH could break above 2835 instead of reversing.
A daily close above 2835 could trigger a rally toward 3000+.
2. Support Holding at Higher Levels
Instead of expecting a drop to 2146, ETH may form a higher low around 2400 – 2500, which would confirm bullish continuation.
If it retests 2500 and holds, it could bounce back up toward the resistance and push higher.
3. Volume & Momentum Confirmation
The sharp breakout suggests strong buying pressure.
If volume remains high, ETH could invalidate the resistance level and start a new uptrend.
4. Market Sentiment & Macro Factors
If Bitcoin remains bullish, Ethereum will likely follow suit, pushing above resistance levels.
The broader crypto market’s strength could support a continuation rather than a rejection.
Conclusion
Instead of expecting a double-top rejection at 2835, traders should watch for a potential breakout. If ETH stabilizes above 2500, it could lead to a move toward 3000, rather than a drop to 2146

Btcusd weekly chart (btcusd)Alternative (Bullish) Analysis
1. Potential Continuation Above Resistance (95,300)
The current analysis assumes rejection at 95,300 and a drop toward 78,118. However, a strong breakout above 95,300 could trigger a rally toward 100,000 or higher.
If Bitcoin consolidates above 95,300, it may act as a new support, rather than a rejection zone.
2. Volume Confirmation on the Breakout
The price surged significantly (+9.09%), suggesting strong bullish momentum.
Instead of expecting an immediate rejection, watch for high volume confirming a potential continuation upward.
3. Higher Low Formation Instead of a Drop
The chart expects a fall back to 78,118, but the price may form a higher low around 85,000 – 88,000 before resuming the uptrend.
A retracement to this range (not all the way down to 78,118) would still be healthy in a bull market.
4. Market Sentiment Shift
The sharp upward movement suggests buying pressure rather than an exhaustion move.
If 95,300 is tested again and breaks, it could lead to a parabolic move instead of a reversal

GBPJPY weekly analysis (Gbpjpy)Alternative (Bullish) Analysis
1. Breakout Above Resistance at 190.070
The chart suggests rejection from 190.070, but if price breaks and holds above this level, it could signal further upside momentum.
Instead of a bearish move, price could consolidate above 190.165 and push toward 191.003 or higher.
2. Strong Accumulation in the Support Zone (187.800)
The support area at 187.800 has already been tested multiple times, and each time, price has rebounded.
This could indicate a strong demand zone, meaning buyers are stepping in aggressively.
If buyers push price back to resistance and break through, a new bullish trend may emerge.
3. Liquidity Grab Below 188.000
The previous dip below 188.000 may have been a liquidity grab to stop out weak hands before a bullish reversal.
If this assumption holds, price may now aim for higher highs rather than another rejection from resistance.
4. Market Structure Shift
Instead of forming a lower high at resistance, a higher low formation could suggest an uptrend.
If price finds support around 189.000 instead of dropping to 187.800, a bullish continuation pattern would be confirmed

Xauusd weekly charts gold big fall soon opportunity (XAUUSD) Alternative (Bullish) Analysis
1. Support Strength at 2820
The chart suggests that price may drop to 2820, but this area has shown strong support historically
Instead of further breakdown, a strong bounce from this level could lead to a bullish reversal.
2. Potential False Breakdown
The resistance at 2864 is marked as a selling zone, but if price breaks above it, it could trigger stop-losses for short positions, fueling a rally.
If price consolidates above 2864, it could invalidate the bearish projection.
3. Trend Line Reversal
The chart shows a downtrend, but if price breaks above the descending trend line, it would signal a trend reversal rather than continuation.
A bullish breakout above 2864 could target 2900+ levels.
4. Economic Events Impact
The economic events marked (likely U.S. data releases) could trigger volatility.
If these reports are weaker than expected, gold could rally as investors seek safe-haven assets.
Conclusion
While the original chart suggests a bearish move, there's a strong case for a bullish reversal if the support at 2820 holds and price breaches the 2864 resistance. Instead of shorting aggressively, traders should watch for confirmation signals before committing to a bearish or bullish bias

7 DTE SPX Iron Condor, expires 2/28/2025The legs -6190+6195 -5835+5830
8.2% gain (premium) on capital invested on this trade.
Expecting the side ways action on SPX the next week to stay with in this range, will adjust if price hits either of the yellow lines.
Gaban Trading

XAUUSD strong down again 1. Potential for Reversal
The analysis assumes a clear bearish move toward the support area. However, price action may react differently to the resistance zone. If buyers step in, we could see a reversal rather than a continuation downward.
A false breakdown could trap sellers and push the price back up to retest resistance instead.
2. Market Structure Weakness
The chart suggests a Break of Structure (BOS) confirming a downtrend, but the momentum could weaken if volume decreases.
The weak low labeled on the chart could act as a temporary liquidity grab rather than a strong bearish continuation.
3. Economic and Fundamental Factors
Gold is sensitive to economic news, interest rate decisions, and geopolitical events. If a news event favors gold, this technical setup could be invalidated.
USD strength or weakness could shift demand for gold, affecting this price projection.
4. Liquidity Considerations
Support and resistance zones are often areas where liquidity is hunted. Market makers may manipulate price to take out stops before the actual move occurs

AUDUSD STRONG FALL SOON OPPORTUNITY 1. Breakout Above Resistance
The analysis assumes a rejection at the resistance zone, leading to a downtrend. However, if bullish momentum builds, the price could break above resistance, invalidating the sell-off expectation.
2. Support Might Not Hold
The marked support zone might be weak if there is strong bearish sentiment, leading to a potential breakdown rather than a reversal from that level.
3. Range-bound Market
Instead of a clear breakout or breakdown, AUD/USD might stay within a sideways range, consolidating between support and resistance rather than making a decisive move.
4. Fundamental Factors
Economic data releases, central bank policies, or geopolitical events could override this technical setup, causing unexpected price movements in either direction.

Btcusd strong analysis opportunity 1. Breakout Possibility Above Resistance
The analysis assumes a rejection at the resistance zone, but Bitcoin could break above it instead, leading to a bullish continuation rather than a reversal.
2. Stronger Support Holding
The projected drop might not occur if the support zone proves stronger than expected, leading to a bounce instead of a decline.
3. Market Volatility & Fundamentals
Bitcoin often moves based on macroeconomic factors, news, or liquidity shifts. A sudden surge in demand could invalidate this technical setup.
4. Inverse Head & Shoulders Formation
If price action forms a higher low, it could indicate accumulation rather than a sell-off, meaning a push toward new highs instead of a decline

SLIVER STRONG DOWN OPPORTUNITY 1. Resistance Breakout Possibility
The analysis assumes a rejection at resistance, leading to a drop. However, if bullish momentum increases and breaks the resistance, it could trigger a strong rally instead of a decline.
2. Support Weakness
The support area identified might not hold if there's strong bearish pressure. If the price falls sharply, it could break support instead of bouncing, leading to further downside.
3. False Breakout Risk
The projected downtrend might be a false move, where price briefly dips but then rebounds, trapping sellers before reversing to the upside.
4. Market News & Fundamentals

XAUUSD strong bullish analysis opportunity 1. Support May Not Hold – The chart assumes price will respect the support zone and reverse upwards. However, given the strong bearish momentum leading into this level, a breakdown is possible. A break below the support could trigger further declines instead of the expected rebound.
2. Resistance Might Not Be Reached – The analysis predicts a move towards the resistance zone around 2,940, but if selling pressure remains strong, price could stall at the intermediate resistance (around 2,910-2,920) before reversing downward again.
3. Trend Continuation Instead of Reversal – The market is currently in a downtrend, making a continuation of lower lows and lower highs more probable than an immediate bullish reversal. Any short-term bounce might be a liquidity grab before further decline

Strategy Development: Price Levels & Time ProcessingI’m currently working on a trading script designed to identify optimal stop-loss and take-profit levels based on market structure and volatility.
Day TF
Short entry: $101,460.15 with a stop-loss at $105,330.08
TP levels tested down to $82,110
Despite it played out ok I still need additional validation that will come with time. Point is to keep enhancing the script so most of the time price does not pass 5th take profit considering latest periods between consecutive Long & Short signals.
3H TF
Alternatively, I picked different timeframe for another layer of performance evaluation from another perspective.
Long entry: $84,201.84 with a stop-loss at $82,967.61
TP levels tested up to $90,372.97
Blue TP means the closing price reached the level, while gray - did not.
⏱ TIMING
Many traders focus on price levels but overlook the time duration between long and short signals. However, understanding how long trends last is just as crucial as knowing where price might go.
Why does this matter?
If your strategy enters a long trade too soon after a short trade, you might be catching a dead-cat bounce rather than a real reversal.
If your signals occur too frequently, the system may be overreacting to market noise rather than identifying meaningful trend shifts.
Tracking the duration of trend phases helps you align with market cycles rather than getting whipsawed by short-term fluctuations.
The results will be viewed carefully and will be used to improve the logic (code-wise) for better trend detection; stop-loss placements to avoid unnecessary stop-outs; refined entry timing.
The end goal is to make the strategy learn from both aspects of past data - price and time to completely eliminate a need for any user inputs.
Please, let me know:
How you incorporate time-based analysis (other than fixed cycles) into your trading.
If you would want this strategy available for public.

GEO The GEO Group Options Ahead of Earnings If you haven`t bought the dip on GEO:
Now analyzing the options chain and the chart patterns of GEO The GEO Group prior to the earnings report this week,
I would consider purchasing the 26usd strike price Calls with
an expiration date of 2025-4-17,
for a premium of approximately $3.10.
If these options prove to be profitable prior to the earnings release, I would sell at least half of them.

XAUUSD strong down opportunity to big falling 1. Resistance Zone Validity – The marked resistance zone appears strong due to multiple rejections. However, if the price breaks above this zone with strong bullish momentum, a further rally may occur instead of the expected drop.
2. Support Strength – The lower support around 2,890 is a key level. However, if buyers aggressively step in before reaching it, the price could consolidate or reverse prematurely, invalidating the expected bearish move.
3. Market Context – Fundamental factors like economic data, interest rates, or geopolitical events could impact gold prices, overriding this technical setup.
4. False Breakdown Risk – Price could briefly dip below intermediate support and then reverse sharply, trapping sellers in a bear trap

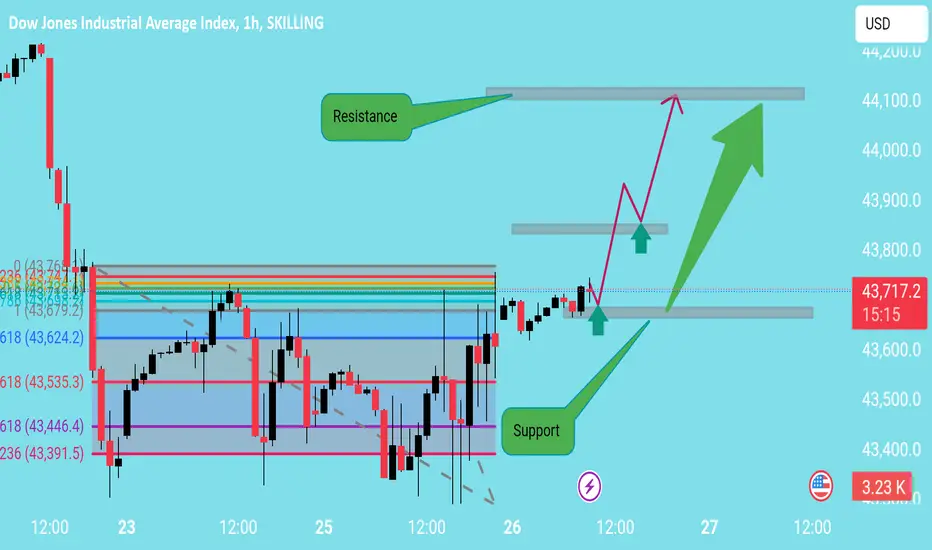
Us30 strong bullish opportunity 1. Overly Bullish Bias
The analysis assumes a clean breakout above support and a strong push to resistance.
However, Dow Jones is known for fakeouts—meaning:
A false breakout above resistance could trap buyers before reversing.
A liquidity grab below support might happen before the real move.
2. Weak Confirmation for the Uptrend
There's no clear volume confirmation—breakouts need high volume to be valid.
Price is consolidating near key Fibonacci levels, meaning a reversal is just as likely as a breakout.
A better approach would be waiting for a strong retest and breakout confirmation.
3. Ignoring Key Fibonacci Levels
The chart includes multiple Fibonacci levels but does not integrate them into the projection.
The 2.618 (43,535) and 3.618 (43,446) levels suggest possible retracements before an upward move
Instead of an instant push-up, a dip to test Fibonacci support is likely.
4. Resistance Might Hold Strong
The resistance area is broad, meaning:
A rejection at resistance could lead to a short-term bearish pullback.
The market might range between the two levels instead of moving in a straight line.
Alternative Scenario:
Instead of assuming an instant bullish move:
1. Bearish Trap First: A false breakout above resistance to trap buyers, followed by a drop.
2. Deeper Retest: Price could revisit support or a Fibonacci level before a true breakout.
3. Wait for Volume Confirmation: If resistance breaks with strong momentum, then an entry makes sense
Strategy Hit SupportMSTR should easily hold $246 and make its way back up to $418 and form it's next support there.
Good luck!

Microstrategy Enters "The Valley of Risk"A term I have coined, "The Valley of Risk", describes a price chart which has had a prior very strong bullish trend, pulls back to its 50% Retracement Support, and then fails to hold it... entering a long, grinding, bearish deflation which coincides with the heavy negative emotion being felt by those still holding the bag.
Inside the "Valley of Risk" nothing one does is correct:
If you sell... it will bottom and rally
If you buy... it will continue down
If you baghold... it will continue to go down until you cannot stand it and #1
This is just a pattern of human emotion being reflected on a price chart... which is what price charts ultimately are. It is best to avoid going into the Valley of Risk and have strict rules against bagholding. Deploy your capital elsewhere that there is a better potential rate of return.
When I teach about this concept I always look back to Zillow NASDAQ:Z . This was a stock I bought "on a dip" at 111 and made the right decision to sell my position at a loss at 102 when the stock price violated the 50% Support. This allowed me to avoid the horrible Earnings miss gap and the final -74% depreciation. My position still would not have recovered as of writing.
As I published months ago, it became clear to me that the over exuberance and fancy financial buzz words being thrown around about NASDAQ:MSTR were signs of a ponzi about to collapse. Well, the "Bitcoin nuclear reactor" has cooled and the leverage baked into Microstrategy would be its downfall. That has now come to pass. There are some other interesting elements of price action which have been textbook in this decline that I want to talk about in this post.
The 50% Retracement:
The operative level for the last 3 months has been 328. This is the 50% Retracement of the YOLO rally. In the pullback from the ATH 440 became the 50% Retracement Resistance.
The Ichimoku Cloud Breakout Confirmed:
The other textbook setup was when the Ichimoku Cloud Breakout was confirmed by the Lagging Span entering clear bearish space after price had exited the cloud. Interestingly, this happened at the same exact day as Bitcoin; last Friday. You can read more about this strategy and my 14 year study of how effective it is in my recent Ideas:
So what now?
That is the eternal question of "The Valley of Risk". There is never a good answer because the technical supports have been broken.
Personally though I need to answer this question for my bearish positions. The most logical point to look would be the Volume Profile POC at 165. However, Microstrategy is going to move concurrent to Bitcoin itself and knowing the past bearish cycle patterns this week, through brutal, will find a bottom. I do not believe it will be the final bottom only that price may hesitate at some point for perhaps even a month.
My trade management
This week I will be selling premium against my long Puts, which go out to 2027, to offset my Theta while still remaining short Delta.

Bollinger Bands: Basics and Breakout Strategy🔵 What are Bollinger Bands?
Bollinger Bands are a popular technical analysis tool developed by John Bollinger in the early 1980s. They help traders analyze price volatility and potential price levels for buying or selling. The indicator consists of three lines plotted over a price chart:
Middle Band: A simple moving average (SMA), typically set to a 20-period average.
Upper Band: The middle band plus two standard deviations.
Lower Band: The middle band minus two standard deviations.
🔵 How Are Bollinger Bands Calculated?
Middle Band (MB): MB = 20-period SMA of the closing price.
Upper Band (UB): UB = MB + (2 × standard deviation of the last 20 periods).
Lower Band (LB): LB = MB - (2 × standard deviation of the last 20 periods).
The bands expand when volatility increases and contract when volatility decreases.
length = 20
basis = ta.sma(src, length)
dev = mult * ta.stdev(src, length)
upper = basis + dev
lower = basis - dev
🔵 How to Use Bollinger Bands in Trading
Bollinger Bands provide insights into market volatility and potential price reversals. Traders often use them to:
Identify overbought (price near the upper band) and oversold (price near the lower band) conditions.
Spot volatility contractions, which often precede significant price moves.
Confirm trend strength and potential reversals.
🔵 Bollinger Bands Breakout Strategy
One effective strategy involves preparing for breakouts when the upper and lower bands contract, indicating low price momentum.
Strategy Steps:
Identify Low Volatility Zones: Look for periods when the bands are close together, signaling a potential breakout.
Prepare for a Breakout: Monitor price action as it approaches either the upper or lower band.
Entry Signal: Enter a trade when the price closes above the upper band (for a long position) or below the lower band (for a short position).
Stop Loss Placement:
For long entries (break above upper band): Set stop loss at the lower band.
For short entries (break below lower band): Set stop loss at the upper band.
Profit Target: Use a risk-reward ratio of at least 1:2 or close the position when price shows signs of reversal.
Example Charts:
🔵 Final Thoughts
This Bollinger Bands breakout strategy is simple yet effective. By recognizing periods of low volatility and preparing for breakouts, traders can capitalize on significant price movements. Always complement this strategy with proper risk management and confirmation indicators for optimal results.
This article is for informational purposes only and should not be considered financial advice. Trading involves risk, and traders are solely responsible for their own decisions and actions.
