The F1 Mindset Every Trader Needs!!!Most traders behave like they’re trying to win the race on the first lap.
Full throttle. No patience. And then they wonder why they spin out before the finish line.
🏎 But in Formula 1, especially under the lights of Abu Dhabi, the winners don’t drive the fastest…
They manage the race the smartest.
And trading is no different.
Here are the three F1 lessons every trader should master:
1️⃣You Don’t Win by Being Fast => You Win by Being Controlled
F1 drivers don’t go maximum speed all the time.
They manage tyres, fuel, engine temperature, and track conditions.
In trading, your “tyres” are your capital.
Burn them early with emotional trades, and your race is over.
Consistency beats speed.
Control beats excitement.
2️⃣ Your Strategy Is Your Pit Crew
No F1 driver wins alone, they rely on a team that’s fast, disciplined, and precise.
For traders, your “pit crew” is your:
- trading plan
- risk management
- journaling
- strategy rules
- routines
When your system is aligned, your performance becomes predictable.
When it's sloppy, you get undercut by the market every time.
3️⃣ The Race Is Won on Corners, Not Straights
Every driver can accelerate on the straights.
Champions gain their advantage in the corners — the difficult, technical parts of the track.
In trading, the “corners” are:
- drawdowns
- losing streaks
- choppy markets
- hesitation
- volatility spikes
Anyone can trade a trending market.
True professionals shine in difficult conditions.
🏁 Final Lap Insight
The Abu Dhabi Grand Prix doesn’t reward the loudest driver, it rewards the most disciplined.
Trading is exactly the same.
✔ The market is your circuit.
✔ Your account is your car.
✔ Your rules are your race line.
✔ And your mindset determines whether you finish… or crash out on turn one.
Trade like an F1 driver:
calm, calculated, consistent, and always thinking about the full race, not a single lap.
⚠️ Disclaimer: This is not financial advice. Always do your own research and manage risk properly.
📚 Stick to your trading plan regarding entries, risk, and management.
Good luck! 🍀
All Strategies Are Good; If Managed Properly!
~Richard Nasr
Strategy

XAUUSD update 1h Chart The price is in a short-term ascending channel, marked by your blue parallel lines. The candles show consistent higher highs and higher lows, confirming bullish momentum.
2. Key Levels Highlighted on Chart
Upper resistance zone: ~ 4265–4280
(Thick purple zone at the top; price is approaching this area)
Lower support zone: ~ 4160–4180
(Thick purple zone at the bottom)
These zones indicate past strong reactions (buying and selling pressure).
3. Price Reaction Expectation
The blue drawing shows two potential scenarios:
Scenario A – Bullish breakout
If price breaks above the channel + resistance zone, then:
This signals continuation of the uptrend.
Next upside target would likely be 4300+.
Scenario B – Bearish reversal (most likely according to your structure)
Your blue arrows suggest:
The price may touch the upper resistance, then reject.
A decline toward the 4204 area first (minor support).
Further drop into 4160–4180 (major support zone).
This aligns with:
The rising wedge–like structure (which often breaks down)
Exhaustion at a high-timeframe resistance.
4. Indicators on Chart
Red arrow signal at prior top → selling pressure.
Green arrow signal near bottom → buying pressure.
These confirm that the purple zones are strong supply/demand.
5. What the Structure Suggests
The pattern looks like a bearish rising wedge, which typically breaks downward. If price stalls or prints long wicks near the 4260–4280 zone, a correction is likely.
---
📉 Summary
Most probable path:
✔ Price tests upper resistance → rejects → drops toward 4200 and then 4170 support.
Alternative:
✔ Strong breakout above 4280 → bullish continuation.

Consistency: The Real Market Hack!Every trader wants consistency.
But very few understand what consistency actually means.
Consistency is not:
❌ winning every trade
❌ predicting the market
❌ avoiding losses
❌ being perfect
Consistency is built long before you press the buy (or sell) button.
Here’s what consistent traders all have in common:
1️⃣ They Repeat the Same Process Every Day!
Consistency comes from repetition; not randomness.
The best traders don’t have a different plan for every chart.
They use the same routine, the same checklist, the same rules.
Clarity replaces guesswork.
2️⃣ They Trade Only When Their System Shows Up!
Consistency is not about taking more trades.
It’s about taking only the trades that match your edge.
No signal = no trade.
No confluence = no risk.
No clarity = no entry.
Most inconsistency comes from forcing trades that never belonged in the plan.
3️⃣ They Accept Losses Without Breaking Structure!
A consistent trader still loses, they just don’t fall apart when it happens.
❌They don’t double their risk.
❌ They don’t chase entries.
❌ They don’t change strategy mid-trade.
They take the loss the same way they take the win:
within the system.
4️⃣ They Focus on Long-Term Data, Not Single Trades!
You can’t judge a strategy by one day, one week, or even one month.
Consistency is measured across:
✔ dozens of trades
✔ multiple cycles
✔ all market conditions
Professionals think in probabilities.
Beginners think in outcomes.
The Real Secret?
Consistency is not an ability.
It’s a decision you make every day:
➡️ Follow your rules
➡️ Manage your risk
➡️ Trade your edge
➡️ Ignore the noise
When your habits become consistent, your results eventually follow.
⚠️ Disclaimer: This is not financial advice. Always do your own research and manage risk properly.
📚 Stick to your trading plan regarding entries, risk, and management.
Good luck! 🍀
All Strategies Are Good; If Managed Properly!
~Richard Nasr

GBPUSD - Bears Loading at a Major Confluence???⚔️GBPUSD is approaching a powerful intersection where the upper blue trendline meets the green supply zone. This area has acted as a strong barrier before, and price is now retesting it from below.
📉If this confluence holds, the bearish pressure is likely to kick back in. As long as the rejection is confirmed, we will be looking for trend-following shorts, with the next objective being the lower bound of the rising channel, where buyers may attempt to step in again.
A very clean and technical setup, now we wait for confirmation. 📉🔥
What do you think, will the supply zone hold, or will GBPUSD break higher this time? 👀
⚠️ Disclaimer: This is not financial advice. Always do your own research and manage risk properly.
📚 Stick to your trading plan regarding entries, risk, and management.
Good luck! 🍀
All Strategies Are Good; If Managed Properly!
~Richard Nasr

The One Pattern Every Trader Misses!Most traders focus on flags, wedges, double tops, fibs…
But there’s a pattern far more powerful, and almost no one talks about it:
-- The Behavior Pattern. --
📈It’s not drawn on your chart. You can’t code it into an indicator.
But it determines your success more than any formation.
Here’s the pattern professionals watch, and beginners ignore:
1️⃣ Impulsive Behavior
When price moves fast, traders move even faster.
FOMO kicks in. Chasing begins. Risk is forgotten.
Professional interpretation:
➡️ If emotions are impulsive, structure won’t be respected.
Avoid trading in emotional markets unless you already have a plan.
2️⃣ Hesitation Behavior
Price reaches your level. Your alert triggers.
Everything lines up… and you still don’t enter.
Why?
Because hesitation is a sign your risk is unclear.
Professional interpretation:
➡️ If hesitation appears, your plan isn’t ready.
The chart is never the problem, the plan is.
3️⃣ Revenge Behavior
One loss turns into five.
You stop trading the chart and start trading your frustration.
Professional interpretation:
➡️ If frustration is present, you’re trading without structure.
Step away. Market will be here tomorrow.
Why This Matters ⁉️
The market doesn’t punish bad trades. It punishes bad behavior.
Your biggest losing streaks didn’t come from your strategy.
They came from emotional patterns you didn’t recognize in real time.
Once you learn to see these behavior patterns, your charts become clearer, your decisions simpler, and your risk finally makes sense.
🧠Final Thought
Chart patterns tell you where the market might go.
Behavior patterns tell you whether you’ll survive long enough to get there.
Master both; and you’ll trade with the clarity most people never reach.
⚠️ Disclaimer: This is not financial advice. Always do your own research and manage risk properly.
📚 Stick to your trading plan regarding entries, risk, and management.
Good luck! 🍀
All Strategies Are Good; If Managed Properly!
~Richard Nasr
STRATEGY Mirror crash with 2022 to $60 has started.Michael Saylor won't like this. But the chart is what it is and that's an objective dynamic.
** The 5-year Channel Up and Bear Cycle **
Strategy (MSTR) has been trading within almost a 5-year Channel Up since the February 2021 Top of its previous Cycle. Within this lines, it has had its latest top (Higher High) on the week of November 18 2024 and since then it has been on a structured strong decline.
This decline has gotten even stronger once the price broke below its 1W MA50 (blue trend-line). So far, the 2025 correction is mirroring the 2021 one, which was the start of a 2-year (2021/21) Bear Cycle.
** The three Stages **
Based on that, we have valid reasons to expect that 2026 will also mirror the past Bear Cycle. What stands out on this analysis is that we have classified the whole Bear Cycle into three Stages. Based on that, we have now already entered Stage 2 as the price has broken below its 1W MA50 (and should stay as the Resistance for the remainder of the Cycle) and almost touched its 1W MA200 (orange trend-line). When that happened in January 2022, the market rebounded towards the 1W MA50 where it was rejected and when it broke below the 1W MA200 as well, Stage 3 started. This Stage made the Bear Cycle bottom on the 1M MA250 (red trend-line) after a -90% decline in total. It was completed when the price broke above the 1W MA50 again, essentially confirming the start of the new Bull Cycle.
** Where is the bottom now? **
As a result, we may now see a short-term rebound, limited by the 1W MA50, which after it gets rejected and breaks below the 1W MA200, Stage 3 may start. If this Bear Cycle also crashes by -90%, we should then be expecting a bottom at $60 (at least), supported by the 1M MA250 again.
Notice also the striking symmetry among the 1W RSI patterns of the two Cycle fractals. The 1W RSI has currently hit the 30.00 oversold barrier (similar to Jan 2022) and it was a second break and then a Higher Lows Bullish Divergence that confirmed the bottom of the Bear Cycle, essentially turning Strategy Inc. into a long-term buy opportunity again.
---
** Please LIKE 👍, FOLLOW ✅, SHARE 🙌 and COMMENT ✍ if you enjoy this idea! Also share your ideas and charts in the comments section below! This is best way to keep it relevant, support us, keep the content here free and allow the idea to reach as many people as possible. **
---
💸💸💸💸💸💸
👇 👇 👇 👇 👇 👇

Bullish Analysis 15M-Gold Breakdown – XAU/USD
✨ Clean structure, institutional narrative, and a clear bullish roadmap.
🔹 1. Bearish Liquidity Mitigation (Sell-Side Liquidity)
The market completed its job by sweeping all sell-side liquidity below previous lows 🟠.
This provides the fuel institutions need to build long positions at discount levels. 🔥
🔹 2. Institutional Reversal from the POI
After the liquidity grab, price taps your POI at 4,190 and shows a sharp rejection 🔁.
This is a strong indication of bullish institutional intent. ✔️
🔹 3. Fake Out + Bullish BOS
The fake out was used to trap late sellers ❌ while big players loaded longs.
The following bullish BOS confirms the shift in character and trend direction. 📈
🔹 4. Projected Path Toward Buy-Side Liquidity
Price is now targeting upside liquidity and higher-timeframe inefficiencies. 🎯
🎯 Institutional Targets (TPs)
• TP1 – 4,230: internal liquidity sweep 💧
• TP2 – 4,254: FVG mitigation ⚡
• TP3 – 4,277: continuation of bullish impulse 📊
• TP4 – 4,300: major liquidity grab / expected HH 🏆

The Trade You Don’t Take!Most traders focus on entries, strategies, indicators, patterns…
But the truth is: your biggest edge is avoiding low-quality trades.
The market rewards patience far more than prediction.
Here’s the framework professional traders use to filter noise from opportunity, something 90% of traders overlook:
1. The Market Must Be Aligned
Before placing any trade, ask one question:
“Is the market trending, ranging, or correcting?”
Your strategy only works in the right environment.
A breakout strategy fails in a choppy range. A mean-reversion setup dies in a strong trend.
Identify the environment first, then choose the setup.
2. Your Levels Must Be Significant
True opportunity comes from reaction points, not random prices.
Look for:
- Major swing highs and lows
- Weekly or monthly levels
- Clean trendlines with multiple touches
- Areas where price previously paused, reversed, or consolidated
If the market isn’t near one of these levels, you’re trading in the middle, where noise lives.
3. Your Risk Must Make Sense
A good setup with a bad risk-to-reward is a bad trade.
Professionals only act when:
- The stop-loss is logical (protected behind structure)
- The target is realistic
- The reward outweighs the risk
If the math doesn’t work, the trade doesn’t happen.
🧠 The Hidden Lesson
Great traders don’t trade more, they filter more.
Your account grows not by finding better entries,
but by avoiding the trades that drain your capital, energy, and confidence.
Master the art of waiting, and your strategy will finally start working the way it was designed to.
⚠️ Disclaimer: This is not financial advice. Always do your own research and manage risk properly.
📚 Stick to your trading plan regarding entries, risk, and management.
Good luck! 🍀
All Strategies Are Good; If Managed Properly!
~Richard Nasr

XAUUSD - The Golden Retest Zone!📈Gold remains overall bullish , respecting its rising structure and printing higher lows along the way. Each corrective dip has been met with strong buying pressure, keeping the broader trend intact.
📉As price pulls back, it is now approaching a key blue structure zone that aligns perfectly with the lower blue trendline. This intersection forms a high-confluence area where we will be looking for trend-following longs.
⚔️As long as Gold holds this zone, the bullish scenario remains dominant, with the next potential push targeting the previous ATH highlighted on the chart.
🏹A clean reaction here could be the catalyst for the next leg of the uptrend.
Will the bulls defend the golden zone again? 🤔
⚠️ Disclaimer: This is not financial advice. Always do your own research and manage risk properly.
📚 Stick to your trading plan regarding entries, risk, and management.
Good luck! 🍀
All Strategies Are Good; If Managed Properly!
~Richard Nasr

The Hidden Skill Every Great Trader Masters; And It’s Not Chart!Most traders spend years perfecting chart patterns, indicators, and entries…
Yet only a handful ever master the real skill that separates professionals from the rest, the art of waiting.
📉 Anyone can draw support and resistance.
📈 But not everyone can wait for price to reach them.
The market rewards patience, not predictions.
It’s not about catching every move, it’s about being ready when your setup aligns perfectly.
That’s when you strike. That’s when probability works for you, not against you.
Think of trading like fishing 🎣:
You don’t chase the fish, you position your line where it’s most likely to bite, then you wait.
So next time you feel the urge to jump in early, remind yourself:
You’re not just a trader. You’re a waiter, paid in precision and patience.
📚 Key takeaway:
Great traders don’t predict, they prepare.
They let the market move first, then respond with clarity.
⚠️ Disclaimer: This is not financial advice. Always do your own research and manage risk properly.
All Strategies Are Good; If Managed Properly!
~Richard Nasr

EUR/GBP: Smart Money Unwinding Begins — The Pullback Trap1. Price Action (Daily Chart)
At the moment, EUR/GBP is moving through a bearish correction within a broader medium-term bullish structure. Price has cleanly rejected the 0.8800–0.8850 supply zone, which aligns with the upper boundary of the ascending channel.
The breakdown of the inner trendline and the daily close below the channel’s midline signal that momentum has shifted to sellers.
RSI is deeply oversold, so I expect a technical rebound before any continuation of the sell-off. The first level I’m watching for a retest is 0.8780–0.8800, a former support → now resistance.
As long as we remain below that zone, I maintain a short bias, targeting the 0.8680–0.8650 confluence, where the channel support, daily demand, and previous structural levels align.
A sustained reclaim above 0.8810–0.8830 would invalidate this scenario.
2. Sentiment (Retail Positioning)
Sentiment data shows 74% retail short and only 26% long.
As a contrarian trader, this makes me cautious about selling lows: the crowd is already on the move, usually late. This doesn’t invalidate the downside bias, but it reinforces the idea of waiting for a proper pullback before considering new short entries.
3. COT (Commitment of Traders)
The COT report sends a clear message: we may be entering a distribution phase on the cross.
On the EUR side, Non-Commercials remain strongly net-long (243k vs 135k) but are reducing long exposure.
On the GBP side, Non-Commercials remain net-short (79k vs 91k) and are aggressively cutting long positions.
This tells me the market had been positioned long EUR / short GBP, and is now unwinding that consensus — a classic signature of a correction after a mature bullish trend.
Commercials, as often seen at potential turning points, are doing the opposite: accumulating GBP and distributing EUR, suggesting that current EUR/GBP levels are no longer attractive from a hedging/fundamental standpoint.
4. Seasonality
November seasonality is historically moderately bearish for EUR/GBP across the 10-, 15- and 20-year studies.
December, on the other hand, shows a much stronger positive seasonal tendency.
For me, this creates a clear narrative:
• expected weakness into late November,
• potential accumulation zone in early December,
• likely seasonal recovery in the second half of the month.

MSTR still bullish. MSTR bullishness is still intact but it should close above the upper yellow line for the bullishness confirmation intact. If that happens then there's a big possibility that we will see a big sharp last parabolic run to new ATH. Of course this is not financial advised.
If this failed then the last hope is on the Red Line.

Algotrading XTZUSDTPress "Grab this chart", run strategy tester for entire history and make sure that is good time for a long to yellow line

Algotrading DOTUSDTPress "Grab this chart", run strategy tester and make sure that is good time for a long to yellow line

CRYPTOCHECK Throwback - BEST POSTS 2025New Year loading 🥳🥂
Setting up your trading technique and sticking to it
The Dunning Kruger Effect
How to trade Bollinger Bands
How to Dollar-Cost-Average
Spotting reliable Bottom Patterns
These ideas may help you improve your strategy and become a more profitable trader. Happy Trading!

GBPUSD Retracement Idea for a new Lower HighHi Traders!
Since my last idea GU reached my short target around 1.30000. I'm now looking for price to retrace to a previous bearish BOS area around 1.32500-1.33000. If price can create a new lower high in that area we could possibly see more bearish movement. In addition, if DXY can hold around 99.000-99.500, and continue reversing to the upside I'd have a new swing target for GU at the next Daily OB around 1.29000-1.28500.
1st alert set just below 1.32500 in case price doesn't make it to my target.
*DISCLAIMER: I am not a financial advisor. The ideas and trades I take on my page are for educational and entertainment purposes only. I'm just showing you guys how I trade. Remember, trading of any kind involves risk. Your investments are solely your responsibility and not mine.*

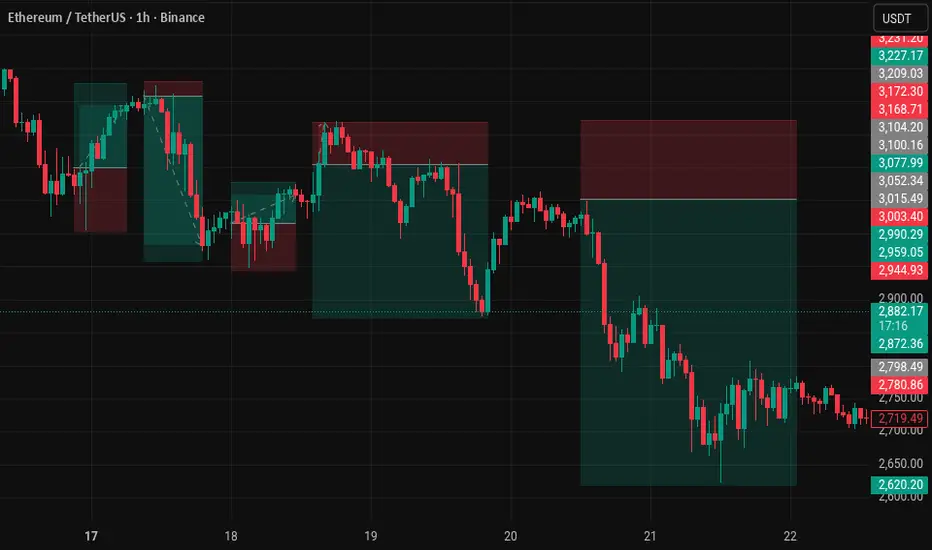
ETH/USDT – Perfect Predictive BUY Signal (10.88R) Using OQBA PAEI tested my new indicator :
OQBA Predictive Analysis Engine (PAE)
on the ETH/USDT pair, and the results were extremely impressive.
During the last sessions, the indicator generated 5 consecutive winning signals (LONG + SHORT), and just two hours ago, it triggered a Predictive BUY that delivered a remarkable:
📈 Risk/Reward: 10.88R
This BUY signal was supported by:
Strong predictive MACD momentum
High-confidence R² stability
Volatility compression detected before the breakout
Histogram projection confirming bullish pressure
🔍 Why this signal matters
The indicator doesn’t wait for lagging confirmation —
it predicts trend shifts using linear regression forecasting + MACD projection.
On ETH, this created a clean high-confidence setup that developed into a powerful breakout.
📌 Chart Preview
(ضع سكرينشوت هنا يظهر نقطة الدخول و الـ TP)
🔧 Indicator Used:
OQBA Predictive Analysis Engine (PAE)
– My own open-source predictive momentum system
– Designed to detect early reversals with confidence filtering
– Now available for public use on TradingView
💬 Let me know if you want:
✔️ A breakdown of how the indicator detected this move
✔️ Settings I used
✔️ A backtest template
✔️ or the premium edition version
IMPP Imperial Petroleum Options Ahead of EarningsIf you haven`t bought IMPP before the rally:
Now analyzing the options chain and the chart patterns of IMPP Imperial Petroleum prior to the earnings report this week,
I would consider purchasing the 7usd strike price Calls with
an expiration date of 2026-4-17,
for a premium of approximately $0.85.
If these options prove to be profitable prior to the earnings release, I would sell at least half of them.

$ALAB just tapped the Golden 618 fibALAB heavily into AI reported very strong earnings and is down $130 and just tapped the 618 golden Fibonacci level support

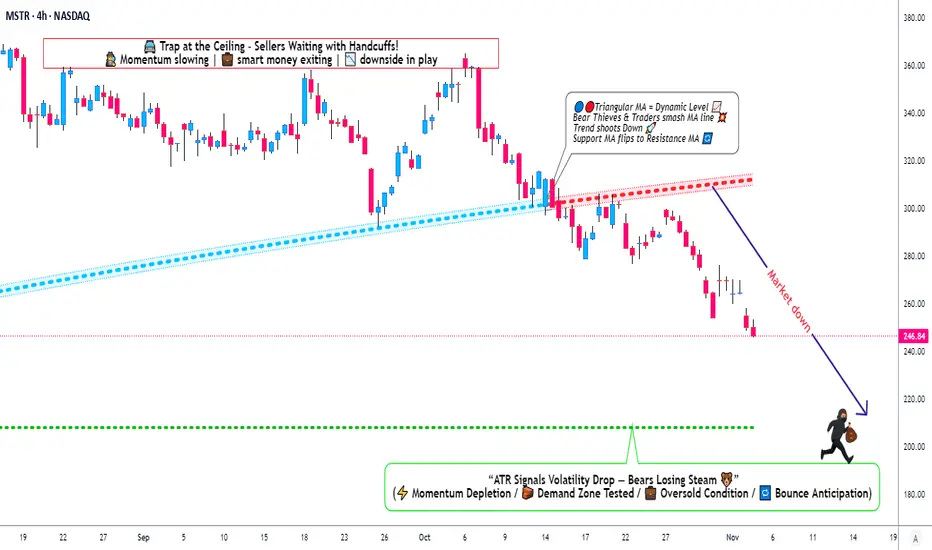
MicroStrategy Under Pressure: Bearish Playbook in Action🎯 MSTR: The "Thief's Playbook" - Strategic Bear Trap Setup! 💰🔥
📊 Asset Overview
MicroStrategy Inc. (MSTR) - Bitcoin's Proxy Play in the Stock Market
🎭 The Setup: When Bears Come to Party
Alright folks, gather 'round! We've got ourselves a textbook triangular moving average breakdown on MSTR that's screaming "short opportunity" louder than my portfolio after a bad trade week! 😅
Current Market Sentiment: 🐻 BEARISH CONFIRMED
The technicals are aligning like planets before a lunar eclipse - and trust me, this eclipse might cast some shadows on those long positions!
🎯 The "Thief Strategy" Game Plan
🚪 Entry Zones - The Layering Approach
Here's where it gets spicy! 🌶️ Instead of going all-in like a degen at a casino, we're using the "Thief Layering Method" - multiple limit sell orders to scale into this position:
Suggested Entry Layers:
🥇 Layer 1: $300
🥈 Layer 2: $290
🥉 Layer 3: $280
💎 Layer 4: $270
🔥 Layer 5: $260
Pro Tip: You can add MORE layers based on your risk appetite and account size. More layers = Better average entry = Smoother sleep at night! 😴
🛡️ Risk Management - The "Oh Sh*t" Line
Stop Loss: 🚨 $320
⚠️ IMPORTANT NOTICE: Dear Thief OGs, Ladies & Gentlemen! This SL is MY line in the sand. YOU need to decide YOUR own risk tolerance. Trade at your own risk, manage your own money, and don't blame me if things go sideways! This ain't financial advice - it's entertainment with charts! 🎪
🎁 Target Zone - Where We Cash Out
Take Profit Target: 🎯 $210
Why $210?
💪 Strong historical support level
📉 Oversold territory expected
Classic bull trap zone where longs get liquidated
⚠️ ANOTHER IMPORTANT NOTICE: Thief OGs! This is MY target. You do YOU! If you see profits earlier and want to secure the bag - DO IT! Don't be greedy. Take profits when YOU feel comfortable. Your account, your rules, your responsibility! 💼
🔗 Related Assets to Watch - The Correlation Game
Keep your eyes on these bad boys for confirmation:
📈 Direct Correlations:
NASDAQ:MARA (Marathon Digital) - Bitcoin miner, moves with crypto sentiment
NASDAQ:RIOT (Riot Platforms) - Another BTC miner, similar volatility pattern
NASDAQ:COIN (Coinbase) - Crypto exchange, sentiment indicator
CRYPTOCAP:BTC (Bitcoin spot) - The godfather! MSTR holds massive BTC, direct correlation
🧠 Key Points:
MSTR trades with ~1.5x-2x Bitcoin beta (more volatile than BTC itself)
When Bitcoin dumps, MSTR often dumps HARDER 📉
Watch BTC support at $60K - if it breaks, MSTR likely follows to our target zone
Tech sector weakness ( NASDAQ:QQQ , AMEX:SPY ) adds bearish pressure
⚡ Trading Psychology - The "Thief Mindset"
Look, this setup requires PATIENCE! 🧘♂️ Don't FOMO in at market price. Layer in like a professional thief planning a heist - calculated, methodical, strategic! This isn't gambling; it's probability management with a side of humor! 😎
🎪 Final Word from Your Friendly Neighborhood Chart Thief
Remember: Markets are wild, unpredictable, and don't care about your feelings OR your bills! This analysis is for educational and entertainment purposes ONLY. The "Thief Strategy" is MY trading style - it's risky, it's aggressive, and it's definitely NOT for everyone!
Do your own research. Manage your own risk. Trade what you can afford to lose. And for the love of all that's holy, don't mortgage your house based on some random internet chart analysis! 🏠❌
✨ If you find value in my analysis, a 👍 and 🚀 boost is much appreciated — it helps me share more setups with the community!
🏷️ #MSTR #MicroStrategy #ShortSetup #BearishBreakdown #SwingTrade #DayTrade #ThiefStrategy #BitcoinStocks #TechnicalAnalysis #MovingAverageCrossover #LayeringStrategy #RiskManagement #StockMarket #TradingIdeas #BTC #CryptoStocks #BearTrap #SupportAndResistance #ChartAnalysis #TradeSmart
🎯 Trade smart, layer in, manage risk, and may the profits be ever in your favor! 💰🚀
XAGUSD idea 11.11.2025I'm primarily looking at two scenarios here: a short could potentially be at sfp above high at a price of around 53.1 and a short that I would like is sfp below low at a price of around 46.7

XAUUSD idea 11.11.2025Here I am watching long and short short from the level around 4200 where there is a nice level on sfp long position could be favorable for me if the price falls below the local bottom where vwap is also at a price around 3890

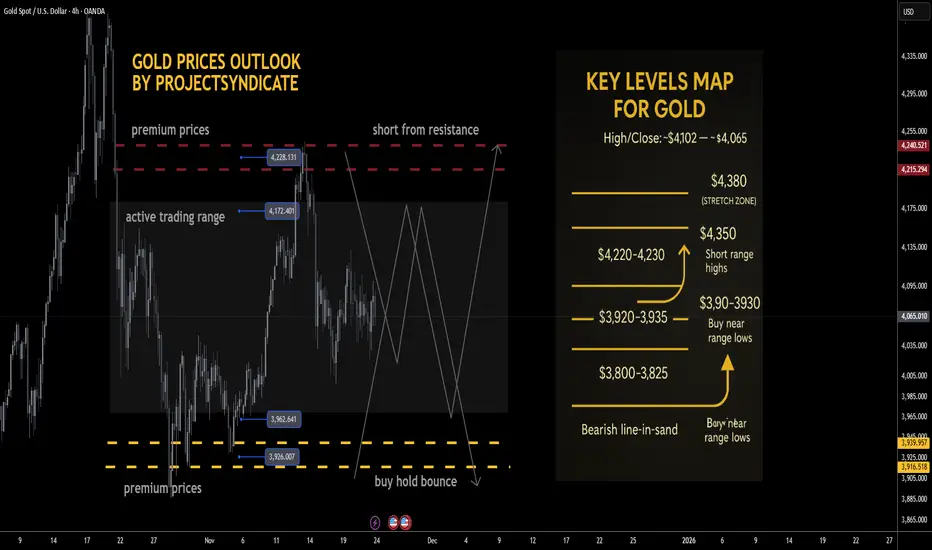
Gold next week: Key S/R Levels and Outlook for Traders🔥 GOLD WEEKLY SNAPSHOT — BY PROJECTSYNDICATE 🏆
High/Close: ~$4,102 → ~$4,065 — tight, inside-feel week with price holding comfortably above the $4,000 handle. Flows look balanced: steady two-way interest, but no strong directional conviction as the market oscillates within a well-defined range.
________________________________________
📈 Trend:
Still bullish on the higher timeframe, but very clearly in range / two-way mode. As long as we’re capped below the $4,350–4,375 ATH supply block and holding above the $3,900s, the playbook remains “range-trade the extremes” rather than chase breakouts.
________________________________________
🛡 Supports Buy Zones
• $3,920–3,930 — key range lows / primary dip zone:
o Your preferred “buy low” area; recent reactions show responsive buyers defending this shelf.
o This is the first major liquidity pocket for range longs and a natural first target for shorts from resistance.
• $3,800–3,825 — deeper demand pocket / fail-safe shelf:
o Secondary, more extreme downside area where higher-timeframe dip-buyers are likely to step in.
o A clean break and daily close below here would suggest the range is failing and a deeper mean reversion is in play, not just a normal pullback.
________________________________________
🚧 Resistances Short Zones
• $4,220–4,230 — immediate range resistance / short-sell zone:
o Your core “short from resistance” idea; this band remains a logical area to fade strength.
o First tests into this region are attractive for tactical shorts, especially if intraday momentum is stalling.
• $4,350–4,375 — ATH heavy resistance block:
o Still the major supply area above.
o Any spike here is a fade candidate unless price starts accepting above it with strong volume and multiple daily closes.
________________________________________
🧭 Bias – Coming Weeks
Base expectation is continued range-bounce price action between roughly $3,920–$4,220, with the broader structure still nested inside the larger $3,800–$4,350 range:
• Preference to fade strength into $4,220–4,230, targeting rotations back toward $3,920–3,930.
• Conversely, buy dips into $3,920–3,930 for moves back toward $4,220–4,230, as long as we hold the $3,800 shelf on a closing basis.
• Invalidation of the “range grind” idea comes on:
o Sustained acceptance above $4,350–4,375 (turns it back into trend-up).
o Or a decisive loss of $3,800–3,825 (opens a deeper corrective leg).
________________________________________
🔝 Key Resistance Zones
• $4,220–4,230 — front-line ceiling; aligns with your tactical short-sell band. Strong candidate to initiate shorts on first, clean tests.
• $4,350–4,375 — prior ATH / macro supply block. Only flips from “sell zone” to “bullish continuation base” if reclaimed and held as support.
🛡 Support Zones
• $3,920–3,930 — primary range low and first major liquidity shelf; ideal first take-profit for shorts and main dip-buy area.
• $3,800–3,825 — deeper support; loss of this level changes the narrative from “sideways digestion” to “larger corrective structure.”
________________________________________
⚖️ Base Case Scenario – Range / Consolidation
Core view: Market continues to oscillate between $3,920–$4,220, within the broader $3,800–$4,350 band.
• Pushes into $4,220–4,230 are sellable for rotations back toward $3,920–3,930.
• Dips into $3,920–3,930 are buyable for rotations back toward $4,220–4,230, as long as structure and flows remain balanced.
• While weekly closes keep rejecting the $4,350–4,375 ATH block, the default remains “sell strength, buy clean range lows.”
________________________________________
🚀 Breakout / Breakdown Triggers
• Bull trigger:
o Sustained acceptance above $4,350–$4,375, with multiple daily closes holding above and that band starting to act as support.
o That would shift tone from “range trading” back to full-on bullish trend, reopening path toward and beyond prior extremes (~$4,400+ in your framework).
• Bear trigger:
o A decisive daily close below $3,800 converts the current “healthy sideways correction” into a deeper, more directional liquidation phase, likely targeting prior lower shelves and expanding volatility.
________________________________________
💡 Market Drivers to Watch
Even in a range, macro and flow catalysts dictate which side of the range gets tested first:
• Real yields & Fed path: Any hawkish repricing or upside surprise in data tends to cap rallies near resistance; dovish shifts / easing fears support the lower end of the range.
• U.S. fiscal / political noise: Episodes of stress typically underpin gold; temporary relief or “risk-on” swings can blunt upside and push price back toward range lows.
• Flows & positioning: After a massive secular run, fast money continues to fade extremes, locking in profits into strength and reloading near range lows.
• Cross-asset behavior: If risk-off hits and gold fails to catch a bid (selling alongside equities), expect deeper probes into the lower end of the range before strategic buyers step back in size.
________________________________________
🔓 Bull / Bear Trigger Lines
• Bullish above: $4,350–$4,375 (sustained acceptance; ATH block reclaimed and used as support).
• Bearish below: $3,800 (shifts from contained range to deeper correction regime).
________________________________________
🧭 Strategy – Focus on Trading the Range
Primary plan – short from resistance (core idea):
• Entry zone:
o Scale into shorts around $4,220–$4,230 (front edge of resistance).
• TP #1:
o $3,920–$3,930 — key range lows; logical place to close majority of the short.
• Runner / extension:
o Leave a runner targeting $3,800–$3,825 if momentum and macro tone turn heavier.
• Risk / invalidation:
o Hard invalidation if price accepts above $4,350–$4,375 (multiple daily closes and successful retests from above).
________________________________________
Alternative plan – buy low from key range lows:
• Entry zone:
o Stagger bids in $3,920–$3,930; add more aggressive size only if we see responsive buying and positive reaction there.
o Optional deeper add zone at $3,800–$3,825 for higher conviction swing longs if structure still looks constructive.
• Exit zone / targets:
o First target back into $4,220–$4,230; heavily de-risk or fully exit as we approach that band.
• Risk management:
o Cut or significantly reduce longs on a daily close below $3,800 or if price accelerates through that shelf on high volume.