NZDJPY: Premium Short Setup Below 89.00 – Seasonality + COT1. Macro Outlook
NZDJPY remains a cross strongly driven by risk dynamics: NZD typically behaves as a risk-on currency, while JPY is a classic risk-off safe haven. The current global environment — characterized by slowing economic momentum, yield volatility, and speculative position rotation — generally supports downside pressure on the cross, although with less linearity compared to the previous quarter.
2. COT (Commitments of Traders)
JPY
Non-commercial traders remain clearly net-long JPY, reflecting a structural preference for Yen strength.
However, weekly changes show:
• –8,589 long contracts closed
• +9,446 new short contracts added
→ This indicates profit-taking and a reduced bullish aggressiveness on the Yen.
NZD
Speculators remain heavily net-short NZD (44k shorts vs 23k longs).
But last week’s flows show:
• +11,287 new longs
• +10,792 new shorts
→ A rebalancing phase rather than a trend reversal; signals uncertainty.
COT Conclusion:
The structural bias remains bearish for NZDJPY, but the pro-Yen speculative impulse is slowing. This increases the likelihood of a short-term bullish retest before further downside continuation.
3. Seasonality
JPY
Historically strong in November–December.
NZD
Neutral-to-weak in November; slightly positive in December but unstable.
The seasonal differential favors NZDJPY weakness between late November and early December, consistent with a move back toward autumn lows.
4. Retail Sentiment
• 83% short
• 17% long
This extreme bearish clustering among retail traders increases the probability of a short-term upside squeeze before macro-consistent downside resumes.
Implication:
⚠️ Avoid selling in the middle of the range
✔️ Only sell from premium levels and with confirmation
5. Price Action
Since August, the pair has been trading inside a structural 84.8–89 range, with highs losing quality and repeated lows — a classic distributive profile.
The recent bounce into 88 pushed price back into upper supply without breaking bullish structure, creating an ideal setup for selling rallies.
RSI remains neutral/slightly bullish but fails to confirm a new high, suggesting a potential bearish divergence that supports the short bias.
🔻 Primary Bias: SHORT below 88.70–89.00
Strategy

MSTR chart update. Bounce to $266-315 before more downside?Updating the prior chart as the levels I had were off. I think it's likely that we bounce from this level.
You can see we've now hit a key support and filled a gap that was on the chart at $176. I think it's likely that we see a strong bounce from this level.
Reasons being:
1. We're at a key support
2. 3 touches of bottom of flag, usually 4th one breaks it, 3rd creates a powerful move in the opposite direction
3. Strong call flow on MSTR the past few days
I think it's likely we bounce up to the $266 or 315 resistance levels. This is a trade, not a long term position to hold.
Let's see if it plays out. Breaking this level as lower support will open up the possibility to see lower levels.

MSTR to $676MSTR is on major support, looking to run to $676 once bitcoin lifts (currently just below it's long term trend buy area).
Good luck!

AdvancedMA Toolkit: From Building Blocks to StrategyAdvancedMA Toolkit: From Building Blocks to Strategy Optimization
This idea explores the full ecosystem behind the
and — a complete environment
for building, testing, and optimizing moving average-based strategies.
We go beyond signals: this is about understanding market structure, parameter sensitivity, and adaptive risk management .
█ CORE PHILOSOPHY: Beyond Signals, Towards Understanding
The AdvancedMAToolkit is not a "magic indicator". It's a strategy development lab that helps you:
Build complex systems from modular MA blocks
Adapt to changing market regimes via dynamic periods
Simulate virtual trading with real-time statistics
Optimize parameters using Auto-RR and multi-objective logic
Find the best sets of strategy related options and risk/reward
Generate 2nd-layer high-conviction signals from main ones
The goal? Find robust configurations — not just high win rates.
█ THE 14 MOVING AVERAGES: When to Use Each
Each MA type has a unique personality. Here's a practical guide:
SMA — Simple Moving Average. Pure price average. Use for baseline trend in Pine Script strategies.
EMA — Exponential Moving Average. Responsive to recent price. Great for entries and momentum detection.
RMA — Relative Moving Average. Like EMA but smoother, including older data
for stable trends.
WMA — Weighted Moving Average. Weights recent bars more. Good for
momentum confirmation.
VWMA — Volume Weighted Moving Average. Volumes give accurate
market sentiment and trend representation.
DEMA — Double EMA. Effective in consolidated trends.
Used to confirm trading signals in volatile markets.
TEMA — Triple EMA. Reduced lag and noise filtering for scalping and
quick reversals.
HMA — Hull Moving Average. Smoothed EMA that reduces lag in strong trends,
responsive to price changes.
ZLEMA — Zero-Lag EMA. Minimizes delay for earlier signals on trend changes
(use cautiously in noisy markets).
FRAMA — Fractal Adaptive MA. Adapts dynamically to volatility for
adaptive smoothing.
SuperTrend — ATR-based trend filter with dynamic support/resistance.
Ideal for stop placement and trailing.
TMA — Triangular MA. Gives more weight to middle data points,
with added lag for smoother trends.
TRIMA — Weighted Triangular MA. Removes random price fluctuations
for cleaner signals.
T3 — Triple-smoothed EMA. Excellent for swing trading with minimal lag
and clean trend lines.
Pro Tip: Combine fast (HMA/ZLEMA) for entries + slow (T3/FRAMA) for trend confirmation.
█ RETEST SYSTEM: The Quality Gate
Instead of taking every crossover, wait for price to retest the MA zone :
Zone % : Distance from MA (e.g., 1.5% = tight zone)
Min Retests : 1 = quick, 3 = high conviction
Triggers : High/Low for entry, Close for exit
Higher retests = fewer signals, higher probability.
Retest Close-Up: Zone touch + min retests (2+ for conviction).
Zones highlight on touch (more intense color) – but signals only if min retests/trigger match (aside from other filters).
█ FILTER STACK: Multi-Layer Confirmation
Momentum Filter : Catches early trend changes (aggressive = more noise)
Fast MA : Entry timing (ZLEMA on price)
Medium MA : Confirmation (EMA on MA)
Slow MA : Trend direction (T3 on close)
Patterns : Inside Bar = consolidation, Engulfing = reversal
Use OR logic for more signals, AND for quality.
█ AUTO-RR & MULTI-OBJECTIVE OPTIMIZATION
The statistics table is your virtual backtester :
RR Base : Focus on risk/reward ratio
Multi-Objective : Balances 4 metrics (RR, Win Rate, DD, PF)
Calculation Methods : Simple, Weighted, Robust Median
Suggested RR : Auto-optimized for current config
How to read it:
→ Profit Factor > 1.5 + Drawdown < 15% = robust
→ Win Rate 60% with PF 1.8 > 70% with PF 1.2
Data Window Highlights: Dynamic Params & RR
Take a look at this little animation demo showing data window with animated ellipses on key metrics (dynamic period, SL/TP)
█ STRATEGY MODES: Match Your Style
OCO Mode : One trade at a time (traditional)
Hedging : Long + Short simultaneously
Pyramid : "Only in Drawdown" = averaging down
Aggressive : "All Signals" = max opportunities
█ DUAL SIGNAL SYSTEM: Main & Table Explained
Main Signals : Crossover + retest + filters → "UP" (Green) / "DN" (Red).
Table Signals : From stats engine → "T UP" (Green) / "T DN" (Red) for high-conviction.
Some key points for Table Signals :
Trade Management : OCO, pyramiding in drawdown, or all signals — full flexibility.
Auto-RR Optimization : 4 modes to auto-tune SL/TP
Dropdown menus : Allow manual parameters or to display/apply recommended ones.
Note:
The Auto-RR system is completely independent, it doesn't take the parameters from the “statistics section” for calculations, not even as initial values, they are based solely on actual price movements (how much profit/loss an order could have made).
Remember: The stats table doesn’t just analyze — it generates real, actionable 2nd-layer signals, for hedging, swing, or custom strategies.
Dual System in Action: Signal Styles & TP/SL Fade Demo
Watch signals evolve with color/line fades, table compact modes on/off, and live TP/SL levels.
█ PRACTICAL BLUEPRINTS
A. Conservative Swing Trader
→ HMA(150), Retest 2+, Slow MA filter, OCO + First Only
→ Focus: PF > 1.5, DD < 15%
B. Active Day Trader
→ ZLEMA(20), Retest off, Momentum + Fast MA, All Signals
→ Focus: Trade frequency + Win Rate stability
C. Quant Developer
→ Use library in custom strategy:
= AdvancedMAToolkit.trend_and_signals("FRAMA", close, 50, true, 2, 200)
Zone Signals & Suggested RR
See a demo of a scrolling chart in action with highlighted zones and auto-suggested RR in table.
█ POWER COMBOS: Pro Tips for Advanced Users
SuperTrend + 3x ZLEMA : Zero-lag trend filter – responsive, low-noise for perpetuals/DAX.
Trigger as Confirmation Filter : Use 'Open' for exits – confirms at next bar opens.
Chaining MA Outputs : Pass one MA as source to another function – efficient for multi-layer setups (avoid over-chaining for speed).
█ FUTURE ROADMAP (ENHANCEMENTS IDEAS)
Custom Metric Weights: Prioritize Return % while stabilizing other metrics.
Reversal Engine: Detect via zone breaks for trend reversals.
Dynamic Position Sizing: Auto-adjust from stats table.
Multi-timeframe Integration: Use security() for higher TF confirmation.
Additional MA Types:
VIDYA — Volatility Index Dynamic MA. Smooth in choppy markets, fast in trends.
KAMA — Kaufman's Adaptive MA. Efficiency ratio-based for volatility adaptation.
ALMA — Arnaud Legoux MA. Gaussian-weighted for minimal lag + smoothness.
Planned for v3.0 – share your ideas in comments!
█ FINAL NOTE
This is a tool for thinkers . The power lies in your ability to:
Understand parameter trade-offs
Backtest across regimes
Combine with volume/order flow
Manage risk properly
Past performance ≠ future results. Use wisely.
═════════════════════════════════════════════════════════
┌──────────────────────────────────────────┐
Deep Dive: Understanding Dual Signals in AdvancedMA Toolkit
└──────────────────────────────────────────┘
The AdvancedMAToolkit is a comprehensive strategy development lab designed to empower traders with modular tools for creating, testing, and refining moving average-based systems. It goes beyond simple indicators by providing a flexible framework that adapts to real market dynamics, encouraging experimentation while emphasizing the importance of visual confirmation on the chart. Let's dive into its core philosophy and practical applications.
CORE PHILOSOPHY: Beyond Signals, Towards Understanding
This toolkit isn't a "magic indicator" that promises effortless profits—it's a strategy development lab that helps you build and iterate on systems with intention. At its heart is the understanding that trading isn't about forcing patterns but recognizing natural market behaviors. The toolkit encourages a balanced approach: use its components to construct setups, but always keep your eyes on the chart to validate results. No automation can replace human intuition in perceiving shifts in market sentiment or anomalies.
Key ways the toolkit supports this:
Build complex systems from modular MA blocks
Adapt to changing market regimes via dynamic periods, where the period can adjust based on volatility or user-defined clamping (min/max limits to prevent extreme swings).
Simulate virtual trading with real-time statistics
Optimize parameters using Auto-RR and multi-objective logic, focusing on realistic Risk/Reward based on historical price movements rather than arbitrary assumptions.
Find the best sets of options and Risk/Reward, tailored to your trading style—whether conservative hedging or aggressive swing trading.
Generate 2nd-layer high-conviction signals from main ones, where filters refine raw outputs into actionable trades without overcomplicating the core logic.
Remember, the goal is to perceive market "personality" through these tools—price scales influence zone % (e.g., 1% on crypto perpetuals might be tight or loose depending on asset volatility), and experimenting with inversions (e.g., decay/restart logic in dynamic periods) can reveal hidden patterns, like turning regression lines into zig/zag for high-limit scenarios.
CORE COMPONENTS: The Building Blocks
Start with the foundational elements that form the toolkit's backbone. The modular MA rotator allows seamless switching between 14 types, each suited to different market conditions. For instance, HMA or ZLEMA excel in trending environments, while FRAMA or SuperTrend adapt to volatility spikes. The trend_and_signals function generates raw main signals based on crossovers, retests, and filters.
The dynamic period feature is key here: it adjusts MA lengths based on market regimes, with options for exponential growth/decay or clamping to avoid overextension. Inverting decay/restart logic might seem counterintuitive at first, but it can highlight non-linear behaviors—e.g., on DAX or crypto, where price frequency doesn't always form stable patterns, this inversion turns "noise" into insight, like perceiving manipulated liquidity grabs as deviations from natural trends.
Triggers add nuance: use high/low for zone touches (entry/exit on extremes) or open/close for bar confirmation (safer in volatile perpetuals). This flexibility lets you align with asset character—e.g., on high-frequency crypto, open triggers for zones reduce false breaks, while high/low works for directional bias.
PARAMETER TUNING: Finding the Sweet Spot
Tuning is where the toolkit shines, blending manual control with automated insights. Core parameters (e.g., Factor for dynamic period, regression line lookback) interact with stats section for holistic optimization. Start with dynamic period limits: set min/max clamping to bound adaptations – a high-pass/low-pass filter that cuts fast/slow ranges for targeted regime shifts.
The Auto-RR system (4 modes) tunes SL/TP independently, based solely on price movements—not initial stats params. "Suggested" mode displays optimized values (e.g., RR 1:2 for both sides) without applying them progressively – if you insert manually, results differ because it skips bar-by-bar historical recalculation, applying them in a 'static way' at each bar (no historical evolution). In "Auto-Apply" mode, it recalculates dynamically on every bar (e.g., bar 0: 1:2, bar 1: 1.3:2.1, bar 2: 1.2:2.3), ensuring full dataset evolution matches the display.
Experiment with high general periods (e.g., 5000+ lookback): regression lines turn into zig/zag ("clipped waves" like audio peaks beyond scale) – not errors, but insights into deviations or manipulations. Always cross-check with eyes on the chart: tweak % zones for asset scale (e.g., 1% tight on crypto perpetuals, loose on indices) if they feel mismatched (too expanded/contracted) – no auto-scaling yet (future idea?), but visual feedback guides adjustments. Switch MA types (e.g., VWMA for volume-weighted insights) if needed, at the end of the journey, the circle starts at MA and after gradual test of parameters combinations it turns back to MA, that in these cases remain the last tweak when all the rest is properly settled.
FILTERS & COMBINATIONS: Layering for Precision
Filters are the toolkit's secret weapon for refining signals without overwhelming the system. The fast filter (price-based) pairs well with momentum for quick momentum plays, while medium holds up in combos with fast + momentum. Slow adds stability but can over-filter if not lightened.
Key combos to test:
Fast + Momentum: Lightweight, ideal for high-frequency assets like crypto perpetuals – use for initial signal pruning.
Fast + Momentum + Patterns: Holds in volatile markets; patterns add robustness without excess lag.
All Filters (Fast + Medium + Slow + Patterns): Reduces signals drastically – use sparingly, as ❝too much is less❞ (over-filtering). On DAX, medium + slow might outperform full stack; on crypto, fast + momentum often suffices.
Standalone Patterns: Surprisingly effective alone for visual confirmation – experiment by disabling others.
Associate with dynamic period: lighter filters (fast/momentum) pair with aggressive dynamic settings; heavier (medium/slow) with clamped periods. The goal? Balance: too many filters choke opportunities, but strategic combos (e.g., fast + slow without medium) can surprise. Always monitor core signals as "raw" baseline – filters refine, but don't replace chart intuition.
Pro Tip for Power Users: SuperTrend is the star here (ATR-based levels for dynamic support/resistance). Pair it with ZLEMA in all 3 filters for low-lag setups – e.g., SuperTrend + 3x ZLEMA creates a "zero-lag trend filter" that's responsive without noise, perfect for perpetuals or DAX. Triggers enhance this: use 'Open' for exits to confirm if the next bar opens in the signal zone, acting as a built-in validation filter.
ADVANCED EXPERIMENTATION: Unlocking Hidden Dynamics
Push the toolkit further with targeted tweaks. Invert dynamic period decay/restart for non-standard insights: on high lookback, regression becomes zig/zag – intentional "volume up" to spot peaks/outliers, revealing liquidity grabs or manipulations as deviations from natural patterns.
Scale awareness is crucial: % zones vary by asset (1% tight on crypto, loose on indices like DAX) – no auto-scaling yet, but manual adjustment + chart eyes spot mismatches (zones too stretched/contracted = tweak % or MA type). Frequency/TF influence: high-frequency perpetuals favor fast triggers (open for zones), while lower TF need high/low for extremes.
Combine with volumetrics (future integration): use gravity centers from higher TF as retest zones – if prices bounce/break, it's a signal. Add volatility auto-correlations for "perceiving" present moves (vol real = money), vs technical as "past photo". This hybrid turns the toolkit into a full strategy lab.
For Quantum Developers: Chain MA outputs as source to another function call – e.g., use one MA result as input for a second trend_and_signals(). It's efficient (no major speed hit), but avoid over-chaining to keep performance crisp.
Experimentation Fade: Zig/Zag & Variant Entries
See a fade through preset changes, regression zig/zag, and entry variations on same chart.
INTEGRATION WITH REAL-TIME ANALYSIS: The Volumetric Bridge
While the toolkit excels in technical "past photos" (patterns, trends), pair it with volumetrics/order-flow for "present" edge. Find volumetric gravity centers on higher TF – use as additional retest: bounce = confirmation, break = reversal. Auto-correlate volatility to gauge market character – smooth for chop, fast for trends.
This synergy: toolkit for setup/optimization, volumetrics for execution. No gaps in order-flow = precise entries; toolkit's stats refine MM (OCO for hedging, pyramiding in drawdown for recovery). Result: perceive manipulations (liquidity grabs as "unnatural" deviations) and trade with conviction.
CONCLUSION: Empower Your Trading
The AdvancedMAToolkit is your lab for crafting strategies – experiment freely, but always verify on the chart. From core MA to filtered signals, it's designed for flexibility without forcing trades. Future volumetric integration will elevate it further. Share your setups in comments!
(For the Auto-RR: 4 modes tune SL/TP based on price alone – independent, forward-looking. Test on perpetuals for scale insights.)
══════════════════════════════════════════════════════════
🛡️ Essential Disclaimer & Final Note
This is a sophisticated analytical tool for education, research, and strategy development. The statistics are based on historical data and virtual trading. Past performance is not indicative of future results.
You must do the following:
Understand the logic behind every setting you change.
Thoroughly backtest across different market conditions (trending, ranging, volatile).
Practice sound risk management, including appropriate position sizing, before ever considering live trading.
The power of this tool is directly proportional to the understanding and discipline of the user. It is designed not to give you easy answers, but to help you ask better questions and find robust, personalized trading solutions.

Bullish Analysis. (Gold) SL Hit🟦 POST READY TO SHARE
📉 Losing Trade… with the Right Analysis (XAU/USD)
Today I’m sharing a trade that ended in Stop Loss, but delivered a huge lesson.
And yes — I don’t only post winners. Transparency builds real traders.
🔍 What was the idea behind the trade?
• Mitigation of the FVG
• ChoCH at demand
• Reaction at the 5M OB
• Fake Out sweeping liquidity
• BOS confirming bullish intent
• Full institutional sequence:
Liquidity → Mitigation → Rejection → Expansion
🎯 So, what happened?
Price completed:
✔ The liquidity sweep
✔ The mitigation
✔ The rejection
✔ The bullish BOS
✔ The entire push to TP1 and TP2
BUT before taking off…
👉 it swept my SL by just a few pips.
Classic gold manipulation.
🧠 Professional lesson
This wasn’t a bad analysis.
This wasn’t misreading structure.
It was gold doing what gold does — deeper liquidity sweep before expansion.
This doesn’t invalidate my idea.
It validates my vision.
💬 Motivational message
“Great traders aren’t built by wins… they’re built by process.
A losing trade doesn’t lower your level — it sharpens it.
Those who only show wins aren’t growing…
those who show the journey build consistency.”

Xauusd SignalXauusd Now Below Supply Zone We Have Best And Strong Selling Opportunity if you Can Take Risk
Sell Xauusd At 4126 To 4162
Take Profit Around 4025 To 3930
Depending On Your Equity How You Can Take Risk
Note It's Not Financial Advice Keep Buy Sell Your Own Research
Stay Alert For More Updates

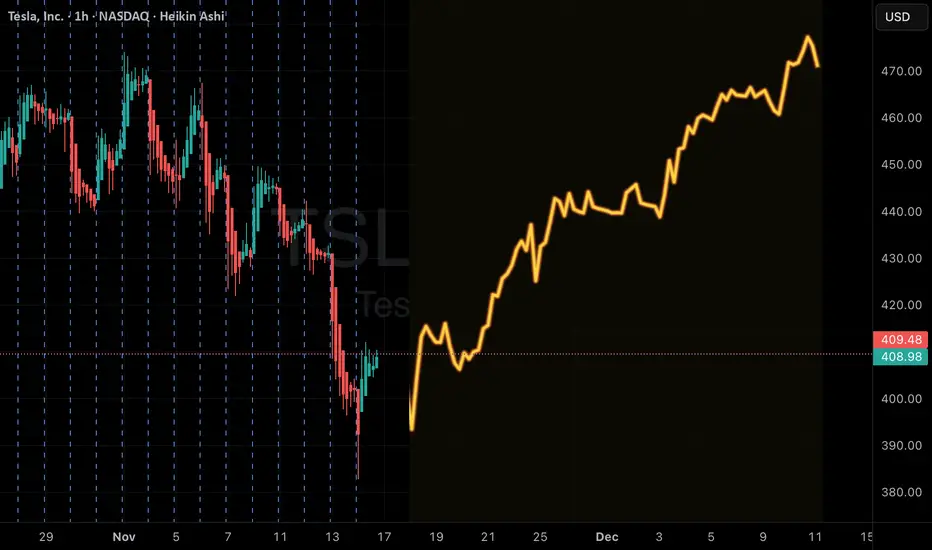
TSLA V3 Weekly Alert — Deep ITM CALL SignalTSLA QuantSignals V3 Weekly 2025-11-14
AI & Technical Forecast
Katy AI Target: $421.69 (+3.2% upside)
Expected Dip: $390.59 Monday before mid-week recovery
Momentum: Strong weekly uptrend, MACD bullish, EMA alignment confirms uptrend
Support: $402.40
Resistance / AI Target: $421.69
Insights:
Friday expiration entry offers volatility discount; deep ITM call captures most delta with minimal extrinsic loss
PCR 3.30 → institutional put-heavy positioning, creating potential contrarian opportunity
Event Risk: Elon Musk fireside chat (Friday 1:05 PM ET) may spike volatility
🎯 Trade Setup
Parameter Value
Direction CALL
Strike $370.00
Entry $40.30–$40.55 (mid: $40.42)
Target 1 $46.00 (+13.8%)
Target 2 $52.00 (+28.6%)
Stop Loss $35.05 (–13.3%)
Position Size 2–3% of portfolio
⚡ Key Advantages
Deep ITM structure → high delta exposure (stock-like behavior)
Limited extrinsic value → reduces theta and IV crush risk
Timing aligned with post-event momentum and mid-week recovery
Risk/Reward ~2.15:1 (Target 1 vs stop)
🚨 Risk Notes
PCR 3.30 → extreme hedging/fear; stop may trigger quickly
Theta decay accelerates Mon-Wed; manage positions carefully
Deep ITM calls → wider spreads; use limit orders
Consider scaling out at Target 1 to reduce gamma exposure
Summary:
TSLA deep ITM weekly call provides contrarian, medium-conviction bullish exposure, leveraging AI trajectory and technical alignment. Suitable for 7-day horizon with disciplined risk management.
BTCUSD | London Session | Bullish Structure BalanceThe monthly bullish structure balance has now been filled, and the higher-timeframe map remains intact.
BTC continues to rotate inside a bullish range and is still positioned in the discount zone.
Range boundaries:
• Range low (invalidation): 78.167
• Range high (continuation): 123.231
As long as price holds above the range low, the bullish bias stands.
- Market Structure Mapping (MSM) — Current View
The structural picture is straightforward:
BTC is holding a clean range.
There is no breakdown. No structural shift.
The architecture is stable.
Cross-market structure adds context:
• The U.S. dollar sits directly on a major volume node.
If the dollar pushes higher from here, risk assets usually feel it.
If the dollar softens, crypto keeps its bullish rotation.
• FX majors recently cleared liquidity lows, resetting the structural map.
• Crypto majors remain balanced with no directional damage.
This is a classic data-waiting phase.
The structure is already drawn. The market is waiting for a catalyst to decide the next expansion path.
- Precision Execution Modeling (PEM) — Guidance for Volatile News Days
When heavy data is on the calendar, PEM shifts the playbook:
• Do not react to the first spike.
The wick is emotion. The candle close is intent.
• Step back to higher timeframes.
4H and 1D candles filter out noise and reveal real direction.
• Expect wicks to violate levels without changing structure.
Large funds do not trigger algorithms on a random spike; they react to confirmed structure.
• Protect capital until the market shows its hand.
In fast conditions, patience is a position.
CORE5 :
If you need excitement, watch Netflix. If you need results, wait for the candle close.
— CORE5DAN
Institutional Logic. Modern Technology. Real Freedom.

Xauusd Update Xauusd Breakout Last Resistance
Now We Have best Buying Opportunity
Around 4162
Tp 4372
Sl 4088
Buy Sell Your Own Research I Am Not Responsible Of Your Any Lose
Stay Alert For More Updates

USDCAD: Institutions Accumulating? Perfect Pullback Into FVG1. MACRO & COT FRAMEWORK
COT – CAD
→ Speculators remain heavily net short on CAD.
The Canadian dollar shows a massive net-short imbalance, exceeding 100k net contracts.
Speculators are still selling CAD aggressively → supportive for upside continuation on USD/CAD.
COT – USD
→ USD is still net short overall, but positioning is shifting.
The dollar is beginning to reverse positioning: fewer shorts + more longs = improving USD strength.
→ Overall COT environment favors further upside for USD/CAD.
2. RETAIL SENTIMENT
Retail Longs: 51%
Retail Shorts: 49%
Retail is almost evenly split, slightly long.
This is mostly neutral, but historically, when sentiment is balanced, price tends to follow institutional flows → which remain long USD/CAD.
Sentiment confirms a bullish bias.
3. SEASONALITY (USD/CAD – November)
November is historically a slightly bullish month for USD/CAD.
The 20-year, 15-year, and 10-year composites all show a positive seasonal tendency.
The current month is tracking a similar pattern.
Seasonality supports a long bias into the second half of November.
4. TECHNICAL ANALYSIS
The pair remains in a structurally bullish uptrend with a clean ascending channel.
Higher highs and higher lows confirm trend integrity.
Price is currently correcting toward the mid-range of the channel.
The market is entering a Daily FVG between 1.3950 – 1.3980.
A prior sweep has already tapped the lower trendline, adding confluence.
Immediate Support Zone
1.3950 – 1.3980 (FVG + structural support)
→ ideal area for long accumulation.
Upside Target:
1.41500 → clear liquidity level above previous swing high.
RSI remains above 40 and cooling off, indicating a healthy pullback within a bullish trend.

SLS SELLAS Life Sciences Group Options Ahead of EarningsAnalyzing the options chain and the chart patterns of SLS SELLAS Life Sciences Group prior to the earnings report this week,
I would consider purchasing the 3.50usd strike price Calls with
an expiration date of 2027-1-15,
for a premium of approximately $0.52.
If these options prove to be profitable prior to the earnings release, I would sell at least half of them.

The Power of One Setup: Variety Kills ConsistencyMost traders chase new strategies, indicators, and secret signals. Progress rarely comes from adding more. It comes from mastering one thing deeply.
The fastest path to consistency is one setup traded a thousand times, until execution becomes automatic.
Every setup has a rhythm. Market conditions, timing, management. When you rotate through styles, you reset the learning curve repeatedly.
Specialization compresses uncertainty. You see the same context, the same triggers, the same mistakes, which tightens execution and accelerates feedback.
Switching setups leads to inconsistent entries, inconsistent risk, and mixed data. You cannot tell what actually works because the sample is polluted.
Professionals remove variables. They keep the market changing while the method stays constant.
Turn the setup into a rulebook.
• Market conditions: trend, range, volatility threshold, session.
• Structure: levels, pattern shape, invalidation logic.
• Entry: trigger candle, confirmation, timing window.
• Risk: stop location, size per trade, max daily loss.
• Management: partials, move to break even, trail or fixed target.
Mastery does not come from more information. It comes from repetition and refinement.
You do not need more strategies. You need fewer distractions.

EURAUD: Institutional Buying Pressure & Bullish November SetupThe pair has broken out of the descending channel and is now forming a new ascending structure.
Price reacted strongly from the 1.7550–1.7600 demand zone, which aligns with a key structural support and an oversold RSI area.
The current consolidation phase is unfolding below a daily inefficiency (gap) around 1.7800–1.7920, which represents the first bullish target.
If the bullish structure holds, we could see a three-wave move towards 1.7920, with a potential mid-term pullback to 1.7700 before the next impulsive leg.
🔹 2. COT Report
Euro (EUR)
Non-commercials: 252k long vs 138k short → net long
Commercials: strongly net short
Weekly change: +2.6k shorts / -789 longs → slightly reduced bullish momentum
➡️ EUR remains fundamentally strong, though speculative momentum has slightly cooled.
Australian Dollar (AUD)
Non-commercials: 42k long vs 101k short → deeply net short
Shorts increased by +10k this week, indicating renewed institutional bearish pressure.
➡️ AUD remains weak with a clear bearish bias.
👉 Overall COT bias: favors EUR strength and AUD weakness, supporting a bullish view on EURAUD.
🔹 3. Seasonality
EUR typically strengthens in November, especially during the last 10 days of the month (+0.003 / +0.004 average).
AUD historically shows November weakness across 10Y, 5Y, and 2Y averages.
➡️ Seasonal patterns support the bullish case for EURAUD, aligning with COT positioning.
🔹 4. Retail Sentiment
70% short vs 30% long
➡️ Retail traders are heavily short, providing a contrarian bullish signal.
📈 Conclusion
The medium-term bias remains bullish on EURAUD, with potential upside extension toward 1.7920, and possibly 1.8050 if macro momentum persists.
The key support to defend lies at 1.7600 / 1.7550.
A daily close below this level would invalidate the bullish scenario and reopen the path toward 1.7400.

$MSTR bounce above $300 before falling further?Ever since Early October, MSTR has been falling. We've now reached the bottom of a flag structure and I'd expect a bounce here before we fall further.
I think the most likely path from here is that we see a rally into the $300 zone, however, it's possible that we can go up to the top of the flag before falling further.
That said, if we get a rally, it'll be a rally you want to sell because eventually I think we're heading down to the $100 level before you want to become a long term buyer.
I've marked off key resistances on the path up to take profits on a long, should the rally play out from here.

EUR/USD at the Edge: Bounce Before Breakdown?🧩 Macro & COT Context
(Note: data frozen as of September 23 due to CFTC shutdown)
The latest available COT report showed non-commercial traders still net long on EUR (≈ +114K contracts), but with a steady increase in both commercial longs (+4.9K) and commercial shorts (+3.3K) — signaling a more balanced positioning. Meanwhile, the USD Index showed a slight pickup in long exposure (+1.5K), hinting at a gradual shift toward USD strength until updated data resumes.
💭 Sentiment
Retail traders are 67% short vs 33% long, a typical contrarian setup where the crowd is selling the pullback. This supports a short-term bullish bounce, but only until the next supply zone is reached.
📈 Seasonality
Historically, November has been a neutral-to-bearish month for EUR/USD (-0.0021 on 20Y average; -0.0063 on 10Y). The pair tends to weaken during the second half of the month, before recovering into December.
📊 Technical Structure (Daily Chart)
Price remains inside a descending channel since late September, recently retesting the upper boundary and supply area at 1.1570–1.1710, where a clean rejection formed.
RSI holds below the midline (~45), confirming weak momentum.
The overall structure stays bearish, with room for continuation toward the 1.1380–1.1400 demand zone, aligning with both channel projection and liquidity targets.
Main Bias: Short continuation
Sell Zone: 1.1570–1.1620 (upper channel + supply)
Target 1: 1.1400
Target 2: 1.1350 (weekly liquidity pool)
Invalidation: Daily close above 1.1715
Summary
📊 COT (last update): EUR still net long → neutral bias until new data
📉 Seasonality: Historically weak November
📈 Sentiment: Retail short → short-term bullish bounce possible
🧭 Technical Bias: Bearish below 1.1715

CANSLIM Overview📘 CANSLIM Overview — The 7 Traits of Big Stock Winners
CANSLIM is an acronym developed by William J. O’Neil, founder of Investor’s Business Daily (IBD) and author of How to Make Money in Stocks.
It describes the seven common characteristics shared by the biggest winning stocks before their major price moves.
The system blends fundamental growth, institutional behavior, and market timing—and is grounded in historical quantitative studies dating back to the 1800s.
🧩 The Acronym:
Letter Stands For Core Concept
C Current Quarterly Earnings Explosive short-term earnings growth
A Annual Earnings Growth Multi-year compounding of profits
N New Product, Service, or Management Innovation driving market leadership
S Supply and Demand Stock’s float size and institutional accumulation
L Leader vs. Laggard Relative strength and group leadership
I Institutional Sponsorship Quality fund ownership and buying pressure
M Market Direction Aligning with the general market trend
1️⃣ C — Current Quarterly Earnings: Big Growth, Not Modest Growth
“The biggest winners showed three consecutive quarters of 25%+ growth, but the best averaged 70%+ before their runs.”
Measure this quarter vs. the same quarter last year, not sequentially. This avoids seasonal distortions.
Ideal Growth Rate:
Minimum: +25% YoY EPS growth for 3+ quarters
Stronger filter: +70–100% or even triple-digit earnings growth
Combine with revenue growth of 30–50% or more.
Stocks with massive EPS and sales growth attract institutional attention early.
Modern Adjustment:
Today’s growth leaders (e.g., NVDA, TSLA, PANW) still show these patterns, though some use non-GAAP EPS or adjusted metrics. The concept—explosive profitability inflection—remains identical.
2️⃣ A — Annual Earnings Growth: Sustained Profitability
“Look for at least three years of annual earnings increases.”
Consistency is key. Accelerating growth adds conviction.
Avoid one-time spikes or negative earnings trends.
Favor firms with 3+ years of 20%+ annual EPS growth and positive forward analyst estimates for continuation.
Analyst Upward Revisions are particularly powerful—funds often buy on these changes.
Interpretation:
Multi-year profit acceleration shows management execution, competitive edge, and strong demand.
Example: O’Neil’s model studies (1952–2001) showed 73% of winners had +70% EPS growth the quarter before their breakout and 3+ years of rising annual profits.
3️⃣ N — New Product, Service, Management, or Market Catalyst
“You want the next Apple, not the next RCA.”
Innovation is the engine of multiple expansion. The “new” can take many forms:
Breakthrough product or service
Transformative business model
New leadership or management
Market share disruption
Examples (then and now):
Apple (iPhone), Tesla (EVs), Nvidia (AI GPUs), Uber (gig economy)
Earlier eras: IBM, Home Depot, Microsoft
Psychological angle: Human nature craves novelty. The market rewards perceived future dominance, not current stability.
4️⃣ S — Supply and Demand: The Float Matters (Less Now)
Originally, O’Neil favored smaller floats (≤50–70M shares) since limited supply + strong demand = sharp price moves.
“It’s less critical today—large caps can still double or triple. Focus on quality, earnings, and leadership over share count.”
The principle still holds but is muted due to:
ETFs, passive flows, and massive institutional liquidity
Widespread retail access and option leverage
The core idea remains: price rises when demand exceeds supply, visible via volume surges.
Modern adaptation:
Monitor volume spikes, accumulation/distribution, and relative volume ratios over absolute float size.
5️⃣ L — Leader vs. Laggard: The Power of Relative Strength (RS)
“Buy the strongest stocks in the strongest groups during a confirmed uptrend.”
O’Neil found each bull cycle is led by 2–3 dominant industry groups (e.g., semiconductors, software, solar).
Within those, only the top few names outperform meaningfully.
Key Filters:
Relative Strength (RS) Rating: 85–99 (top 15% of market)
Leading groups by RS, EPS growth, and fund buying
Avoid laggards even within strong sectors.
Modern context:
Institutional algorithms still chase relative momentum. RS-based filters would be Ideal.
“When you have the strongest stocks, in the strongest sectors, in an uptrend—and you use disciplined stop-losses—it’s very hard not to make money.”
6️⃣ I — Institutional Sponsorship: The Smart Money Footprint
“70% of market volume comes from institutions—follow their footprints.”
Institutions (mutual funds, hedge funds, pension plans) create sustained demand that drives major trends.
Key things to watch:
Rising number of institutional holders quarter-over-quarter
Presence of high-quality funds (e.g., Fidelity Contra, Vanguard Growth)
Volume patterns on charts confirming accumulation
Quantitative Significance:
Example: Zoom (ZM)—278 funds → 1,413 funds within 7 quarters (5× increase)
Enphase (ENPH)—160 → 1,008 funds in 8 quarters
Such surges often precede parabolic price advances.
7️⃣ M — Market Direction: The Most Critical Factor
“If you don’t get the M right, nothing else matters.”
O’Neil’s data showed:
3 out of 4 stocks follow the general market trend.
Even perfect fundamentals fail in bear markets.
Core Rule: Only buy aggressively during a confirmed market uptrend.
The signal is the Follow-Through Day (FTD)—a +1.5% or greater gain on strong volume, typically 4–10 days after a market low.
When the Market Is Choppy or Bearish:
Reduce exposure or move to cash (cash is a position).
Focus on capital preservation over prediction.
⚠️ Risk Management — The “Eighth Principle”
“You can be right 1 out of 3 times and still make a fortune—if you cut losses fast.”
O’Neil borrowed from Jesse Livermore and Bernard Baruch’s philosophy:
Max loss per trade: 7–8% (ideally 5%)
Never average down; if it fails the breakout, sell immediately.
Emotional capital matters as much as financial capital.
Risk Math:
Loss Required Gain to Break Even
7% +7.5%
20% +25%
50% +100%
→ The deeper the drawdown, the harder recovery becomes — and the worse your discipline gets.
Cutting losses early keeps both capital and confidence intact.
Advanced Discipline:
Always use stop-losses near pivot points
Size positions so that total portfolio risk ≤1–2% per trade, and the Reward is 3x your risk.
Expect that most trades won’t work; winners will more than offset losers
🔢 Practical CANSLIM Checklist
Step Criterion Target Metric
C Current quarterly EPS growth ≥25%, ideally 70%+
A Annual EPS growth 3 consecutive years ≥20%
N Innovation or catalyst New product/service/management
S Supply-demand imbalance Volume > average, low float optional
L Leadership RS ≥85; top 3 names in top sector
I Institutional ownership Increasing QoQ, ≥2 top-tier funds
M Market trend Confirmed uptrend via FTD
Risk Stop loss 5–8% below entry, always enforced
🧠 Psychological Cornerstones
Human nature never changes. Fear and greed drive every cycle—from 1800s railroads to 2020s AI stocks.
Discipline beats prediction. Entry precision is less important than loss limitation.
Conviction comes from quality. Big winners are clear leaders with strong fundamentals.
Cash is a position. Avoid trading in “cold decks” (sideways or down markets).
Emotion control = longevity. Protect your confidence as much as your capital.
🧩 Modern CANSLIM Adaptations
While CANSLIM’s DNA remains timeless, modern quantitative investors integrate:
Relative Volume & RS Ranking (machine-scored)
EPS revision momentum (analyst upgrades)
Institutional rotation data (13F filings, ETF flows)
Macro context: liquidity cycles, Fed policy, credit spreads
Technical refinements: base patterns, volume dry-ups, and volatility contraction setups (VCP).
💬 Summary Insight
“Nothing has changed since the 1800s—only the tools.
Human nature and crowd behavior are constants.”
CANSLIM is a structured behavioral framework for spotting institutional accumulation of fundamentally superior companies at the right time in the market cycle.
Its greatest edge lies not in stock-picking, but in discipline—knowing what not to touch, when to cut, and when to press.
Here is the Screener I use.
www.tradingview.com
NZD/USD: A Trap for Early Buyers? Retail 90% Long1️⃣ Technical Context
NZD/USD is trading around 0.5630, within a descending channel that started in mid-July. After testing the lower boundary of the channel and the demand zone between 0.5570–0.5620, price reacted with a mild technical bounce — yet without any structural reversal confirmation.
The daily RSI shows a bullish divergence and remains above 30, signaling a possible short-term rebound toward 0.5750–0.5800 before a potential continuation lower.
Key Levels
Resistance: 0.5750 / 0.5820 (upper channel + prior supply)
Support: 0.5570 / 0.5500 (demand + channel bottom)
Technical Bias: bearish while below 0.5820, but short-term corrective potential toward the upper channel remains.
2️⃣ COT Data (latest available report)
NZD Futures (CME):
Non-commercial: Long +3,044 | Short +6,160 → rising net short exposure.
Commercial: Long +2,869 | Short -286 → commercials remain hedged, confirming structural weakness in NZD.
USD Index: Non-commercials remain net short but are reducing exposure, signaling gradual USD strength.
→ Interpretation: COT data confirms a pro-USD, bearish bias on NZD, consistent with the broader technical trend.
3️⃣ Seasonality
Historically, November is slightly positive for NZD/USD, especially in shorter time frames (5–2 years).
20 years: -0.001
10 years: -0.003
5 years: +0.004
2 years: +0.005
→ Suggesting a short-term recovery phase in early November, followed by renewed weakness later in the month.
4️⃣ Retail Sentiment
Long: 90%
Short: 10%
Average long price: 0.5766
→ The overwhelming long positioning suggests many retail traders are trying to catch a bottom, which raises the risk of further downside pressure in the short term (potential liquidity sweep below 0.56).
5️⃣ Trading Outlook
Overall Bias: bearish with a short-term corrective potential.
Main Scenario:
→ Pullback toward 0.5750–0.5800 (upper supply zone), then likely continuation lower toward 0.5550–0.5500.
Alternative Scenario:
→ A daily close above 0.5820 would invalidate the bearish setup and open room toward 0.5950.
Confluences:
✅ RSI bullish divergence
✅ Short-term positive seasonality
⚠️ Retail extremely long
⚠️ COT bearish for NZD

GBP/JPY – Bearish Continuation Setup | Possible Pullback to 2031️⃣ Technical Context
On the daily chart, GBP/JPY is trading around 201.12, moving inside a descending channel that began in mid-October. Price action has recently tested the lower boundary of the channel and the 200.00–200.70 demand zone, showing a short-term bullish reaction but no confirmed structural reversal yet.
The RSI daily near 30 suggests a potential short-term rebound but no confirmed bullish reversal.
Key Levels
Resistance: 203.50 / 204.50 (upper channel + previous supply)
Support: 200.00 / 199.00 (demand + psychological level)
Technical Bias: Bearish below 203.50; only a daily close above 204.00 would invalidate the bearish setup.
2️⃣ COT Data (stable due to shutdown)
Latest available report:
JPY: Net long positions increased by +14,727 among non-commercials, while commercials remain heavily short (hedging). This indicates a structural strengthening of the Yen.
GBP: Net short positions remain stable (-3,392), with a slight increase in non-commercial longs (+3,704) but not enough to shift sentiment.
→ Interpretation: The COT context confirms a pro-JPY bias and weak GBP outlook, maintaining a bearish fundamental bias for GBP/JPY.
3️⃣ Seasonality
November seasonality shows a negative pattern for GBP/JPY, especially on the 10–20 year horizon.
20-year avg: -0.69%
10-year avg: -1.31%
Only the 2-year cycle shows a mild positive move (+0.88%), suggesting that mid-term seasonality supports bearish pressure until mid-November, followed by a potential technical rebound later in the month.
4️⃣ Retail Sentiment
Short: 64%
Long: 36%
Most retail traders are short, with an average short entry around 195.98, well below the current market price at 201.
→ This means the majority are still in profit, which increases the likelihood of a short-term bullish squeeze before the next downward move resumes.
✅ COT favors JPY strength
✅ Seasonality remains negative for GBP/JPY
✅ Technical structure confirms lower highs
⚠️ Retail positioning suggests possible short-term fakeout to the upside
GBP/JPY remains in a bearish continuation context, consistent with Yen strength and negative seasonality. However, a technical pullback toward 203.00–203.50 is likely before a renewed bearish impulse targeting the 198.50 area.

GBP/USD — The Trap Above 1.32 Before the Real Drop BeginsGBP/USD continues its bearish momentum after rejecting the major supply zone around 1.3450–1.3600.
From a structural perspective, price has formed a clear series of lower highs and lower lows, confirming the bearish continuation setup.
📉 Macro Context:
COT data (delayed due to the U.S. government shutdown) still shows a fragile Pound: non-commercial traders are almost balanced but with a slight reduction in shorts, while commercials remain heavily short. Meanwhile, the Dollar Index COT reveals a growing long positioning — a clear sign of renewed USD strength.
Sentiment: 82% of retail traders are long on GBP/USD → a strong contrarian signal.
Seasonality: November is historically weak for GBP/USD, showing a negative tendency in 10- and 15-year averages.
🔎 Technical Setup:
After a failed attempt to reclaim the 1.33–1.34 range, the pair dropped aggressively.
A short retracement toward 1.3150–1.3200 could serve as a liquidity grab before further downside continuation.
As long as price remains below 1.3270, the bearish bias remains intact.
🎯 Key Levels:
Resistance: 1.3150 – 1.3200
Support: 1.3000, 1.2850, then 1.2750
Invalidation: Daily close above 1.3270
🧩 Bias: Bearish continuation

USDJPY | Liquidity Sweep Before Year-End RallyUSD/JPY remains structurally bullish within a broad ascending channel that has defined price action since mid-2024. Despite recent pullbacks, momentum remains positive while price trades above the 151.50–152.00 structural support, aligning with the broader macro bias of USD strength and JPY weakness.
1️⃣ Seasonal Bias
Historical data from Market Bulls shows that November tends to favor USD/JPY upside, with an average gain between +0.8% and +1.2% across the 10- to 20-year datasets. This month’s seasonal strength often follows October consolidations, suggesting continuation potential toward year-end highs.
2️⃣ COT Positioning (Commitment of Traders)
USD Index: Non-commercials increased net longs by +1,541, confirming a persistent bullish bias on the USD side.
JPY Futures: Non-commercial traders added a significant +14,727 long positions, but commercial hedging remains heavily long, indicating that institutional demand is more protective than speculative.
The divergence implies temporary JPY strength, but the overall positioning still favors USD dominance in the medium term.
3️⃣ Sentiment Data
Retail traders remain 60% short vs 40% long on USD/JPY, providing a contrarian bullish signal. Historically, retail positioning against trend continuation adds conviction to a potential bullish extension.
4️⃣ Technical Structure (Daily Chart)
Price is consolidating near 153.40, just below the upper boundary of the ascending channel. A short-term pullback toward 152.00–151.50 could act as the liquidity grab zone before continuation.
Support Zone: 152.00 → 151.50
Key Demand Area: 150.50 (aligned with prior daily gap and mid-channel support)
Resistance Zone: 155.50 → 156.00 (upper trendline projection)
RSI: Currently neutral (~52), suggesting there’s still room for upside momentum before reaching overbought conditions.
The market may engineer liquidity below 152 before a bullish reaction targeting 155.50 and potentially the 156.80 macro extension zone by mid-November.
5️⃣ Confluence Summary
✅ Seasonality: Bullish
✅ COT: USD stronger bias vs JPY
✅ Retail Sentiment: Contrarian bullish
✅ Structure: Bullish continuation pattern within channel
⚠️ Short-term Risk: Liquidity sweep below 152

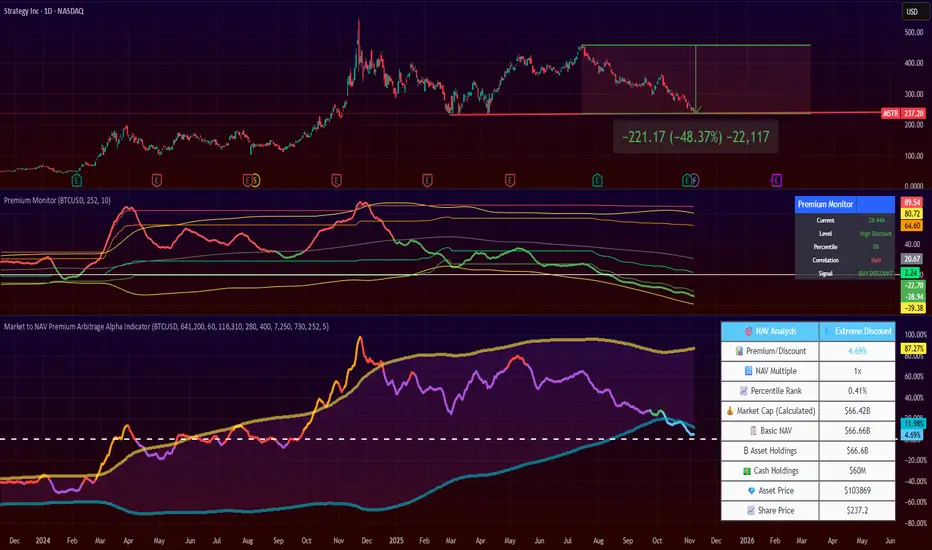
Strategy's Premium is Gone. Time to Load? 4 months ago, I posted that NASDAQ:MSTR premium was unsustainable and the stock price would drop.
Since then, the price dropped by 50%!!
Now, Strategy's is close to zero, and I flip my views on it.
If you like this kind of trade, it might be a good time to start DCA'ing it.
Note that Strategy continues to be a highly volatile stock, more volatile than Bitcoin itself.
Finally, the stock is now at a technical resistance level.
You can keep an eye on the premium/discount of this stock by looking at my 2 indicators:
Market to NAV Premium Arbitrage Alpha Indicator , and
Asset Premium/Discount Monitor
MSTR further downside but looking exhaustedNASDAQ:MSTR Price continues range bound in a complex wave 4 correction, notoriously hard to analyse. The trend is down but looks exhausted.
Wave Y can complete any time in this flat correction pattern but is approaching the previous swing low and the 0.236 Fibonnacci retracement.
Daily RSI has printed bullish divergence but price continues lower. IF pice breaks down further the next target is $185 where price may find a bottom.
Recovering the daily 200EMA is the first goal.

$MSTR still bullish at supportstrategy has lately been underperforming compared with simular assets. It's stuck in this arc and the diagonal line. When it finds support and breaks the arc you will teleport to the next arc. This gets invalidated when breaking to the downside!
