EURGBP at Supply – Short Setup Ahead?EURGBP is testing a key supply zone while also entering the overbought region.
Sellers could step in here, making it an interesting area to look for shorts.
However, if buyers manage to break above, further bullish continuation may follow.
⚡ What do you think?
👉 Will the bears take control, or will the bulls push through?
📚 Always follow your trading plan regarding entry, risk management, and trade management.
Good luck!
All Strategies Are Good; If Managed Properly!
~Richard Nasr
Strategy

SOL - Retest the Zone, Reload the Longs!Solana continues to trade within a well-defined ascending channel on the daily timeframe. After a strong bullish leg, price is now pulling back toward the highlighted support zone, which also aligns with the lower bound of the short-term channel.
As long as this area holds, it offers an attractive spot to look for fresh long opportunities. A confirmed bounce here could set the stage for continuation higher toward the channel’s upper boundary.
The structure remains bullish, and dips into demand are where the best risk-to-reward setups lie. Keep an eye on this zone for the next move.
⚠️ Disclaimer: This is not financial advice. Always do your own research and manage risk properly.
📚 Stick to your trading plan regarding entries, risk management, and trade execution.
Good luck!
All Strategies Are Good; If Managed Properly!
~Richard Nasr

XAUUSD 30M – Intraday Plan Around the RangePrice is holding between $3,417.84 (resistance) and $3,403.41 (support). We’re trading around $3,410–$3,411 inside a tight box. Scalps can work, but reversals are quick.
🔼 Bullish Plan (needs confirmation)
Trigger: A clean 30min body close above $3,417.84 (not just a wick).
Targets: $3,419.55 → $3,420.54 → $3,422.10.
Management: Take partials at $3,419.55, move SL to breakeven once $3,418 holds on a retest.
🔽 Bearish Plan (cleaner below support)
Trigger: 30min body close below $3,403.41.
Targets: $3,401.29 → $3,398.36 (trail if sellers stay in control).
Management: Scale partials at $3,401.29, protect the rest at breakeven.
🔄 Range Scalp (higher risk, small size)
Shorts: $3,416–$3,417 on a clear rejection → aim $3,410–$3,412, SL above rejection high / $3,420.
Longs: $3,403–$3,404 on a strong rejection wick → aim mid-range, SL below $3,401.
✅ Break Confirmation
Strong 30min close through the level.
❌ Invalidation
Breakout closes back inside the box on the next candle (trap).
Multiple wick with no momentum.
📌 Bottom Line
Above $3,417.84 → bullish bias to $3,420.54 and $3,422.10.
Below $3,403.41 → bearish bias to $3,401.29 and $3,398.36.
Inside the box = scalp only, keep risk tight.

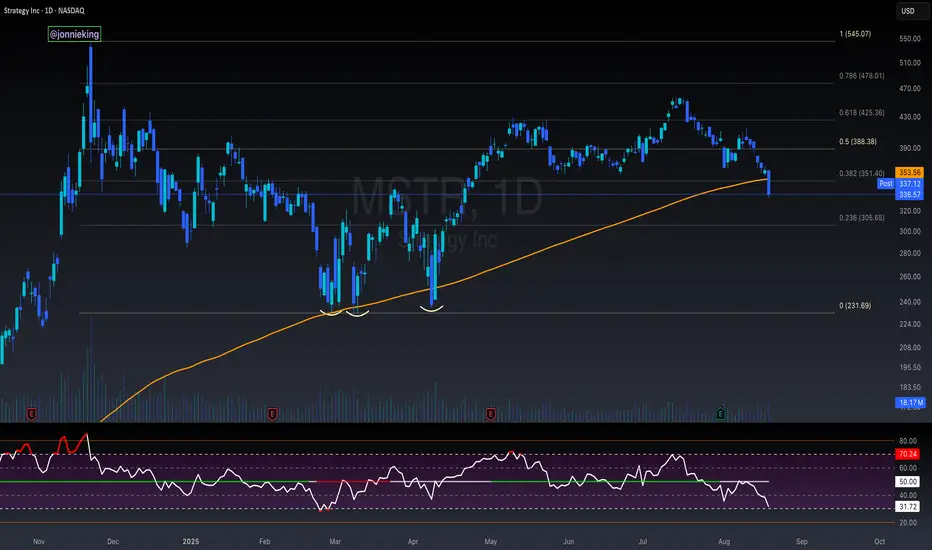
MSTR Bottoming Soon?NASDAQ:MSTR continues to range while weekly RSI heads into oversold without a significant pullback, a good sign for a bullish long term outlook.
My downside target for this move remains the High Volume Node, weekly pivot and golden ratio Fibonacci retracement at $290.
The R3 weekly pivot is a solid terminal target at $1039 but could overextend in an irrational environment.
Analysis is invalidated below wave (IV)
Safe trading

BTC – Fakeout Before the Big Breakout!Bitcoin has been repeating a familiar pattern:
- Fakeouts below key support zones, trapping early sellers.
- Breakouts back above structure, followed by strong impulsive moves.
We’ve already seen this sequence twice in the past months, and BTC might be setting up for it once again. Price faked out below support, reclaimed it, and is now eyeing a breakout from the falling channel.
🔁If history rhymes, the next leg could trigger a powerful impulse toward new highs. Traders should keep an eye on the $112,000–$114,000 zone — a breakout from here could be the spark for the next rally.
Is BTC about to repeat its playbook? 👀
📚 Always follow your trading plan regarding entry, risk management, and trade management.
Good luck!
All Strategies Are Good; If Managed Properly!
~Richard Nasr

HPQ HP Options Ahead of EarningsIf you haven`t sold HPQ before the previous earnings:
Now analyzing the options chain and the chart patterns of HPQ HP prior to the earnings report this week,
I would consider purchasing the 26usd strike price Puts with
an expiration date of 2025-8-29,
for a premium of approximately $0.42.
If these options prove to be profitable prior to the earnings release, I would sell at least half of them.
Disclosure: I am part of Trade Nation's Influencer program and receive a monthly fee for using their TradingView charts in my analysis.


Setting up for a Long Swing TradeHi Traders!
I've been keeping an eye on CHEWY for a few weeks now. Chewy dipped into the 78% fib, and set up for a reversal. I'd like to see a possible retest at a Daily Breaker Order Block at around $39.50. If that can verify that the Daily CHOCH is valid, I'm planning to swing this Options trade for a few weeks. My first target would be around $42. In addition, the monthly IMO is bullish and could give us another long term swing.
Alerts are set for now.
*DISCLAIMER: I am not a financial advisor. The ideas and trades I take on my page are for educational and entertainment purposes only. I'm just showing you guys how I trade. Remember, trading of any kind involves risk. Your investments are solely your responsibility and not mine.*

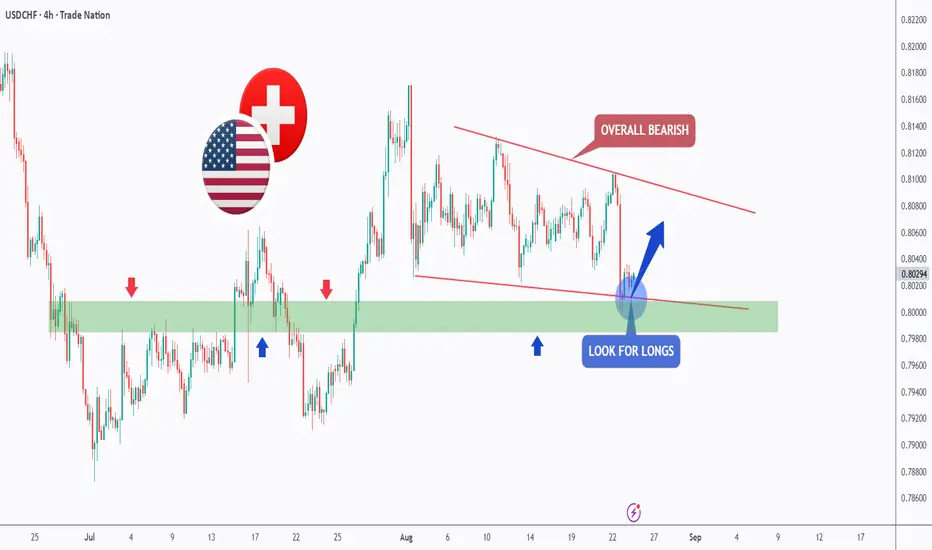
USDCHF – Bearish Channel, But Bulls Eye This Zone!USDCHF has been sliding within a falling channel 📉 , keeping the broader outlook bearish. Yet, the pair is once again testing the 🟩 demand zone, an area that has acted as a strong base in the past.
If buyers manage to hold this level 💪 , we could see a short-term rebound toward the upper bound of the channel.
For now, the plan is simple: while the macro bias stays bearish, this zone offers a potential window for trend-following longs before the sellers step back in.
⚠️ Risk management remains key, as a clean break below the zone would signal that bears 🐻 are tightening their grip.
📚 Always follow your trading plan regarding entry, risk management, and trade management.
Good luck!
All Strategies Are Good; If Managed Properly!
~Richard Nasr
Disclosure: I am part of Trade Nation's Influencer program and receive a monthly fee for using their TradingView charts in my analysis.
USD/CAD: The Perfect Storm for a Bullish BreakoutUSD/CAD is consolidating above 1.3850 after a strong bullish impulse. The technical structure shows:
A breakout from the summer bullish channel projecting towards 1.3950–1.4050, a key weekly resistance zone.
RSI remains neutral but strengthening, with no signs of immediate overextension.
Institutional demand around 1.3700 firmly rejected the downside, signaling strong long accumulation.
📌 Key levels: Support at 1.3750 / 1.3700 – Resistance at 1.3950 / 1.4050.
Commitments of Traders (COT)
USD Index: Non-commercial longs increasing (+1,330) with a slight reduction in shorts. Moderately bullish bias for USD.
CAD Futures: Significant increase in non-commercial shorts (+7,966) while longs decline (-2,691). Institutions are clearly selling CAD.
📌 This reinforces the bullish bias on USD/CAD, with speculative positioning strongly in favor of the US Dollar.
Seasonality (August–September)
Historically, August tends to be neutral/slightly bearish for USD/CAD, but September shows a strong bullish pattern, with consistent positive averages over the last 10–20 years.
📌 This supports a continuation of the bullish trend in the coming weeks, especially towards the 1.40+ area.
Retail Sentiment
78% of retail traders are short on USD/CAD, with an average entry price at 1.3780.
Only 22% are positioned long.
📌 Classic contrarian signal: excessive retail bearishness increases the probability of further upside.
✅ Trading Outlook
The overall picture shows alignment across technicals, COT, seasonality, and sentiment. USD/CAD maintains a bullish bias:
Primary scenario: Extension towards 1.3950 and then 1.4050, a major weekly supply zone.
Alternative scenario: Controlled pullback to 1.3800–1.3750 before resuming higher.
Invalidation: Daily close below 1.3700 would open space towards 1.3550.
📌 Bias: Long USD/CAD towards 1.3950–1.4050.

USDJPY - Bulls Loading at the Golden Zone?USDJPY has been overall bullish 📈 , trading inside a rising channel after bouncing from the April lows.
Recently, price rejected the weekly resistance zone (~152.000) and is now approaching the daily support zone (~146.000 – 144.000).
This support area also lines up with the lower bound of the channel 🔵, making it a potential launchpad for the next bullish impulse 🚀.
If buyers step in here, we could see a rebound toward the upper blue trendline, while a confirmed break below support would flip the outlook bearish.
In Brief:
- Trend: Overall bullish 📈
- Key Levels: 146.000 – 144.000 support | 152.000 resistance
- Plan: Look for long setups near support ✅
📚 Always follow your trading plan regarding entry, risk management, and trade management.
Good luck!
All Strategies Are Good; If Managed Properly!
~Richard Nasr
Disclosure: I am part of Trade Nation's Influencer program and receive a monthly fee for using their TradingView charts in my analysis.

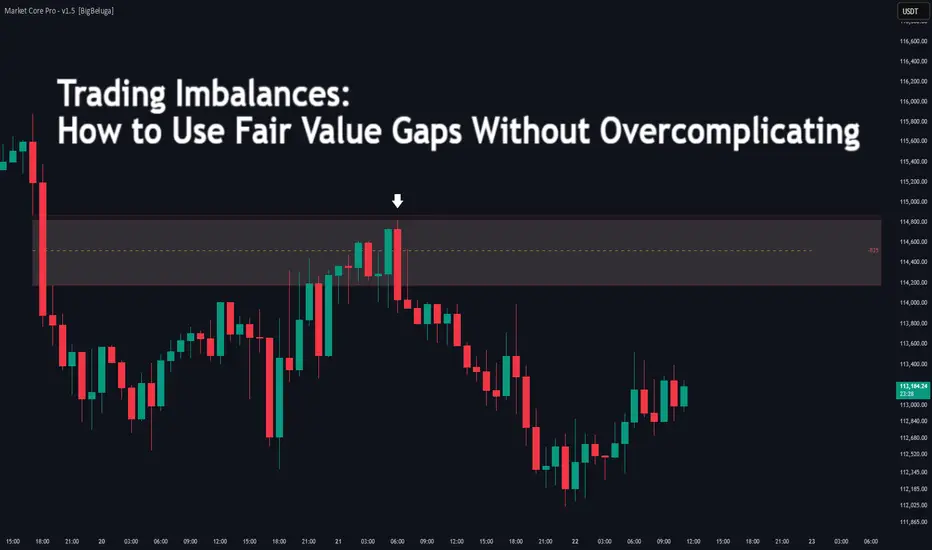
Trading Imbalances: How to Use Fair Value GapsDifficulty: 🐳🐳🐋🐋🐋 (Novice+)
This article is designed for traders who want to understand Fair Value Gaps (FVGs) in a simple, practical way — without drowning in complex Smart Money Concepts terminology.
🔵 INTRODUCTION
If you’ve studied Smart Money Concepts (SMC), you’ve likely come across Fair Value Gaps (FVGs). For many, the concept feels overcomplicated. In reality, an FVG is just an imbalance in price — a spot where the market moved so fast that it didn’t fully trade both sides.
🔑When price leaves a gap behind, it often comes back later to “rebalance.” This gives traders powerful zones for entries, exits, and target setting.
🔵 WHAT IS A FAIR VALUE GAP?
A Fair Value Gap is formed over three candles :
Candle 1: The first move (anchor).
Candle 2: The big impulsive candle (the imbalance).
Candle 3: The follow-up candle.
The gap exists when the high of Candle 1 is below the low of Candle 3 (in a bullish case). This leaves an “untraded zone” inside Candle 2.
Think of it as a skipped step. Price rushed through so quickly, there wasn’t enough time to trade at fair value.
🔵 WHY DOES PRICE RETURN TO FVGs?
Markets seek balance. When an imbalance forms, algorithms and institutional flows often revisit the gap to collect liquidity and rebalance orders.
This doesn’t mean every FVG gets filled instantly — some remain open for days or even weeks. But many serve as magnets for price.
🔑Key point: An FVG is not a magic level. It’s a clue about where inefficiency sits.
🔵 HOW TO TRADE FVGS SIMPLY
1️⃣ Mark the Zone
Identify the three-candle imbalance. Highlight the gap inside Candle 2.
2️⃣ Wait for Return
Don’t chase the impulsive candle. Instead, wait for price to retrace into the FVG zone.
3️⃣ Trade the Reaction
Bullish FVG → wait for price to dip into the zone and show bullish reaction
Bearish FVG → wait for price to retest zone and reject downward
Stops are usually placed beyond the gap, targets set toward the next liquidity pool or swing level.
🔵 EXAMPLE SCENARIO
A strong bullish candle leaves an imbalance.
Price continues higher, but a day later revisits the gap.
At bullish rejection candles form with increasing volume.
Entry taken, stop below gap, target at next swing high.
🔵 TIPS FOR ADVANCED TRADERS
Higher timeframe FVGs are stronger and attract price longer.
Not every gap fills — filter with trend direction.
Combine with OBs (Order Blocks) or liquidity zones for more precision.
Ignore small random gaps in low-volume markets.
🔵 CONCLUSION
Fair Value Gaps don’t need to be mysterious. They’re simply imbalances in the auction process. By waiting for price to return and react, traders can build structured entries with defined risk.
🔑Instead of overcomplicating SMC concepts, think of FVGs as footprints of urgency — and opportunities for balance.
Do you already trade FVGs, or is this your first time hearing about them? Share your setups below!
GBPJPY – Bulls Knocked Out, Bears Step In!After rejecting the 200.00 resistance, GBPJPY broke below key structure and shifted momentum to bearish.
Price is now retesting the broken support turned resistance, aligned with a descending trendline.
🔎 As long as this area holds, the bias remains bearish with potential for another downward leg.
👉 Plan: Look for short opportunities around the retest zone.
📚 Always follow your trading plan regarding entry, risk management, and trade management.
Good luck!
All Strategies Are Good; If Managed Properly!
~Rich
Disclosure: I am part of Trade Nation's Influencer program and receive a monthly fee for using their TradingView charts in my analysis.

NQ - If you're curious to where Nasdaq is going todayNot much to babble.
This is my intraday Chart.
TGT at the Centerline...where else? §8-)
Trade save. NO FOMO!!!
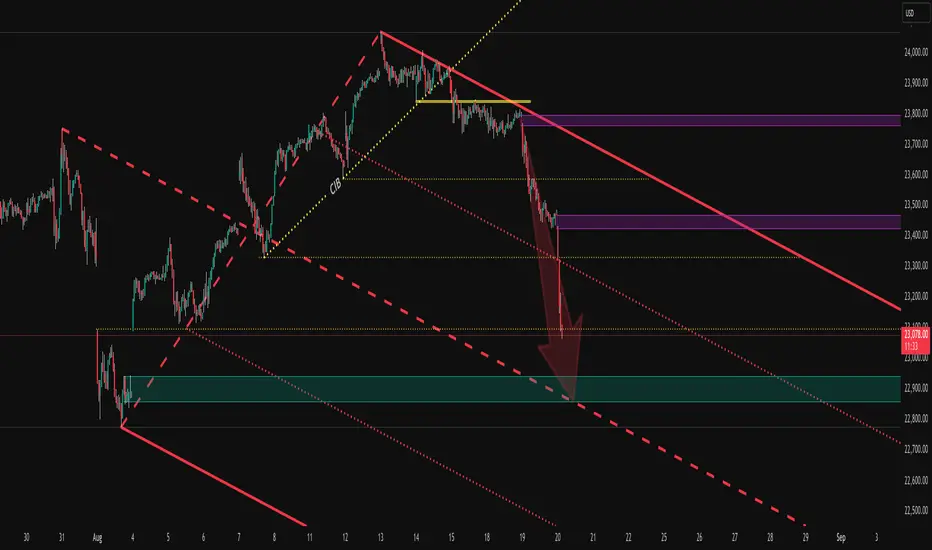
XAUUSD: Possible Bearish Point Of ViewGold in 4 Hours Time Frame has not moved significantly, currently we have not got ample volume to decide a clear trend. However, with the data that we have we can predict a possible ab=cd pattern where A to B is completed and we are yet to see c to d pattern.
If you like our work then please consider liking and commenting below.
Team Setupsfx

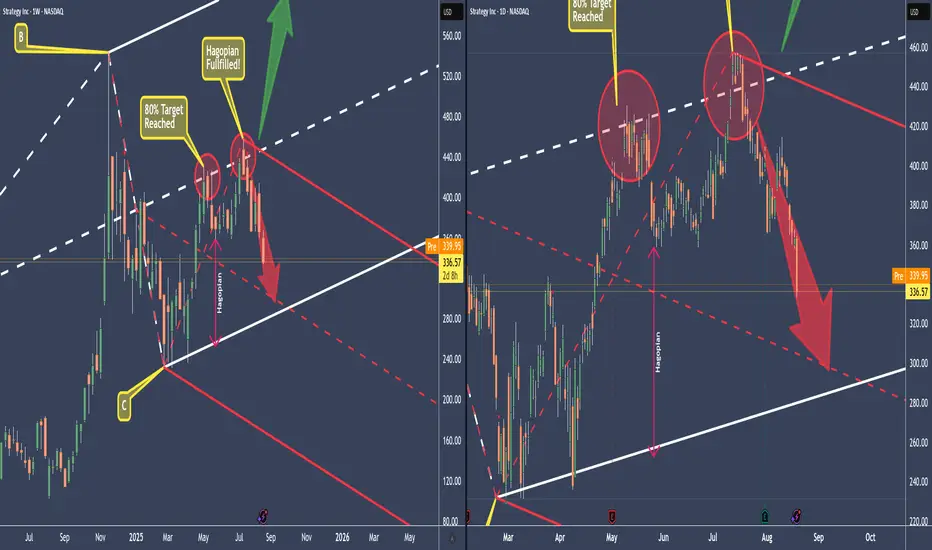
MSTR Ponzi is paying for my yearly steak & lobster subscriptionWe can see that from the white Centerline, MSTR has only been heading south. In contrast, Bitcoin has held up quite a bit better so far.
If you go back through my posts, you’ll see that I’ve been warning for a long time that MSTR is basically feeding itself. That simply can’t end well!
Either way – we gratefully take our profit and wait until we reach the lower centerline. Because we know there’s about an 80% chance that the price will fall back into temporary equilibrium, the Centerline
And if you’re not too greedy, well then you take 70%–80% of the profits now and let the rest run.
Anyone who was able to learn something from this trade or even make profits is welcome to boost and comment. §8-)
YT video will be available tomorrow.
...and on we go.
$MSTR Testing Historical Key Support at 200DMAMicroStrategy had its largest daily close below the 200DMA in the past 893 days.
Historically this support level has market key bottoms.
RSI allows for a bit more pain to the downside, but NASDAQ:MSTR should find a bottom soon.
If not, $305 is in play.
AUDUSD - Follow The Macro Trend!Hello TradingView Family / Fellow Traders. This is Richard, also known as theSignalyst.
📈AUDUSD has been overall bullish trading within the rising channel marked in blue.
This week, AUDUSD has been retesting the lower bound of the channel.
Moreover, the green zone is a strong weekly support.
🏹 Thus, the highlighted blue circle is a strong area to look for buy setups as it is the intersection of the lower blue trendline and green support.
📚 As per my trading style:
As #AUDUSD approaches the blue circle zone, I will be looking for trend-following bullish reversal setups (like a double bottom pattern, trendline break , and so on...)
📚 Always follow your trading plan regarding entry, risk management, and trade management.
Good luck!
All Strategies Are Good; If Managed Properly!
~Rich
Disclosure: I am part of Trade Nation's Influencer program and receive a monthly fee for using their TradingView charts in my analysis.

AUDCHF - Already Overbought!Hello TradingView Family / Fellow Traders. This is Richard, also known as theSignalyst.
📈AUDCHF has been overall bullish trading within the rising channel marked in red and it is currently retesting the upper bound of the channel acting as an over-bought zone.
Moreover, the blue zone is a strong weekly resistance.
📚 As per my trading style:
As #AUDCHF approaches the red circle zone, I will be looking for bearish reversal setups (like a double top pattern, trendline break , and so on...)
📚 Always follow your trading plan regarding entry, risk management, and trade management.
Good luck!
All Strategies Are Good; If Managed Properly!
~Rich
Disclosure: I am part of Trade Nation's Influencer program and receive a monthly fee for using their TradingView charts in my analysis.

EURUSD - One More Bearish Impulse Soon!Hello TradingView Family / Fellow Traders. This is Richard, also known as theSignalyst.
📈EURUSD has been overall bearish trading within the falling broadening wedge pattern marked in red and it is currently retesting the upper bound of the channel acting as a non-horizontal resistance.
Moreover, the blue zone is a strong supply.
📚 As per my trading style:
As #EURUSD retests the red circle zone, I will be looking for bearish reversal setups (like a double top pattern, trendline break , and so on...)
📚 Always follow your trading plan regarding entry, risk management, and trade management.
Good luck!
All Strategies Are Good; If Managed Properly!
~Rich
Disclosure: I am part of Trade Nation's Influencer program and receive a monthly fee for using their TradingView charts in my analysis.

Is GBPUSD Setting up for a Long Swing?Hi Traders!
I've been watching this pair. It seems like it could be setting up for a long swing. I would like to see a retest around 1.34900/800, and how it reacts to that area. That'd hit a Daily Order Block. In addition, the weekly made a break of structure, and dipped into a weekly breaker OB, then pushed up. However, the only thing I don't like is it's at a weekly resistance. But, IMO the monthly looks bullish.
So, over all I'm bullish on this pair and will plan to swing, I just need my confluences to match up fully before taking this trade.
*DISCLAIMER: I am not a financial advisor. The ideas and trades I take on my page are for educational and entertainment purposes only. I'm just showing you guys how I trade. Remember, trading of any kind involves risk. Your investments are solely your responsibility and not mine.*

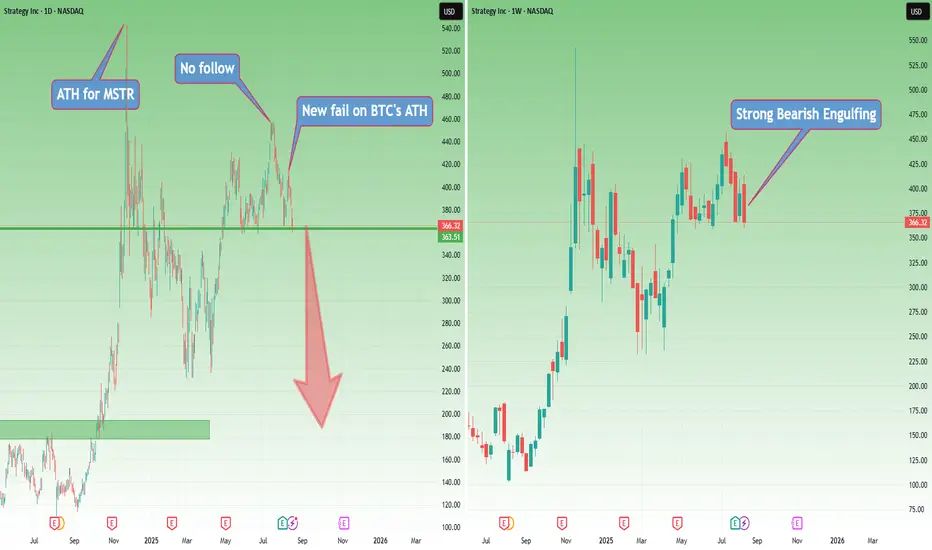
MSTR: A Giant with Feet of ClayExactly two weeks ago, I wrote an article with a rhetorical question: “Why should you buy Strategy if you want exposure to BTC?” and argued that MSTR could fall—and fall hard.
Two days ago, BTC printed a new ATH. That move was visible in MSTR as well; however, we’ve got a lower high and a new fail for the stock.
Even more, this fail has formed the right shoulder of an H&S pattern.
On the weekly chart, there’s a strong bearish engulfing that ended exactly at the neckline of the pattern.
This type of price action is far from bullish, regardless of what one may want to dream of.
BTC is above confluence support. If it breaks this level, Strategy will fall even harder.
In my last post, out of 12 comments, 5 were hate comments—because “how can I say such enormities, that Strategy could fall.”
The answer is simple: the chart doesn’t look good at all.
Even if BTC reverses from this support, in my opinion the reflection in MSTR will be minimal.
And anyway, I trade what I see, not what Saylor sells me.
That being said, a drop of BTC under confluence support will most probably lead to a break below the neckline for Strategy. And if BTC delivers a meaningful correction, Strategy will fall like a giant with feet of clay that it is.
GBP/USD at Weekly Supply – Is the Pound About to Collapse?Technical Outlook:
GBP/USD is currently trading around 1.3535, testing a significant weekly supply zone between 1.3500–1.3600. The recent bullish impulse has brought price back into a strong confluence area marked by prior distribution in late July. The RSI is approaching overbought levels on the daily chart, suggesting a potential short-term exhaustion of buying momentum. My base scenario anticipates a rejection from the current zone, with the possibility of a retracement toward 1.3250–1.3150, aligning with the next demand area and historical price reaction. The projected short-term pattern shows a potential lower high forming before a deeper move down toward the yearly lows.
COT Positioning:
USD Index (as of 05 Aug 2025): Non-commercials decreased longs by -2,561 and slightly increased shorts (+313), showing a minor bearish tilt for USD in the short term.
GBP Futures: Large specs significantly reduced longs (-22,164) while also trimming shorts (-889), with commercials adding substantial long exposure (+20,125). This shift indicates reduced speculative confidence in GBP upside, while commercial buying suggests hedging or value positioning. Overall, COT data tilts toward a potential GBP correction rather than sustained breakout.
Seasonality:
GBP/USD historically underperforms in the second half of August across 5, 10, and 15-year averages. The 20-year tendency shows a mild decline starting mid-month into early September, aligning with the current resistance test and potential for downside momentum.
Sentiment:
Retail sentiment shows 66% short vs. 34% long. The majority of retail traders are positioned against the recent bullish push, which could fuel a brief squeeze higher before reversal. However, the confluence of COT, technical resistance, and seasonality keeps the medium-term bias bearish.
Conclusion & Bias:
Primary scenario: Short bias from 1.3530–1.3600 supply zone targeting 1.3250, then 1.3150 if momentum confirms.
Invalidation: Daily close above 1.3650 would weaken the short setup and open the path toward 1.3700–1.3750.
