Strongbuy

Gold to close long for the rest of the weekFrom the beginning of the week Gold has captured liquidity from the 1730 level, i wanted it personally to get a bit lower towards 1722-1725 level before entering which was not far from the 1727 level it reached.
For the rest of the week I expect for Gold to keep raising up towards the 1780-1800, be aware that price has been rejecting a little the 1750 where it is at now so look for news to either push up or down from that level.
Good luck everybody
Thank you for criticism and the positive comments/likes received

XRPUSD - Strong Uptrend Today. Price Technical Analysis #4Market in last 24 hrs
- XRPUSD price saw a gradual upward movement. Market moved by $0.0075 points, between $0.1975 and $0.2050
- Price at time of publishing: $0.2021
Today’s Trend analysis
Price should trend upward today. Oscillators are neutral with a bias towards ‘buy’ side. MACD has just crossed up 0, confirming upward trend. RSI is above 50 and CCI at 77, moving towards 100, both confirming that the upward momentum is strong. To add to this, price is touching upper Bollinger Band, implying a possible break-out.
Another interesting point to notice is the affect of Halving-Hype on trade volume and price volatility of BTC and other Crypto tokens.
- Strong uptrend today
- ‘Oscillator‘ indicators are mostly neutral, with bias towards buy side. RSI at 58
- ‘Moving average‘ indicators are indicating an uptrend. Ichimoku Cloud is neutral
----------------------------------------------------------------------------------------
The analysis is based on signals from 28 technical indicators, out of which 17 are moving averages and remaining 11 are oscillators. These indicator values are calculated using 4 hr candles.
DM to get details of the above analysis and list of indicator & their values used to arrive at the above conclusion.
Note: Above analysis would hold true if we do not encounter sudden jump in trade volume.
----------------------------------------------------------------------------------------
If you find the analysis useful, please like and share our ideas with the community!

BTCUSD - Strong Uptrend Today. Price Technical Analysis #77Market in last 24 hrs
- BTCUSD price saw a gradual upward movement. Market moved ~550 points, between $9.2k and $9.8k
- Price at time of publishing: $9,800
- BTC’s market cap: $177 Billion
Today’s Trend analysis
Price should trend upward today. Oscillators are neutral with a bias towards ‘buy’ side. MACD is at 88, confirming upward trend. Both RSI is at 64 and CCI at 120, both confirm that the upward momentum is strong. To add to this, price is touch upper Bollinger Band , implying a possible break-out.
Another interesting point to notice is the affect of Halving-Hype on trade volume and price volatility of BTC and other Crypto tokens.
- Strong uptrend today
- ‘Oscillator‘ indicators are mostly neutral, with bias towards buy side. RSI at 64
- ‘Moving average‘ indicators are indicating an uptrend. Ichimoku Cloud is neutral
----------------------------------------------------------------------------------------
The analysis is based on signals from 28 technical indicators, out of which 17 are moving averages and remaining 11 are oscillators. These indicator values are calculated using 4 hr candles.
DM to get details of the above analysis and list of indicator & their values used to arrive at the above conclusion.
Note: Above analysis would hold true if we do not encounter sudden jump in trade volume .
----------------------------------------------------------------------------------------
If you find the analysis useful, please like and share our ideas with the community!

EUR/JPY, New Bullish Run?EUR/JPY made a huge drop since the start of May, we expect the Euro to regain strength soon. We can look for buy opportunities when price breaks the descending trend line.


IS IT ALREADY THE TIME TO INVEST IN OIL?******************************************************************************************************************************************************************************
Decisions to buy, sell, hold or trade in securities and other investments involve risk and are best made based on the advice of qualified financial professionals. Any trading in securities or other investments involves a risk of substantial losses. The practice of “Day Trading” involves particularly high risks and can cause you to lose substantial sums of money. Before undertaking any trading program, you should consult a qualified financial professional. Please consider carefully whether such trading is suitable for you in light of your financial condition and the ability to bear financial risks.
***********************************************************************************************************************************************************

EURBRL Strong Bullish Pattern The Euro continues to climb higher against the Brazilian Real as Brazil’s economy will struggle to growth as demand for their commodity exports drop due to the slump in global trade.

WHICH PRICE A NOVICE INVESTOR MUST BUY AIR CANADA-04-17-2020******************************************************************************************************************************************************************************
Decisions to buy, sell, hold or trade in securities and other investments involve risk and are best made based on the advice of qualified financial professionals. Any trading in securities or other investments involves a risk of substantial losses. The practice of “Day Trading” involves particularly high risks and can cause you to lose substantial sums of money. Before undertaking any trading program, you should consult a qualified financial professional. Please consider carefully whether such trading is suitable for you in light of your financial condition and the ability to bear financial risks.
************************************************************************************************************************************************************************
WHAT CHART PATTERN AIR CANADA IS PROBABLY BUILDING?
The forex rising wedge (also known as the ascending wedge) pattern is a powerful consolidation price pattern formed when the price is bound between two rising trend lines. It is considered a bearish chart formation that can indicate both reversal and continuation patterns – depending on location and trend bias.
source:https://www.dailyfx.com/education/technical-analysis-chart-patterns/rising-wedge.html
WHEN SHOULD WE TAKE POSITION?
WE CAN TAKE POSITION AT ANY TIME IF YOU ARE A GOOD INVESTOR AND YOU CAN ANALYSE QUICKLY WHAT THE MARKET IS GOING, ACCORDING TO THE PREDILECTION WEDGE PATTERN HAS 5 POINTS SO WE CAN TAKE POSITION IN POINT B, C, D, E BUT THE RISK LEVEL IS NOT THE SAME
B IS STRONGLY HIGH
C IS HIGH
D IS MEDIUM
E IS LOW
THE RECOMMENDATION FOR INVESTORS AND NOVICE PEOPLE WILL BE TO WAIT FOR THE BEST TIME AND THE BEST TIME WITH A LOW RISK IS THE POINT " E BECAUSE THE MARKETS WILL REACH A GOOD SUPPORT LEVEL TO CHANGE BEARISH TREND TO A BULLISH ONE.
IN CONCLUSION, THE BEST PRICE IS AROUND $8-$6 .


Gold may start a strong upward move from here, keep an eye on...Gold price has just hit the strategic key level. I expect a strong upward move if price rejects this zone upward and also can hold above on...

SHIFTPIXY-STRONG BUY-EntryNASDAQ:PIXY
Analysis Method: Wave & Fibonacci
Thesis: Productivity/Blockchain
Learn more: www.shiftpixy.com
Fib Time:
Wave Count:
Fib Spiral:
Time-frame:
Target: $2.80

ZEC - Zcash - STRONG BUYZECUSD : STRONG BUY
Analysis Method: Fibonacci & Wave Theory
About Zcash: z.cash
Launched in 2016 by Zooko Wilcox-O’Hearn and based on the Zerocoin protocol, Zcash (ZEC) is a decentralized and open-source privacy-focused cryptocurrency that enables selective transparency of transactions. Zcash transactions can either be transparent or shielded through a zero-knowledge proof called zk-SNARKs. This allows the network to maintain a secure ledger of balances without disclosing the parties or amounts involved. Instead of publishing spend-authority and transaction values, the transaction metadata is encrypted and zk-SNARKs are used to prove that nobody is being dishonest. coinmarketcap.com
Monthly: High/Low
Daily: Fib-Time/Minor Wave 1 & 2
6 Hour: Minor Wave 1 & 2
-Waves %: Extended 3rd
Minor Wave 1: 151%
45 Minute Chart: Micro-Wave
Immediate Target Area: $53-$57
Timeframe: 6 Days
Target Area: $85-$110
TimeFrame: 60 Days
Will update.
-FMW

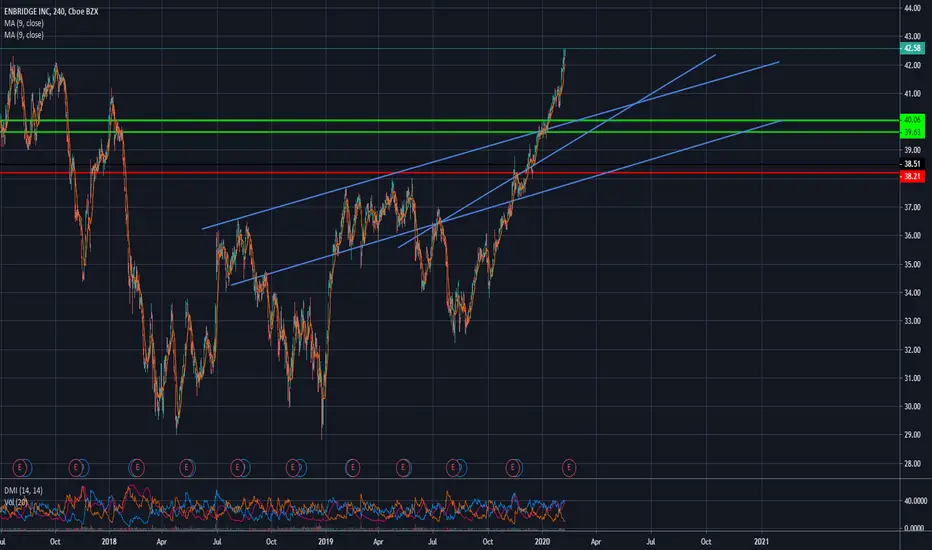
ENB Long Broke my Chart upside Canadian-based Enbridge (NYSE:ENB) offers investors a 6% yield, while Plains All American Pipeline (NYSE:PAA) has a 7.5% yield. Enbridge,has a large and much more diversified business, which should be a major plus for conservative types. (Obviously, however, if you want a pure-play midstream company Enbridge won't be a good fit.) Add in a more consistent dividend history, and the slightly lower yield seems like a worthwhile concession. If you are looking at this , Enbridge is likely to be the better option today. compared to others.
CAD/JPY Strong SupportPrice has reached strong support that has been tested multiple times. Wait for some kind of confirmation on smaller time frames.

Peri Highly Likely to beat earnings!My prediction is that the over-reaction on taking profits created the fall in price, bringing a new position to get settled in before earnings is released. I believe that we will be rising from the High 7$ & low 8$ by the end of this week. Still is another full week in the market before week of earnings which can create a little more consolidation, however due to the last bear candles showing we are on a pivot to an equal 9$. I am thinking Peri will be surprising us big ups on the earnings call especially because it is currently undervalued.
Do your own research before investing.
I am not a professional or expert, I am just providing an idea that I believe is going to happen.
Share your thoughts & opinions!
We are here to rise as a team<3


BTC - BOOM - Strong Buy BITFINEX:BTCUSD remains a STRONG BUY.
Major Breakout is IMMINENT for BITFINEX:BTCUSD !
Analysis Method: Wave Theory + Fibonacci
Previous analysis focused on the BITFINEX:BTCUSD Hourly chart where I was tracking a Primary Wave. The Primary Wave Sequence completed and the 5th wave broke .618 (5th Extension Trigger) as expected.
Daily Chart:
Primary Wave Cycle:
Wave 3 & Wave 5 Extended:
Correction Sequence: ZigZag
High Wave 1: 343%
Minor Wave Sequence (Previous Analysis):
Target Wave 3 Area: $23,806-$17,169
Fibonacci Time Markers: Estimate 47 Days to Hit High Wave 3 Target Area
Previous Idea Link:
Will Update.
FMW
-AB

Golden Corner Pocket & ABCD Pattern XTZ/BTCXTZ/BTC has made an ideal retrace to the golden zone and is now mirroring the ABCD bullish pattern that began early November 2019 which led to a 165% gain in a 41 day period. Bullish. Strong Buy.


BTC Strong Bullish TriangleFor more than half a year we have been monitoring the development of the Bitcoin correction in the form of a falling channel. Continuous downtrend movement has already filled most of Fibonacci's values. The last and most important level that can hold the price of BTC is 78.6% retracement, which most traders rely on. My point is that big players won't allow us to buy Bitcoin for such a great price and I consider the $ 6400 value as the bottom of this year's correction. If I look only at the Bitcoin chart, it almost does not suggest. Correlations of charts like Total Market Cap, Altcoin dominance, coins against USDT, High Caps charts like ETH, LTC, etc. suggest this. Each of these charts asks for upward movement, which can only cause an increase in the BTC price. The weekly chart shows that the price level of Bitcoin is held by the BK77 indicator, from which the price is always reflected upwards. Even over the past month, bullish candle formations have been created with increased purchasing volumes. If we fell out of the accumulation zone from $ 7800 to $ 6400, the BTC would point to $ 5500, where the important MA200 indicator is located, from which there was always a reflection upwards. The Internet will surely be full of predictions that will talk about a new day from 2018, and the $ 1800 value may be mentioned below. There is no need to be afraid and follow the "Buy the rumor, sell the news" rule.
Upon completion of the half-year correction, the BTC will attack $ 11,900, where there is an unfilled CME Futures GAP. Here will be a very important reaction, as BTC will demonstrate. If it breaks through without any problems and keeps above it, the crypto market will look much more bullish. In the event of a downward GAP discouragement, the effort to create a new local maximum will also be extended by a year and a half. The fundamentals that will apply to Halving BTC could also help up. From historical gifts we already know that Halving has always caused a rise in the price level of Bitcoin. As for the new All time High, I don't see it as pink as most traders. The logarithmic curves of the Bitcoin chart indicate the beginning of the recession, which certainly does not listen very nicely. I expect upward movement to the logarithmic curve, but at what price level?

