USDJPY I Local short from resistance zoneWelcome back! Let me know your thoughts in the comments!
** USDJPY Analysis - Listen to video!
We recommend that you keep this pair on your watchlist and enter when the entry criteria of your strategy is met.
Please support this idea with a LIKE and COMMENT if you find it useful and Click "Follow" on our profile if you'd like these trade ideas delivered straight to your email in the future.
Thanks for your continued support!
Structure

USDCAD- Near HArmonic support USDCAD is in bearish trend.Support zone marked if USDCAD spend significant times on support then it can be a good buying zone.
If breaks short position can be opened on retest of support zone.
Plan both and then enter trade on confirmation in favour of trend.

NZDCHF Same Bearish Outlook, Short Term Sell Setup
Similar like NZDUSD, we can also expect a bearish development on NZDCHF.
As usual, after an impulse phase, price formed a continuation correction to correct the impulse.
From the correction, there is a confirm impulse push down the price. This is good confirmation of bearish trend.
Now price has form another smaller correction,
watch for price to break out and look for lower time frame entries to sell to previous lows.

NZDUSD Bearish Development, Watch For Sell
Hello traders:
Here on NZDUSD, we can see price is currently consolidating in a possible bearish correction structure.
After the initial bearish impulse move, the price fails to break the previous swing highs, and begin to form the current correction.
This is usually a good sign that the bearish momentum is still strong and more continuation is very possible.
Wait for lower time frame development to confirm the bearish trend to the next swing lows.

GBPUSD ThesisHope you all had a lovely weekend! This is how i'm currently looking at GBPUSD; Price is testing structure level... i'm currently waiting for price to break our correction move to the downside before going short. What's your thought on this pair?

AUDUSD Can Push Lower, Wait For Sell Setups
From previous outlook and forecast, we can see price has indeed pushed lower impulsively on the mid time frame.
Now we can see price has already break previous lows, and start to consolidate again. This is good sign for more downside from the price, as long as a continuation correction is formed here.
This week, wait for the correction to complete, to confirm another impulse phase on the lower time frame.
Be careful price sometimes has tendency to turn the current correction to be a reversal, so break above the highs and form bullish price action will void this forecast and outlook.

US30 I Short-term short from resistance Welcome back! Let me know your thoughts in the comments!
** US30 Analysis - Listen to video!
We recommend that you keep this pair on your watchlist and enter when the entry criteria of your strategy is met.
Please support this idea with a LIKE and COMMENT if you find it useful and Click "Follow" on our profile if you'd like these trade ideas delivered straight to your email in the future.
Thanks for your continued support!

NAS100 I It will retest weekly level and fall short-termWelcome back! Let me know your thoughts in the comments!
** NAS100 Analysis - Listen to video!
We recommend that you keep this pair on your watchlist and enter when the entry criteria of your strategy is met.
Please support this idea with a LIKE and COMMENT if you find it useful and Click "Follow" on our profile if you'd like these trade ideas delivered straight to your email in the future.
Thanks for your continued support!

NZDUSD PLAN 03/16/2023NZDUSD PLAN 03/16/2023
Risk Reward MINIMUM : 1 to 2 or more.
Share if you agree.
Donate please :D
God bless Us !
Arayaz

USDJPY More Downside Potential, Wait For Sell Setup
USDJPY has been pushing down since it hits the previous highs to form a double top.
With a ascending channel correction, price indeed reversed down impulsively, and form continuation correction along the way.
Bow that we have push down more, and another consolidation has formed, usually give us a indication of more downside opportunity.
Wait for current correction to complete to push the price down even more to previous lows.

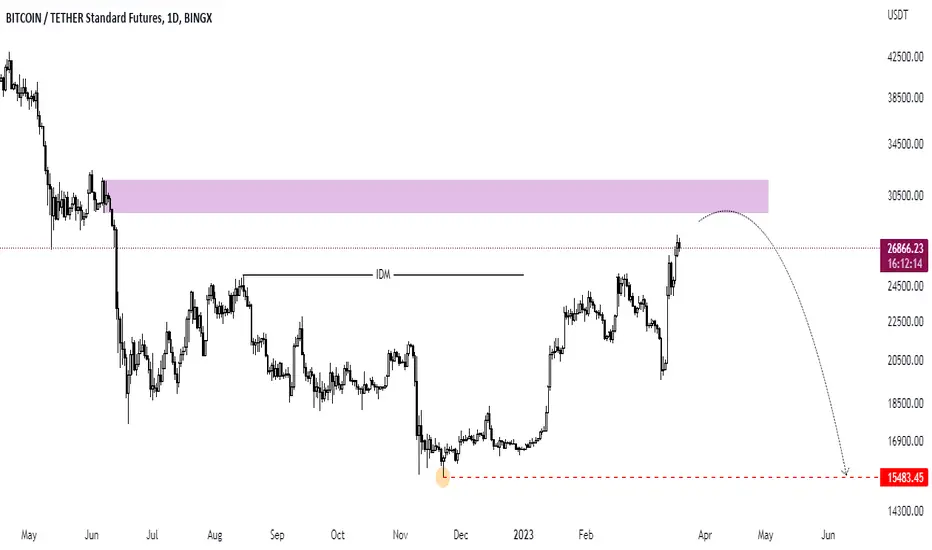
Bitcoin AnalysisThis is my oponion on BTC 1D chart.
going up to 29500 and then going down to 15500
What you think?
Analysis EUThis is my analysis of EU going higher passing my blue after and pullback or retest. It already break an previous high on the 1hr. Therefore on the daily, it is fulling in all the orders to the left from that big drop. Reaching for the next recent and relevant high. Thank you for reading!

Zen Technologies - Retest ✅After the strong breakout the stock has potentially completed the retest now moving forward:
CMP 290
TGT 340-350+
Sl Below 255 (Jarurat nhe padege par pherr b)
Note : Just an idea not any personal recommendation for the stock here just for education purpose.

AUDUSD PLAN 03/16/2023AUDUSD PLAN 03/16/2023
Risk Reward MINIMUM : 1 to 2 or more.
Share if you agree.
Donate please :D
God bless Us !
Arayaz

EURJPY Bearish Price Action, Watch For Sell
Here on EURJPY mid time frame, we can see the price has clearly impulse out of the MTF corrective structure.
With a strong bearish impulse phase, we know price will need to correct in order to continue lower.
In the last 2 days price has slowly been consolidating in the latest development, good sign for further downside if correction completes.
Wait for lower time frame bearish price action to confirm more downside potential.

GBPJPY PLAN 03/16/2023GBPJPY PLAN 03/16/2023
Risk Reward MINIMUM : 1 to 2 or more.
Share if you agree.
Donate please :D
God bless Us !
Arayaz

Swing setup reversal for SP500**Not financial or trade advice, this is not a signal service**
Anticipating to see lower prices on SP500. The trade idea has 3 individual targets - T1 will be used to remove risk on trade (BE) and take partials, T2 to take partials and let the rest run, T3 for full close.
Reasoning:
Change of structure to the downside;
Resting liquidity below current price;
Overextension of current trend;
HTF DXY liquidity above current price;
Will update the trade idea at the end.

AUDCAD SHORTFlag pattern with Head and shoulder pattern detected in 1 hour time frame along with the RSI divergence

CADJPY I Intraday short 40-60 pips 🚀Welcome back! Let me know your thoughts in the comments!
** CADJPY Analysis - Listen to video!
We recommend that you keep this pair on your watchlist and enter when the entry criteria of your strategy is met.
Please support this idea with a LIKE and COMMENT if you find it useful and Click "Follow" on our profile if you'd like these trade ideas delivered straight to your email in the future.
Thanks for your continued support!

XAUUSD: Gold Correction Is due OANDA:XAUUSD
Hi , Trader's ..As u can see after collapse of silicon valley bank , Gold shotup heavily
Now Market needs a correction down to 1860 area , 50% correction is due now
Gold is heavily overbought in All TF now , Market seems to be unstable
There is big Gap opening which need's to be filled
1900-1909 area will be reversal area for gold
❤️ Please, support my work with follow ,share and like, thank you! ❤️

Bitcoin on the daily pt.4We have a pivotal moment For BTC, we had a change of character (CHoCH) as well as a break below the diagonal supporting trendline in favour of the bears.
With a new Lower Low below the 1D 200EMA needing a reaction off the oversold RSI to stop its decent towards the final target I initially had planned and has shown since the first post on this. A strong reaction brings us back up to the underside of that previous support and now testing resistance.
BTC needs to accept over 24k in order to regain any short term hope of bullish continuation. If not, I fear we're setting up to go lower.

Bitcoin at Triangle Pattern #Bitcoin 1hr. #TA at @binance
Right now as per 1 hour chart #BTC movement is slowly following #TrianglePattern and pattern will break soon on 13th March at 5:30 AM with 80% chance to Downtrend but 20% chance to $21.5k Can also retest..!

XRPUSDT : Bullish Flag Continue patternBINANCE:XRPUSDT
Hi , Trader's .. As you Can see Market is Trading In Bullish Flag pattern
price can touch support zone and can retest upper resistance level
breakout of upper trendline will make it bullish again
❤️ Please, support my work with follow ,share and like, thank you! ❤️
