BTCUSD 3DPrice has slowed down momentum here at the key higher timeframe downtrend structure region. This is a big indication that a potential reversal may be coming, as price is failing to break higher at this key region. A break of the rising channel on the higher timeframe & we may see the sellers come back in to push price lower.
Structure

GBPJPY All target HitPrice moves as we anticipated earlier on
Price fall after testing the structyre that market previously breaks and close below with strong bearish close of 4H candle

EURCHF THESISPossible outcome of how this pair could play out…. Currently waiting for a retest of zone after we had a break out to the downside.

AUDUSD THESISMarket reversed from daily high and broke structure zone and traded to the downside. This has potential to trade further down, though we are currently waiting for a 1H Bearish set up to enter short.

GBPJPY I Short until resistance brokenWelcome back! Let me know your thoughts in the comments!
**GBPJPY Analysis - Listen to video!
We recommend that you keep this pair on your watchlist and enter when the entry criteria of your strategy is met.
Please support this idea with a LIKE and COMMENT if you find it useful and Click "Follow" on our profile if you'd like these trade ideas delivered straight to your email in the future.
Thanks for your continued support!

GBPAUD Short Opportunity - JANUARY RECAPExplanation within the post:
1.LLs and LHs
2.RT towards broken support level
3.EMA acting as added dynamic resistance and added confluence
4.Clean traffic to the left
5.Bearish pinbar which entered on close
5.2RR - will monitor P.A

✅GBP_AUD BREAKOUT|SHORT🔥
✅GBP_AUD broke the key structure level
While trading in an local downtrend
Which makes me bearish
And I think that after the retest of the broken level is complete
A bearish continuation will follow
SHORT🔥
✅Like and subscribe to never miss a new idea!✅

EURCHF I Short from supply zone Welcome back! Let me know your thoughts in the comments!
**EURCHF Analysis - Listen to video!
We recommend that you keep this pair on your watchlist and enter when the entry criteria of your strategy is met.
Please support this idea with a LIKE and COMMENT if you find it useful and Click "Follow" on our profile if you'd like these trade ideas delivered straight to your email in the future.
Thanks for your continued support!

USDJPY I Short from resistance zone Welcome back! Let me know your thoughts in the comments!
**USDJPY Analysis - Listen to video!
We recommend that you keep this pair on your watchlist and enter when the entry criteria of your strategy is met.
Please support this idea with a LIKE and COMMENT if you find it useful and Click "Follow" on our profile if you'd like these trade ideas delivered straight to your email in the future.
Thanks for your continued support!

How Far/Long Can BTC Push Higher? 🕝Hello TradingView Family / Fellow Traders. This is Richard, as known as theSignalyst.
🗒 As per my last educational post, we know that we might be in Pattern 4 => falling correction after a bearish impulse, leading to a bullish reversal.
As mentioned, our confirmation would be a weekly candle close above the last major high in green (22500)
Now since, we broke above it the last high, how far can BTC push higher?
The first / next rejection is now around the previous major high around 25,000 in blue .
If / Once the 25,000 high is broken higher, then a movement till the 30,000 resistance / supply would be expected.
N.B. Always Remember, nothing moves in a straight line, so we might have a correction (as a higher low) along the way.
📉Which scenario do you think is more likely to happen? and why?
Always follow your trading plan regarding entry, risk management, and trade management.
Good luck!
🗒 All Strategies Are Good; If Managed Properly!
~Rich

GBPCHF I It will head upward Welcome back! Let me know your thoughts in the comments!
**GBPCHF Analysis - Listen to video!
We recommend that you keep this pair on your watchlist and enter when the entry criteria of your strategy is met.
Please support this idea with a LIKE and COMMENT if you find it useful and Click "Follow" on our profile if you'd like these trade ideas delivered straight to your email in the future.
Thanks for your continued support!

XAUUSD Long Opportunity - JANUARY RECAP
1.HH and HL
2.Price RT the broken R zone and formed a bullish engulfing candle (filled with momentum)
3.EMA holding as dynamic added support
4.Clean market structure and price action
5.RR2
Monitor P.A accordingly. Trade safe everyone !

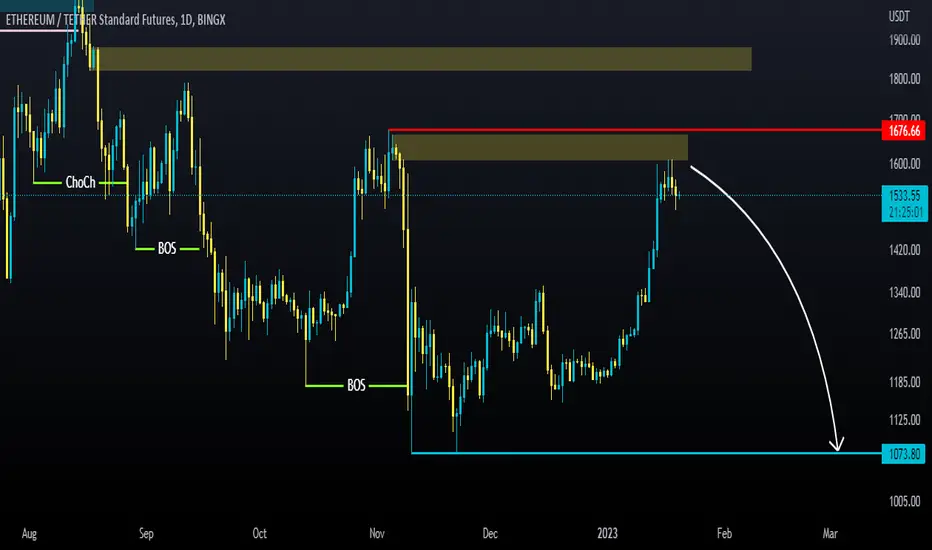
ETH on Daily Like you can see on ETH daily chart , we are in a bearish Structure and now ETH hit the daily POI on 1610
So we have 2 option now , if price breaks the structure high on 1676.6 then we will start a new up trend , this possibility is like 30%
and i think we have 70% possibility to get down to structure low on 1073.8 .
Institutional Demand: AUD/CHF LongHi traders,
At the moment, it seems like AUD/CHF is finally moving lower, towards our key area of daily demand. On top this demand area is nicely stacked together with some higher time-frame confluences and of course on my watch list for the upcoming days. As always, confirmation on the lower time-frames is required before I consider a buying opportunity.
Take care all & trade safe.
Kind regards,
Max Nieveld

How to identify trend reversal?Hello traders. In this module we aim to explain how to identify trend reversal. Please pay careful attention to the annotations made on the chart.
Happy Trading
Team Lamda!!!

EURCAD I Position swing short from monthlyWelcome back! Let me know your thoughts in the comments!
**EURCAD Analysis - Listen to video!
We recommend that you keep this pair on your watchlist and enter when the entry criteria of your strategy is met.
Please support this idea with a LIKE and COMMENT if you find it useful and Click "Follow" on our profile if you'd like these trade ideas delivered straight to your email in the future.
Thanks for your continued support!

Mt.BFX | Tezos XTZ Structure Map | $900The analysis includes multiple methods of technical analysis to produce a map.
The labels for the chart and what the chart says are on the chart itself, more information about how to create a chart like this will come with updates to this idea.
A quick rundown of what I do use are:
Trend Line to extend from two lowest structure closes.
Horizontal Ray tool to mark off structure highs and lows on the Monthly Timeframe.
Box tool to mark off Monthly and Weekly gaps in price action.
Fibonacci tool using Powers of Two or Binary numbers to plot growth lines originating from two of the lowest close values. This cancels the logarithm out when using a logarithmic chart.
What do the boxes mean?
Red Box - Monthly TF Gap Down
White Box - Monthly TF Gap Up
Orange Box - Weekly TF Gap Down
Blue Box - Weekly TF Gap Up
I predict the price to move away from $8 and break into triple digits over the long term. The price targets are as follows:
$7.30
$14.60
$28.80
$57
$114
$227
$456
$900
With a price at $900 per coin, the Tezos platform would be valued at $798,181,180,200 for the total supply, not that in circulation as of 26th August 2021.
$227 is a conservative estimate valuing the platform at $201 billion.
This is not financial advice.

GBPJPY I Potential short from resistanceWelcome back! Let me know your thoughts in the comments!
**GBPJPY Analysis - Listen to video!
We recommend that you keep this pair on your watchlist and enter when the entry criteria of your strategy is met.
Please support this idea with a LIKE and COMMENT if you find it useful and Click "Follow" on our profile if you'd like these trade ideas delivered straight to your email in the future.
Thanks for your continued support!

APPLE I Short from daily structureWelcome back! Let me know your thoughts in the comments!
**Apple Analysis - Listen to video!
We recommend that you keep this pair on your watchlist and enter when the entry criteria of your strategy is met.
Please support this idea with a LIKE and COMMENT if you find it useful and Click "Follow" on our profile if you'd like these trade ideas delivered straight to your email in the future.
Thanks for your continued support!

AUDCHF I It will rise from support Welcome back! Let me know your thoughts in the comments!
**AUDCHF Analysis - Listen to video!
We recommend that you keep this pair on your watchlist and enter when the entry criteria of your strategy is met.
Please support this idea with a LIKE and COMMENT if you find it useful and Click "Follow" on our profile if you'd like these trade ideas delivered straight to your email in the future.
Thanks for your continued support!

US SPX 500 - BIAS [Bearish]Dear traders!
Potential short is incoming. There is a possibility of a bearish continuation after a liquidity grab and a retest of a Supply zone.
Since we are bearish on HTF, I'm more focused on the bearish side. However, we still need confirmation from an LTF.
Good Luck!
DISCIPLINE
Strive for patience, perseverance, determination, & rational action.
Limit your losses, use stops.
Never cancel a stop loss order after you have placed it!
It's just an idea of mine.
However, everyone can share their thoughts in the comment section below.
Also, don't forget to support me! :)
Disclaimer: Trade at your own risk. I'm sharing my ideas and not giving trading advice.
Always plan your trade and trade your plan.

NZDUSD PENDING VIEW BUYING SOON NZDUSD TRADING BULLISH on this analysis we saw a bigger pattern from previous correction and then price broke-out from the large correction and form a continuation correction to continue the trend
#WHAT AM I EXPECTING:
am waiting for a continuation pattern around 2 reaction zone
#HOW DO WE ENTER:
if continuation pattern form get in on the break of ltf continuation correction
#TRADE INVALIDATION:
a bearish impulse form followed by a correction i.e trend change
#TRADE CRITERIA
#reduce risk on a ltf correction
#target 0.65786

USDJPY I Best place to swing short next week!Welcome back! Let me know your thoughts in the comments!
**USDJPY Analysis - Listen to video!
We recommend that you keep this pair on your watchlist and enter when the entry criteria of your strategy is met.
Please support this idea with a LIKE and COMMENT if you find it useful and Click "Follow" on our profile if you'd like these trade ideas delivered straight to your email in the future.
Thanks for your continued support!
