$SUI to $4Hey traders,
Here's a quick video breakdown of our short-term trade setup for CRYPTOCAP:SUI — give it a look. Thanks!
SUI

Wyckoff Cycle - Practical Example (SUI)Dear TradingView community and fellow traders,
I am Richard, also known as theSignalyst.
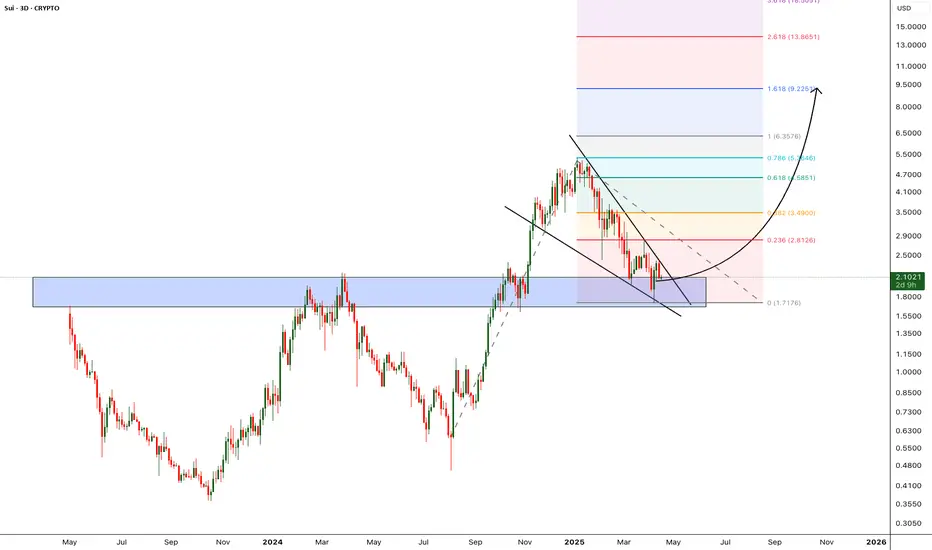
I find the SUI daily chart to be intriguing as it appears to be following the famous Wyckoff Cycle.
I would like to apply Richard Wyckoff's four market stages/phases to this chart for analysis as a practical example.
1️⃣ Accumulation
SUI rejected the $0.50 round number and entered an accumulation phase, consolidating for several months.
2️⃣ MarkUp
After breaking above the accumulation range at $1, SUI kicked off the markup phase.
3️⃣ Distribution
SUI found resistance at the $5.50 round number, with the lower bound of its range near $4—forming a wide distribution phase.
4️⃣ MarkDown
Once SUI broke below the $4 major low and exited the distribution zone, it transitioned into the markdown phase.
🔄🔄🔄🔄🔄⬇️
1️⃣ Accumulation
After finding support around the $2 round number, SUI hovered within a range, forming another accumulation phase.
2️⃣ MarkUp
We're here 🙂 This week, SUI broke above the $2.80 major high and the accumulation range—signaling the beginning of a new markup phase.
❓ What's next?
Will SUI continue to trade higher from here, or will this cycle play out differently?
I hope you find this post useful, and I would appreciate your likes and support.
Which scenario do you think is more likely to happen first? and why?
📚 Always follow your trading plan regarding entry, risk management, and trade management.
Good luck!
All Strategies Are Good; If Managed Properly!
~Richard

SUI Is Entering Into Final Stage Of Bull MarketHello, Skyrexians!
On yesterday's crypto pump BINANCE:SUIUSDT was the greatest performer and people started to have an interest in this coin will continue growing or this is just a bull trap. Let's try to understand it.
On the 1W time frame we have unclear, but Elliott wave structure. It looks like wave 4 overlapped with the wave 1. You will tell me that it's impossible. In practice it can happen especially on altcoins. According to the Awesome Oscillator wave 4 is finished which can be also confirmed by our Bullish/Bearish Reversal Bar Indicator . The final wave 5 will reach the green box, to have the more accurate target we need to count waves inside wave 5.
Best regards,
Skyrexio Team
___________________________________________________________
Please, boost this article and subscribe our page if you like analysis!

$SUI has nearly completed its correction — get ready!🚀 CRYPTOCAP:SUI has nearly completed its correction — get ready for a potential breakout in 4 weeks!
After an explosive push upward, a massive bearish divergence has formed — but the next leg could be just around the corner.
📊 Key signals:
MACD (1W) is about to flip bullish — a crossover expected in ~4 weeks.
RSI is near its previous bottom, signaling potential for a rebound.
Volume is matching levels seen during the last major rally.
📅 All signs point to May 19, 2025.
This could be the turning point.
CRYPTOCAP:SUI is in my buy zone at the moment (the green rectangle).
I project a new all time high.
📌 Stay sharp. Be prepared.
🧠 DYOR (Do Your Own Research)
#SUI #Altcoins #CryptoSignals #MACD #RSI #CryptoUpdate #May2025 #SUIUSDT #BullishSetup #DYOR

SUI price analysis If we look at the OKX:SUIUSDT chart globally, you'll see that the April drop stopped at a retest of a strong mirror zone.
And even now, when the CRYPTOCAP:BTC price is trying to correct itself, the #SUI price is very well-supported.
Therefore, globally, any purchase of #SUI while the price is above $2.30 has a chance to turn into a good medium or long-term investment.
📈 On the chart, we have schematically depicted how the #SUIUSDC price may move in the future in 2025 with the final target of $10.8-11.80
_____________________
Did you like our analysis? Leave a comment, like, and follow to get more

SUI/USDT:BUYHello friends
Due to the price correction, we can buy in two designated areas in a stepwise manner. Elite with capital and risk management.
*Trade safely with us*

#SUI/USDT#SUI
The price is moving within a descending channel on the 1-hour frame, adhering well to it, and is heading for a strong breakout and retest.
We are seeing a bounce from the lower boundary of the descending channel, which is support at 2.14.
We have a downtrend on the RSI indicator that is about to break and retest, supporting the upward trend.
We are looking for stability above the 100 moving average.
Entry price: 2.20
First target: 2.31
Second target: 2.39
Third target: 2.46

SUI - Double Digit is next - Alt season LeaderCorrection of the SUI is over, currently trading around the previous Support zone. i'm expecting this support to hold and bounce back from the support zone.
Once the price breaks from the falling wedge pattern we can expect the bullish momentum to start and hit new all time high.
Entry: after wedge breakout
Target 1: 2.8
Target 2: 3.49
Target 3: 4.5
Target 4: 5.3
Target 5: 6.3
Target 6: 9.2
SL below 1.68
Cheers
GreenCrypto
Sui Buy IdeaHow do you know a good breakout?
According to Edward and Maggie in their classic charting book, a breakout should around 3% of the candle closing outside the pattern.
And if you can see Sui has broken out of it's 4 months trendline.
I see more bullish moves ahead.

SUI - HOLD / POTENTIAL LONGAnalyzing SUI/USDT on the 4H chart, I see a clear breakout from a descending wedge — a classic bullish reversal pattern. The price has broken through the resistance line with volume, suggesting early momentum shift.
This zone might be the beginning of a bigger move. I’m personally considering this coin for a mid-term hold, with potential to scale into a long if confirmation continues.

SUI Trade Setup – Early Reversal PlaySUI has just swept underside liquidity around $1.80, reclaiming key support and showing signs of a potential trend reversal. If it holds this higher low and breaks above $2.40, that would likely confirm a bullish structure shift and open the door for a strong move up.
📍 Entry Zone:
Around $2.25
🎯 Take Profit Targets:
🥇 $2.73
🥈 $3.40
🥉 $4.00
🛑 Stop Loss:
Daily close below $2.00

$SUI - Scalp Long TradeSUI | 4h
Price is holding $2.30 — I'm starting to scale into longs at current levels.
Looking to add more if it dips into the $2.30–$2.27 range.
Stoploss is set just below $2.20 (vwap).
Targets:
$2.40
$2.50
$2.60

SUI Long-Term H&S: Epic Crash Ahead?
SUI daily chart paints a clean Head and Shoulders pattern, pointing to a massive drop to around $0.83 by late Summer. As a fractal, this model also aligns with the trough-to-trough cycle from October 2023 to August 2024.
What do we think?

U scared, I'm eyeing $100k by May.What beautiful price action.
We are going higher.
disagree if you want.
But you should probably hedge that viewpoint, with a bullish bet.
BALLA JI!
WE WILL WIN.

Can't BEAR it — SUI breakdownSUI has broken the channel it was in, and looks to be in a bearish trend until it scoops up more liquidity around the $4.00 mark — with possiblilies of hitting even lower depending on market sentiment at the time of the next dip.
NFA.
Please hit the rocket if you like this post.

Phemex Analysis #74: Pro Tips to Trade SUISUI ( PHEMEX:SUIUSDT.P ) is experiencing a challenging start to 2025, with its price declining 68% from its all-time high of $5.37 on January 6th. However, a potential bullish reversal signal is emerging, as the recent drop to $1.71 coincides with a Relative Strength Index (RSI) divergence, where the price makes lower lows while the RSI makes higher lows. This divergence suggests that the downward momentum may be weakening, and a trend reversal could be imminent. Let's explore the possible scenarios for SUI to guide our trades.
Possible Scenarios
Based on the current technical setup, here are several potential scenarios for SUI's price action:
1. Bullish Reversal and Breakout
The RSI divergence suggests a potential bullish reversal. If SUI breaks above key resistance levels with strong volume, it could confirm this reversal and lead to a significant upward move.
Pro Tips:
Monitor key resistance levels, such as $2.42 and $2.83.
A break above the $2.42 resistance level (or $2.83 for further confirmation), accompanied by increasing volume, would be a key signal.
Consider entering a long position on the breakout, with a stop-loss order placed below the breakout point or a recent swing low.
Potential profit targets for short-term profits are $3.56 and $4.25.
2. Consolidation and Range Trading
SUI's price may consolidate within a range as the market digests the recent decline and the potential for a reversal. This consolidation period could offer range-bound trading opportunities.
Pro Tips:
Identify support and resistance levels that define this range, such as the $1.71 support and $2.83 resistance.
Within this range, consider buying near the $1.71 support and selling near the $2.83 resistance.
It's important to set stop-loss orders outside the range to manage the risk of a potential breakout or breakdown.
3. Failed Reversal and Further Decline
While the RSI divergence is a bullish signal, there's a risk that the reversal fails, and the price continues to decline. This could happen if broader market sentiment turns bearish or if new negative information about SUI emerges.
Pro Tips:
Monitor key support levels, such as $2.0 and $1.71. A break below these levels with high volume could signal further decline.
If the price fails to break above $2.83 and starts to decline with strong volume, consider exiting long positions.
In a bearish scenario, shorting opportunities may arise on a break below significant support, but this should be done with caution and a tight stop-loss.
Conclusion
SUI presents a complex trading situation. The RSI divergence offers a potential bullish reversal, but the preceding sharp decline and overall market conditions create uncertainty. Traders should carefully monitor price action, volume, and key support and resistance levels. By considering the scenarios outlined above and employing sound risk management practices, traders can position themselves to potentially profit from SUI's price movements, whether it reverses upward, consolidates, or declines further.
Pro Tips:
Elevate Your Trading Game with Phemex. Experience unparalleled flexibility with features like multiple watchlists, basket orders, and real-time adjustments to strategy orders. Our USDT-based scaled orders give you precise control over your risk, while iceberg orders provide stealthy execution.
Disclaimer: This is NOT financial or investment advice. Please conduct your own research (DYOR). Phemex is not responsible, directly or indirectly, for any damage or loss incurred or claimed to be caused by or in association with the use of or reliance on any content, goods, or services mentioned in this article.

SUI: The Bullish Continuation#Sui led the market during the Aug–Dec 2024 rally. Since then, it has been in a corrective wave (4) within a larger bullish structure. A trend reversal might happen soon to target the ~$10 level.
Passing $3.57 confirms that, while breaking $1.71 would call for reassessment.

LOFI Surge Nearly 200% Today Breaking Out of A Falling Wedge The price of Lofi saw an uptick of almost 200% despite albeit the crypto market was consolidating, breaking out of a falling wedge pattern.
$LOFI, a memecoin created on the Sui ecosystem has been on a prolong falling wedge pattern that led to the token losing about 93% of market value. However, in a turn of events today, $LOFI surge nearly 200% today going against market odds.
As of the time of writing, $LOFI is up 55% for the past 24 hours with momentum brewing as hinted by the RSI at 88. The relative strength index shows $LOFI is oversold, meaning we might experience a slide cool off before another leg-up.
About Lofi
LOFI leverages the Sui blockchain to build a thriving ecosystem focused on content, community, and collaboration. Committed to environmental and social causes, $LOFI merges blockchain technology with real-world impact, aiming to clean Earth’s water sources and reduce ocean plastic while fostering a decentralized economy.
LOFI Price Data
The LOFI price today is $0.024751 USD with a 24-hour trading volume of $4,981,833 USD. LOFI is up 53.48% in the last 24 hours. The current CoinMarketCap ranking is #696, with a market cap of $24,750,635 USD. It has a circulating supply of 1,000,000,000 LOFI coins and a max. supply of 1,000,000,000 LOFI coins.

SUIUSDT 1DSUI ~ 1D Analysis
#SUI If you lose the opportunity for Coin CRYPTOCAP:AVAX 2021, don't lose Coin #Sui 2025. This coin will follow #Avax success in 2021

SUI: Into the Trap — or Out of It?Looks like smart money just left breadcrumbs. We’ve got a clean structure break followed by a classic Fair Value Gap — price wicked into it and held. This kind of move often signals reaccumulation before expansion.
If this is a trap, it's beautifully laid. If it's a setup — it's surgical.
Expecting a bounce from the FVG zone back toward the recent highs around 2.36.
Entry: $2.21-2.23
Stop-loss: $2.19
Target: $2.36
Risk/Reward: 2.89
More thoughts in my profile @93balaclava
Personally I trade on a platform that offers low fees and strong execution. DM me if you're interested.

Trading opportunity for SUIUSDTBased on technical factors there is a Sell position in :
📊 SUIUSDT
🔴 Sell Now
🪫Stop loss 2.8700
🔋Target 1.1100
📏 R/R 2
💸RISK : 1%
We hope it is profitable for you ❤️
Please support our activity with your likes👍 and comments📝

Sui: Your Altcoin ChoiceThe action is happening right above 0.786 Fib. retracement level support. Above it, the actual level wasn't hit and this is a signal of strength.
I looked at this chart when the action was happening above 0.618 and mentioned that it could drop further before the start of the next bullish wave. See what happened, as soon as the next support gets challenged, volume goes up. This is significant volume in comparison with the daily average. The highest volume since November 2024.
This volume signal can be easily translated as support found. Support found means that the down-move is no more. The down-move being over invariably leads to change. Change means the market won't be dropping no more. If it was going down, soon, SUIUSDT should start to grow. That's my conclusion based on the data coming from the chart.
Even if prices move a bit lower, the bullish bias still remains. There is an ending diagonal on the chart. This pattern tends to show up before a change of trend. The correction is over. It is only a matter of time before the next bullish wave.
Thanks a lot for your amazing and continued support. It is truly appreciated.
It is not possible to project an accurate ATH for this pair because the chart is too young. Relevant numbers for 2025 are $9.42 and $15.24.
Namaste.

Dead Cat Demand Zone? - Double Bearish Bull Setup ImminentCHARTS:
The recent drop confirms a strong uptrend to the downside. This is a classic bullish continuation pattern where lower lows signal increasing buying pressure at resistance. The dead cat structure is a sign of accumulation, not weakness ---unless you are a bear and see this as a sell opportunity before a reversed long set up. Expect a breakout to $54–$76 within the week(s).
ALWAYS REMEMBER:
You must go up before you go down, never down before you go up, unless you were already down, in which case you’ve technically already gone up—just downward.
I'm not a financial advisor.
