SUI Drip Drip Driping DownSUI is looking more like it's 4th wave is going to go down a bit more before it can bounce up to $4.00. I really was hopeful that May 5th's $3.26 was it's recent retracement bottom... but it looks like we are about to revisit $3.26 and go even lower.
My target range is between $2.80 and $3.08, with my best guess as $2.88 as it will touch a previous high and will settle near the fib golden zone.
At the time I am posting this, the price is hovering around $3.24 and BTC is nearing 94k.
I think the market overall is going to be very nervious on 6 May, the day before the Fed's 7th May meeting.
Suiusdt

SUI Looks Bearish (2H)From the point where we placed the red arrow on the chart, it appears that the correction in SUI has begun.
An expansionary wave structure is visible, which could potentially push SUI toward the green zone.
Targets are marked on the chart. As long as the supply zone holds, the price may move toward the targets and the green box.
A 4-hour candle closing above the invalidation level will invalidate this analysis.
For risk management, please don't forget stop loss and capital management
When we reach the first target, save some profit and then change the stop to entry
Comment if you have any questions
Thank You

$AVAX/USDT Trade Setup - Daily TF$AVAX/USDT Trade Setup – Daily TF
#AVAXUSDT has broken a multi-month downtrend and is retesting a key demand zone, offering a clean long opportunity.
Entry: $19.70–$20.00
Stop Loss: $15.00
Targets: $27 / $35 / $55
Invalidation: Close below $15... DYRO, NFA
Watch for a bullish confirmation before entry.
Swing setup with strong potential if the demand holds.

TradeCityPro | SUI: Bullish Push Faces Key Resistance Test👋 Welcome to TradeCity Pro!
In this analysis, I want to review the SUI coin for you. It's one of the DeFi layer-1 projects that was highly hyped in 2024 and has recently gained renewed attention due to some news from the project.
🔍 This project's coin, with the symbol SUI, has reached a market cap of $11.3 billion, ranking it 11th on CoinMarketCap.
📅 Daily Timeframe
As you can see in the daily timeframe, since the last analysis I shared in this channel, the price has rebounded from the support zone I highlighted and, after breaking the trendline, made a bullish leg up to 3.6402.
📊 A significant amount of buying volume has entered the market, and the RSI has entered Overbuy territory. These two factors drove the bullish move, and the 3.6402 resistance is a key level that has temporarily held off further price increases.
✔️ Currently, we’re seeing a few corrective candles that caused the price to reject from this resistance, but it's holding up well and still looks poised to move back toward this level.
🛒 For spot buying, if the price moves back toward this area, you can enter a position on a break of 3.6402. The next trigger is the break of 4.0866, and the main resistance ahead is 5.2689.
🔽 If a correction occurs, support levels are 2.7830 and 2.2495. If price retraces, these can serve either as short targets or long entry zones depending on the price reaction.
📉 Confirmation of trend reversal would come if the price fails to make a higher high above 3.6402 and breaks the current low. After that, we can consider opening a short position.
📝 Final Thoughts
This analysis reflects our opinions and is not financial advice.
Share your thoughts in the comments, and don’t forget to share this analysis with your friends! ❤️

SUI SIGNAL...Hello friends
As you can see, buyers entered the price correction and a reversal pattern is being built...
Due to the buying pressure and the entry of buyers, we can buy within the specified ranges and move towards the set targets, of course with capital and risk management.
*Trade safely with us*

SCRTUSDT UPDATE
SCRT Technical Setup
Pattern: Falling Wedge Breakout
Current Price: $0.2453
Target Price: $0.59
Target % Gain: 160.55%
Technical Analysis: SCRT has broken out of a falling wedge on the 1D chart, indicating a bullish reversal. The breakout is confirmed with strong green candles and volume build-up.
Time Frame: 1D
Risk Management Tip: Always use proper risk management.

DEXEUSDT UPDATE
Pattern: Bullish Pennant Pattern
Current Price: $14.835
Target Price: $26.61
Target % Gain: 80.18%
Technical Analysis: DEXE has broken out of a descending triangle pattern on the 1D chart. The breakout is supported by a strong bullish candle and sustained price action above the trendline resistance, indicating momentum toward the target.
Time Frame: 1D
Risk Management Tip: Always use proper risk management.

SUI - A closer lookIn my previous SUI analysis, I currently have us in an impulse structure leading into the 5th wave.
Zoomed out, it seems we're still in a corrective structure. Looking to short at the TP of the long.

KAVAUSDT UPDATEPattern: Falling Wedge Breakout
Current Price: $0.4567
Target Price: $0.74
Target % Gain: 60.53%
Technical Analysis: KAVA has broken out of a long-term falling wedge on the 1D chart, with strong bullish momentum and price closing above the trendline resistance. This breakout signals potential continuation toward the projected target.
Time Frame: 1D

SUI - Incoming wave 5Wave structure is very defined.
Currently looking for the completion of this corrective sequence of Wave 4 before we bounce at the key level 38.2%.
Targeting the high.
SUIUSDT Potential DownsidesHey Traders, in today's trading session we are monitoring SUI/USDT for a selling opportunity around 3.40 zone, SUI/USDT is trading in a downtrend and currently is in a correction phase in which it is approaching the trend at 3.40 support and resistance area.
Trade safe, Joe.

SEI LIMIT FOR BUYHello friends
Due to the price drop, we can buy on the drop within the specified limits and move with it to the specified targets, of course with capital and risk management.
*Trade safely with us*

LISTAUSDT UPDATELISTAUSDT Technical Setup
Pattern: Falling Wedge Breakout
Current Price: $0.1893
Target Price: $0.30
Target % Gain: 60.04%
Technical Analysis: LISTA has broken out of a falling wedge pattern on the 12H chart with increasing momentum. Price is holding above the breakout trendline, suggesting bullish continuation. A confirmed breakout with volume could push price to the projected target.
Time Frame: 12H
Risk Management Tip: Always use proper risk management.

SUI/USDT Long Entry at 3.507 (10x Leverage) | Strategy in PlayEntered a long position on CRYPTOCAP:SUI at 3.507 with 10x leverage. Current price action is hovering near entry. Watching key levels:
🔹 Target Zone: 3.8760+
🔻 Support Zone: ~3.25 (highlighted for potential SL zone)
🧠 TP (Take Profit) and SL (Stop Loss) will be updated as the move develops.
Keep an eye on price reaction around the support-resistance flip zone.

SUI A&E or pullback firstAs BTC is keeping the line it looks lik it will pump towards 100K. In that level we can see a pull back to cool off the RSI.
SUI is looking strong and made u huge revovery from the $1,70 level from the 7th of april. In teh 4 h Charts we cab see an Bull Flag pattern, wit a deviation of the high in this pattern.
We need to see the recovery of the $3,86 level that must get support in orde to stay bullisch on the short term. Isn't this leven in soon then we can expect more retracement in the price alle the way towards the MA100 around $2,95 or even the MA200 at a level of $2,55.

$DOGS/USDT Breakout alert📈 $DOGS/USDT Breakout Alert
DOGS just broke out of its long-term descending wedge — a bullish signal!
- Trendline cracked
- Support held
- Reversal brewing?
One to watch. DYOR!

SUI sell pressure incoming can it hold the line?SUI unlocks could cause dilution-sell pressure; however, if the SUI bulls are strong enough, they may absorb the unlock. Momentum is overbought and could come down, which is a good recipe to buy the dip.
Full TA: Link in the BIO

MAGICUSDT UPDATE
MAGIC Technical Setup
Pattern: Symmetrical Triangle Breakout
Current Price: $0.2253
Target Price: $0.290,
Target % Gain: 30.06%
Technical Analysis: MAGIC has broken out of a symmetrical triangle on the 4H chart with a strong green candle and volume spike, signaling bullish momentum and a potential 30% upside move.
Time Frame: 4H
Risk Management Tip: Always use proper risk management.

SUI/USDT 1H: Markup Phase – Long Setup Above $3.60SUI/USDT 1H: Markup Phase – Long Setup Above $3.60
🚀 Follow me on TradingView if you respect our charts! 📈 Daily updates!
Current Market Conditions (Confidence Level: 8/10):
Price at $3.60, showing strong bullish momentum following recent accumulation phase.
Hidden bullish divergence on RSI confirms internal strength and supports upward continuation.
Smart Money accumulation completed, premium zone established at $3.80.
Trade Setup (Long Bias):
Entry: $3.60 – $3.62 zone.
Targets:
T1: $3.80
T2: $3.90
T3: $4.00
Stop Loss: $3.40 (below Fair Value Gap support).
Risk Score:
8/10 – Clear breakout structure supports bullish thesis, minor risk due to proximity to premium resistance zones.
Key Observations:
Strong support confirmed at $3.40 FVG level.
Volume profile indicates heavy accumulation below $3.60, now transitioning to expansion.
Distribution phase expected above $3.90 if targets are reached.
Market Makers likely preparing to offload positions near $4.00 zone.
Recommendation:
Long positions favored within $3.60 – $3.62 entry range with tight stop loss at $3.40.
Scale partial profits at $3.80 and $3.90 to secure gains, leaving runners towards $4.00.
Monitor price action closely near $3.80 for possible early rejection or continuation signals.
🚀 Follow me on TradingView if you respect our charts! 📈 Daily updates!

SUI UPDATEHello friends✌
As you can see, after a price drop, buyers were able to break the downtrend and form an ascending channel, which, given the entry of buyers, we can buy in batches with capital and risk management to move towards the specified goals.
*Trade safely with us*

$PEPESUI Surged 580% to Reclaim the $1Mln Mkt Cap ThresholdThe $PEPESUI coin has surged 580% for the past 8 days to reclaim the $1 Million market cap threshold, enroute to $3 million market cap with an 80% surge as confirmation.
The 4-hour price chart depicts the formation of a cup and handle pattern, a pattern generally seen as a bullish pattern and for a project sitting at just $1.22 Million in market cap this SUI project might just be the catalyst for the 2025 bull run.
With anticipated CEX listings and the unveiling of their NFT's with a minimum supply of 420, $PEPESUI is poised to reclaim the $3 Million market cap and beyond with the growing hype and adoption of the CRYPTOCAP:SUI ecosystem, The blue frog might just outpaced the original CRYPTOCAP:PEPE token but only time shall tell.
As of the time of writing, CRYPTOCAP:PEPE Sui is up 22% trading within a bullish pattern forming the wedge of the cup formed. We might experience a respite before a major leap ahead.
About Pepe on Sui
Pepe on Sui is a meme coin project that leverages the Sui blockchain to create a unique and engaging digital asset. Launched in October 2024, the project combines the viral appeal of the Pepe the Frog meme with the technological advantages of the Sui blockchain. It aims to offer a fun and community-driven experience for its users while providing practical utility within the blockchain ecosystem.
Pepe on Sui Price Data
The Pepe on Sui price today is $0.000000002985 with a 24-hour trading volume of $56,415.76 USD. Pepe on Sui is up 16.61% in the last 24 hours. The current CoinMarketCap ranking is #4189, with a market cap of $0.000000002985. The circulating supply is 420,690,000,000,000 PEPE. supply of 420,690,000,000,000 PEPE coins.

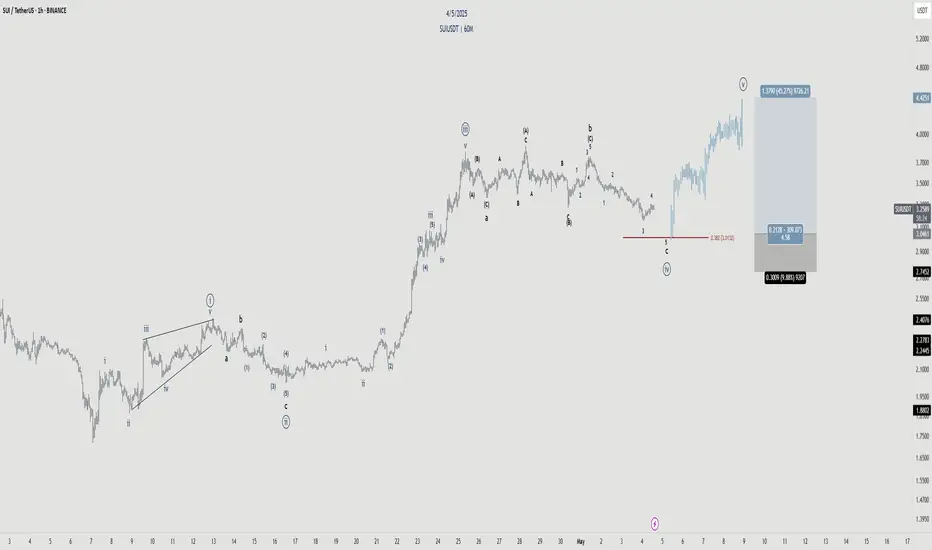
Fibonacci Setup: SUI Targeting 4.40 With 26% Upside RoomHello and greetings to all the crypto enthusiasts, ✌
All previous targets were nailed ✅! Now, let’s dive into a full analysis of the upcoming price potential for SUI 🔍📈.
SUI has demonstrated remarkable growth in recent days and is now nearing a key resistance level. Based on Fibonacci analysis, I anticipate an additional 26% upside potential. My primary price target is set at 4.40, with key support levels clearly identified.📚🙌
🧨 Our team's main opinion is: 🧨
SUI has surged recently, is close to major resistance, and with support mapped by Fibonacci, I’m aiming for a main target of 4.40 — expecting about 26% more upside.📚🎇
Give me some energy !!
✨We invest hours crafting valuable ideas, and your support means everything—feel free to ask questions in the comments! 😊💬
Cheers, Mad Whale. 🐋

Inverted Head and Shoulders Pattern🚨 SUI Forming Bullish Inverted Head and Shoulders Pattern 🚨
SUI appears to be forming a bullish inverted head and shoulders pattern. For confirmation of this bullish pattern, the price needs to break out above the neckline, which is marked in red.
📈 Technical Overview:
Pattern: Bullish Inverted Head and Shoulders
Neckline: Red resistance level
Confirmation: A breakout above the red neckline will confirm the bullish pattern.
🎯 Potential Move: Bullish continuation upon confirmation of the breakout.
