EU Short idea 1:5RRMy short idea what I am waiting for.
I will execute this trade only if I see the confirmation entry on LTF (1m and 5m). So will see.
Supplydemandanalytics

Gold sell long term are you ready ?don,t missed the ralley Gold sell long term are you ready ?don,t missed the ralley .market this time at a weekly supply zone. we expect bearish move .next target is demand zone

JICPT| EURUSD daily short setup(1.0174-1.0213) with T1 & T2Hello everyone. Euro has been struggling around 1 against the dollar for sometime.
This is a simple short setup on the daily chart with reasons below:
1. Downtrend line
2. 61.8% fib retracement
3. not bad supply zone
I'd like to set an alert round the zone. Zoom in on the 4H or 1H for reversal pattern. Fundamentally, I do think the worst is yet to come. The energy crisis is expected to be even worse in the winter. I don't think market has fully priced in. Previously low 0.9875 would be target 1. I use measured move ab=cd to guess the aggressive target which is around 0.9564.
What do you think? Give me a like if you're with me.

JICPT| NQ rebounded from previous low with ab=cd pattern formedHello everyone. NQ has been down by more than 13% since Sept. 13th. Now sellers look to take a breath around previous low created in June after massive sell-off.
With the confluence of previous low, I also noticed that ab=cd pattern formed. The tech-heavy index is likely to rebound to level 12041- 12174 which happens to be 61.8% fib level.
What do you think? Give me a like if you're with me.

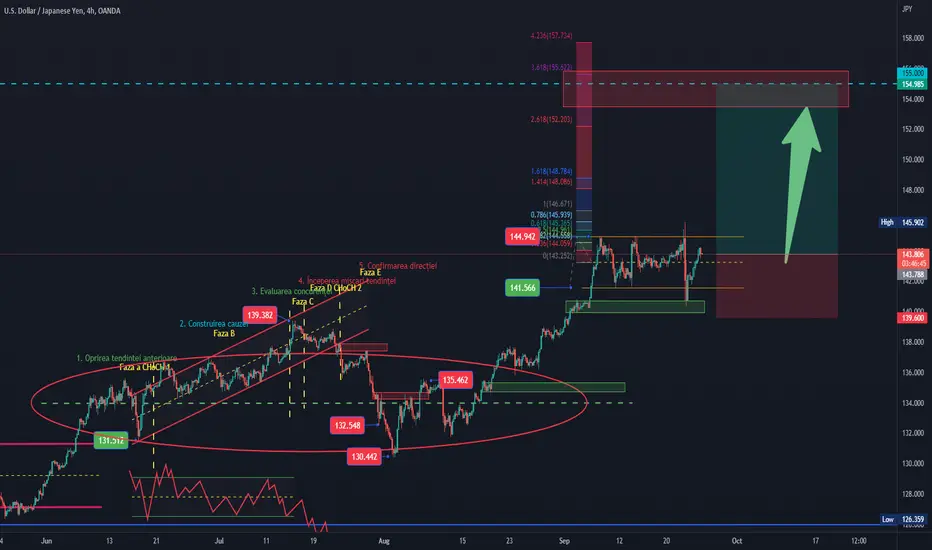
Wyckoff Supply and DemandUSDJPY
Technical analysis
Cause, re-accumulation, equilibrium sequence between demand and supply between quotas , supply zone 144.942 & 141.566 demand zone .
Demand greater than Supply !
Implications,long!
Pattern Rally base Rally!
Effect generated by approx
1115 pips.
SL 138.948
Entry , buy! 143.759
TP 155.000
⭕ = circle
⏹ = square
🔺️ = triangle
Unit = ⭕ market
Polarity = 🔺️demand & 🔻supply
Equilibrium = ⏹ range ("the ratio between supply and demand is =")
PRINCIPLE OF DEMAND AND SUPPLY
The law of supply and demand
- here the analysts study the relationship between supply and demand , having as a reference point the price and
volume over a period of time as shown on the chart.
KEY DEFINITION
The law of supply and demand is of the utmost importance. If the application to
buy an instrument (currency pairs, stocks, commodities , metals, bonds, cryptocurrencies)
is higher than the available supply, the only way the demand can be met is
for the price to rise to a level that attracts enough supply to match demand.
When this point is reached, the price does not advance. If the offer to sell is
higher than the demand to buy, the only way the supply will be absorbed is as
the price drops to a point that attracts enough demand to absorb all
the amount. When that happens, the price doesn't go down.
GBPUSD quarterly breakGBPUSD broke the quarterly low. HTF im looking for a sell setup but internally i think there's an opportunity to scalp towards supply zones. Here is a 15m supply and demand refined markups. I just posted 15m due to chart restriction on resolution.

USDT.DPlan 1:
Up 7.38 >>> 8.7
Down 8.7 >>> 4.xxx
Plan 2:
Up 7.38 >>>> 10. xx
Down 10. xx >>>> 8.xxx
Up 8.xxx >>>> 9.xxx
Down 9.xxx >>> 4.xxx

USDJPY is still bullishWe all know about the USDJPY supper bullish trend! Considering Japaneses officials speeches over yen, a correction was expected but who knows if it's just a correction or a reversal?
I see good probabilities for a good R to R around coincidence of Bullish channel Mid-line, consolidations range occurred between 1st to 5th of September ( which is a base candle in HTF) and probable MA100 dynamic level.

Eurjpy ready to big drop enter with beginning trendEurjpy ready to big drop enter withthe beginning trend we expect market ready to drop we will enter from supply zone.

GBPUSD sell opportunityGBPUSD sell opportunity, focus on my supply zone if you get confirmation then sell

Quick daytrade on gold [XAUUSD]Gold made a sharp upside move this Monday and I believe it might keep pushing upwards this week.

VISAGAR FINANCIAL SERVICES (BSE) - LONG TERM BULLISHLONGTERM BUY 2-3 YEARS
VISAGAR FINANCIAL SERVICES : BSE
CMP 1.68
STOPLOSS - 1.30 (19%)
TARGET - 3.68 (125%)
1:6 - RISK:REWARD
**This is Educational post only. Please concern with your adviser before investing in market related securities**

Gold ready to more down continue Gold is ready to move down continue we expect gold downside move to continue because the trend is bearish so we are waiting for the demand zone to break if the demand zone break then the next target is 1687

GOLD Supply & Demand Daytrading
4H price might have created new LH and going for another LL
15M waiting possible entry from this supply zone

EURUSD Supply & Demand Daytrading1st. EURUSD 4H we are in down trend /overall bias is bearish /
2nd. Expecting price to break from this channel /price got spiked and took significant amount of liquidity on last LH/
3rd. On 15M we got break of structure forming new LL and expecting price to retest that level and fill that void below.
4th. Entered with limit order at bottom level of supply area, target is swing low on 15M.

TA 2022-08-29: DXYThere is a chance of correction in the DXY index. I will set up my trading basis this week, according to this analysis.

XAUUSD LONG UNTIL 1775
If u like this type of analysis give rockets so it can reach to more people and analysis worth it
#XAUUSD looking for short term long
Hello world
As we can see in chart we had an CHOCH and BOS in Daily timeframe which indicating us a Reversal was goingto occur yesterday took an stop out where market just tapped the 1728 level as an SR Flip and bounced from there
for today im expecting to had some Filp where supply and demand Flip and Bounce to another Breakout
If u like this type of analysis give rockets so it can reach to more people and analysis worth it

JICPT| USDCNH is likely to test 7.01Hello everyone. USDCNH has been moving sideways for the past 3 months until the weaker-than-expected July economic data released this week. In addition, the unexpected rate cut to MLF gave a boost to the pair.
The offshore Chinese currency fell sharply against the dollar by over 700 bps. Now, it pulled back from the previous high around 6.83.
Technically, the all my moving averages are heading to the upside, with a quick retest of my long key MA. That may indicate that previous high is likely to be penetrated. By the measure move method, the upper range after the breakout is 7.01. The weaker Renminbi can help China's export, offsetting the impact of sluggish domestic demand. Companies and consumers are reluctant to take on more debt amid fresh Covid flare-ups.
What do you think? Give me a like if you're with me.

JICPT| NQ touching nearest demand zone on the dailyHello everyone. NQ has been retreated from key fib level of around 13744 last Wednesday.
Now, it's approaching the nearest demand zone on the daily(12740-12930). That's a 210 points wide range, coincided with flip level.
I would like to see if the zone will the respected. If so, Previous high around 13744 would be the short-term target.
It'll be a volatile week as Fed chair Jerome Powell would comment on inflation at the Central bank's annual Jackson Hole economic symposium. Investors will digest what he says and bet on how much Fed will hike the interest rate. Would it be 75bps or 50bps?
What if the zone gets violated? 12150-12038 would be served as the second defense zone. What do you think? Give me a like if you're with me.

EURAUD NEXT MOVEConsidering the price reaches the demand area, we expect to see a downward trend after hitting this area.

GBP/USDOn the start days of this week GBPUSD will touch 1.19 zone, pretty sure a golden week, c u on the winners side guys... lol

XAU/USDJust updated my idea about XAUUSD because it seems like its not going to retest but i still leave a BuyLimit like I said on my last post, just opened a trade on this price and we goin to blow up the week prob. lol

XAUUSDSharing my thoughts about XAU/USD, this is my favorite pair and its first time to share my ideas overhere.
I always trade with Buy/Sell Limit with selected zones supply/demand and fibo... hope y'all a profitable week.
