GOLD Technical Analysis - Deeper Pullback in PlayOANDA:XAUUSD remains within a broader ascending channel, but recent price action suggests that the market is undergoing a deeper corrective phase. Following a prolonged bullish rally, price appears overextended and is now pulling back more decisively.
This correction aligns with expectations for a healthy retracement after such strong upward momentum. I anticipate that the pullback will extend further toward the $3,160 level, a key technical level defined by the confluence of horizontal support, ascending trendline support, and the 0.618 Fibonacci retracement of the latest bullish impulse.
This zone will be critical for determining whether the broader bullish structure remains intact. If price holds at this level and shows signs of reversal, it may present a strong re-entry opportunity for buyers. However, a decisive break below this zone would invalidate the current bullish structure and open the door to a deeper correction.
Always confirm your setups and trade with a proper risk management.
Best of luck!
Support_and_resistance

BITCOIN Trending Higher - Will Buyers Push Toward $104,550?COINBASE:BTCUSD has broken above a key resistance zone and is now pulling back for a potential retest. This area previously acted as resistance and may now serve as support, aligning with a potential bullish continuation.
If buyers confirm support at this level, the price is likely to move upward toward the $104,550 level, which serves as a logical target for this setup. Conversely, a failure to hold support could signal a potential bearish shift.
Traders should monitor for bullish confirmation signals, such as bullish engulfing candles, strong wicks rejecting the support zone, or increased buying volume, before considering long positions.
Let me know your thoughts or any additional insights you might have!


CHFJPY - Sell Setup at Key Resistance LevelOANDA:CHFJPY has reached a significant resistance zone, marked by prior price rejections and strong selling pressure. This level has historically acted as a key supply area, increasing the likelihood of a bearish bounce if sellers regain control.
With the price now testing this resistance, I anticipate a potential downward move toward the 172.650 level, which represents a logical target for this setup. Traders should watch for confirmation signals, such as bearish engulfing candles or rejection wicks, to validate the potential for a reversal.
Do you agree with this analysis? Let me know your thoughts in the comments!

Bearish Weekly Candle.Bearish Weekly Candle.
Capped & then heavy selling (today).
Last candle - Doji
Immediate Support Zone is around 58 - 63.
Reversing from this support zone would
expose 75 - 77 again.
Its safe as long as it stays above 36.

XAUUSD UPDATE : NFP hi everyone
I hope you were able to ride the market based on the previous trade idea.
Gold has broken below the daily support level, and the current upward movement is likely just a retracement. Therefore, both my Plan A and Plan B focus on short positions. For a stronger bullish move, the price needs to form a lower low—at least on the H1 timeframe.
good luck all
**My trading strategy is not intended to be a signal. It's a process of learning about market structure and sharpening my trading my skills also for my trade journal**
Thanks a lot for your support

NZDCAD at Key Resistance Level: Will it Drop To 0.81608?OANDA:NZDCAD is approaching a key resistance level that has previously acted as a strong barrier, triggering bearish momentum in the past. This zone also aligns with prior supply areas where sellers have stepped in, making it a potential point of interest for those looking for short opportunities. Given its historical significance, how price reacts here could set the tone for the next move.
If bearish signals emerge, such as rejection wicks, bearish candlestick patterns, or signs of weakening bullish pressure, I anticipate a move toward the 0.81608 level. However, a clear breakout above this resistance could challenge the bearish outlook and open the door for further upside. It's a pivotal area where price action will likely provide clearer clues on the next direction.
Just my take on support and resistance zones, not financial advice. Always confirm your setups and trade with a proper risk management.
Best of luck!

GBPCAD at Key Resistance Level: Will it Drop To 1.83680?OANDA:GBPCAD has reached a significant resistance zone, marked by prior price rejections and strong selling pressure. This level has historically acted as a key supply area, increasing the likelihood of a bearish bounce if sellers regain control.
With the price now testing this resistance, I anticipate a potential downward move toward the 1.83680 level, which represents a logical target for this setup. Traders should watch for confirmation signals, such as bearish engulfing candles or rejection wicks, to validate the potential for a reversal.
Do you agree with this analysis? Let me know your thoughts in the comments!

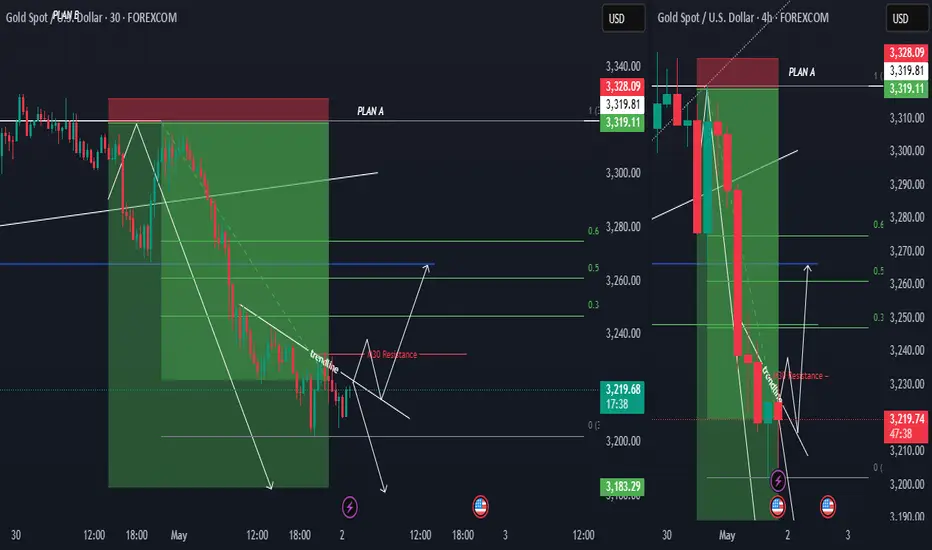
XAUUSD UPDATEHi all
The rejection at the 3202 level, Plan A remains a strong possibility, especially if the trendline also shows signs of resistance. However, if the trendline breaks, then Plan B would be the preferred approach—waiting for a confirmed breakout on the 30-minute timeframe before considering a long position.
Keep a close watch on price action and ensure strong confirmation before making any moves. Feel free to share any updates or additional insights. Wishing you success in trading!
good luck all
**My trading strategy is not intended to be a signal. It's a process of learning about market structure and sharpening my trading my skills also for my trade journal**
Thanks a lot for your support
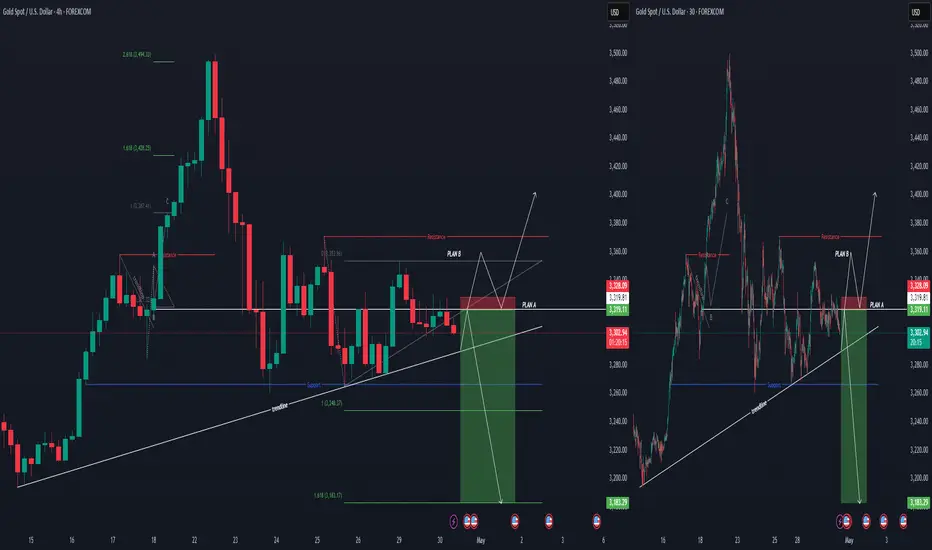
XAUUSD TRADE IDEA
Hi everyone,
here is my gold price movement forecast. My forecast tends to lean towards temporary strength for gold. Therefore, if there is a rejection at the trendline on the H4, I will wait for the price to come back to 3320 before shorting gold... If the price successfully breaks the entry price and makes a new high, I will look for opportunities to long towards 3402.
good luck all
**My trading strategy is not intended to be a signal. It's a process of learning about market structure and sharpening my trading my skills also for my trade journal**
Thanks a lot for your support
AUDNZD at Key Support Level: Will Buyers Step In?OANDA:AUDNZD has reached a major support level, marked by prior price rejections and strong buying pressure. This area has historically acted as a demand zone, increasing the likelihood of a bullish reaction if buyers step in again.
The current market structure suggests that if the price confirms a rejection from this support level, there is a high probability of an upward move. I anticipate that, if rejection occurs, the market may head higher toward the 1.07940 level, which serves as a logical target within the current structure. However, a break below this support would invalidate the bullish bias and could lead to further downside.
This setup reflects the potential for a retracement after an impulsive move, supported by the confluence of previous price behavior and the current structure. If you agree with this analysis or have additional insights, feel free to share your thoughts in the comments!

NZDCAD Discretionary Analysis: Bounce at 0.83Hello traders and happy Easter Monday!
I'm expecting a bounce on NZDCAD. I'm interested in this 0.83 zone. It might turn into a strong bounce point. If the signs are there, I'm jumping in with a short.
Discretionary Trading: Where Experience Becomes the Edge
Discretionary trading is all about making decisions based on what you see, what you feel, and what you've learned through experience. Unlike systematic strategies that rely on fixed rules or algorithms, discretionary traders use their judgment to read the market in real time. It's a skill that can't be rushed, because it's built on screen time, pattern recognition, and the ability to stay calm under pressure.
There's no shortcut here. You need to see enough market conditions, wins, and losses to build that intuition—the kind that tells you when to pull the trigger or sit on your hands. Charts might look the same, but context changes everything, and that's something only experience can teach you.
At the end of the day, discretionary trading is an art, refined over time, sharpened through mistakes, and driven by instinct. It's not for everyone, but for those who've put in the work, it can be a powerful way to trade.

$RBN | Showing glimpses of lifeAdded to my Altcoin Portfolio:
• COINBASE:RBNUSD @ $0.13876 bringing my average cost from $0.17 -> $0.1511
Notes/Thoughts: Typically I would wait until the Weekly Close for my buys as it’s only Tuesday but I like the market pump currently & perceived momentum plus price is still held in a Weekly Demand area without collapse.

EURCAD Approaching Major Resistance - Will Sellers Step In?OANDA:EURCAD is approaching a key resistance level, marked by significant selling pressure. This area has historically acted as a key supply zone, increasing the likelihood of a bearish reaction if sellers step in again.
The current market structure suggests that if the price confirms a rejection from this resistance level, there is a high probability of a downward move. I anticipate that if rejection occurs, the market may head lower toward the 1.57500 level, which serves as a logical target within the current market structure. However, a break above this resistance would invalidate the bearish bias and could lead to further upside.
This setup reflects the potential for a retracement after an impulsive move, supported by the confluence of previous price behavior and the current structure. If you agree with this analysis or have additional insights, feel free to share your thoughts in the comments!

GOLD Bullish Continuation - Is $3,600 the Next Stop?OANDA:XAUUSD is trading within a well-defined ascending channel, signaling strong bullish momentum. The price has consistently respected the channel boundaries, forming higher highs and higher lows, which aligns with the continuation of the uptrend.
It has recently broken above a key resistance zone and is now pulling back for a retest. This area previously acted as resistance and may now serve as support, aligning with a potential bullish continuation.
If buyers confirm support at this level, the price is likely to move upward toward the $3,600 level, which aligns with the upper boundary of the channel. This setup reflects the potential for further bullish movement as buyers continue to dominate the market.
Traders should monitor for bullish confirmation signals, such as bullish engulfing candles, strong rejection wicks from the support zone, or increased buying volume, before considering long positions.

USDCHF Discretionary Analysis: Bounce at 0.85Hello traders.
I'm anticipating the momentum on USDCHF to carry on. Got my eyes locked on the 0.85 area. It might turn into a strong bounce point. If the signs are there, I'm jumping in with a short.
Discretionary Trading: Where Experience Becomes the Edge
Discretionary trading is all about making decisions based on what you see, what you feel, and what you've learned through experience. Unlike systematic strategies that rely on fixed rules or algorithms, discretionary traders use their judgment to read the market in real time. It's a skill that can't be rushed, because it's built on screen time, pattern recognition, and the ability to stay calm under pressure.
There's no shortcut here. You need to see enough market conditions, wins, and losses to build that intuition—the kind that tells you when to pull the trigger or sit on your hands. Charts might look the same, but context changes everything, and that's something only experience can teach you.
At the end of the day, discretionary trading is an art, refined over time, sharpened through mistakes, and driven by instinct. It's not for everyone, but for those who've put in the work, it can be a powerful way to trade.

Yen Outlook: Preparing for the Coming Week! During the recent short trading week, we did not observe significant changes in the portfolios of major players. No outflows or overbought conditions—this indicates that the targets remain unchanged, and we are getting closer to the 0.0072 mark. 📊
I recall how, back in mid-December of last year, we noticed the first signs of volume accumulation in the portfolio. It felt like discovering a new horizon! We shared this insight with our subscribers, allowing us to prepare a plan in advance and identify well-founded entry points for the rise of the yen futures. 🚀
Currently, as we maintain a long position on the futures (or a short on the dollar/yen pair), it is essential to keep in mind the boundaries of the expected volatility range.
We have marked these on the chart: the yellow rectangle for Monday and the red rectangle for the upcoming week. 📅
Given the sustained positive sentiment surrounding yen futures, opening a long position as the price approaches the lower boundary of the range could present an excellent opportunity . As indicated by the arrows on the screenshot, don’t miss your chance! 🎯
Summary, we see that the yen continues to be in focus, and we have a clear action plan. We are holding our long position, monitoring the range boundaries, and preparing for the opportunities the market presents. 🌈
No Valuable Data, No Edge!

BTC POTENTIAL TRIPLE TOP PATTERNhi
From the previous chart, the price successfully broke through the upper trendline and started to rise. This could indicate that bullish momentum is taking over. Waiting for the price to break the upper trendline is a solid strategy for confirming bullish momentum. However, there is a potential triple top pattern forming, which could indicate that the price may face rejection at a key resistance level 86056.35
If the triple top pattern becomes more apparent and the price fails to break above resistance, it could signal the start of a bearish move. In this scenario, trading volume and price action around the resistance zone are crucial to observe. If volume declines and selling pressure increases, the price may drop further.
good luck
**My trading strategy is not intended to be a signal. It's a process of learning about market structure and sharpening my trading my skills also for my trade journal**
Thanks a lot for your support

GBPUSD Discretionary Analysis: Bounce at 1.33Hello traders.
On GBPUSD, I'm watching this 1.33 zone closely. It's where I'll be looking for a reaction. It can be a solid bounce spot if it shows signs.
Discretionary Trading: Where Experience Becomes the Edge
Discretionary trading is all about making decisions based on what you see, what you feel, and what you've learned through experience. Unlike systematic strategies that rely on fixed rules or algorithms, discretionary traders use their judgment to read the market in real time. It's a skill that can't be rushed, because it's built on screen time, pattern recognition, and the ability to stay calm under pressure.
There's no shortcut here. You need to see enough market conditions, wins, and losses to build that intuition—the kind that tells you when to pull the trigger or sit on your hands. Charts might look the same, but context changes everything, and that's something only experience can teach you.
At the end of the day, discretionary trading is an art, refined over time, sharpened through mistakes, and driven by instinct. It's not for everyone, but for those who've put in the work, it can be a powerful way to trade.

GBPUSD at Key Resistance - Time to Sell?OANDA:GBPUSD has reached a key resistance level, marked by significant selling pressure. This area has historically acted as a key supply zone, increasing the likelihood of a bearish reaction if sellers step in again.
The current market structure suggests that if the price confirms a rejection from this resistance level, there is a high probability of a downward move. I anticipate that if rejection occurs, the market may head lower toward the 1.30950 level, which serves as a logical target within the current market structure. However, a break above this resistance would invalidate the bearish bias and could lead to further upside.
This setup reflects the potential for a retracement after an impulsive move, supported by the confluence of previous price behavior and the current structure. If you agree with this analysis or have additional insights, feel free to share your thoughts in the comments!

GBPNZD Discretionary Analysis: Bounce at 2.18Hello traders.
I'm like what I see on GBPNZD. I'm expecting the momentum to continue. I'm watching that 2.18 zone closely. It's where I'll be looking for a reaction. Could be a solid bounce spot, and if it shows signs, I'm stepping in.
Discretionary Trading: Where Experience Becomes the Edge
Discretionary trading is all about making decisions based on what you see, what you feel, and what you've learned through experience. Unlike systematic strategies that rely on fixed rules or algorithms, discretionary traders use their judgment to read the market in real time. It's a skill that can't be rushed, because it's built on screen time, pattern recognition, and the ability to stay calm under pressure.
There's no shortcut here. You need to see enough market conditions, wins, and losses to build that intuition—the kind that tells you when to pull the trigger or sit on your hands. Charts might look the same, but context changes everything, and that's something only experience can teach you.
At the end of the day, discretionary trading is an art, refined over time, sharpened through mistakes, and driven by instinct. It's not for everyone, but for those who've put in the work, it can be a powerful way to trade.

NZDCAD Discretionary Analysis: Bank Manipulation?The price just crashed into the distribution block, straight into that sellside liquidity order block like it knew exactly where it was going. Bank manipulation? It's all over this one. The institutional orderflow is running the show, and with a sharp liquidity spike followed by orders stacking up like a ticking time bomb, it's getting real... they are manipulating the price. The fair value gap is wide, and that uptrust into the distribution channel? That's the red flag that’s flashing "this is it." Everything is lined up for a big move, and I'm here for going on the lower timeframe and entering on that liquidity sweep from a NY Open manipulated candlestick.
Just kidding, I just think it's gonna go up.

AUDUSD Discretionary Analysis: Recovery Mode ActivatedIt’s that feeling when the engine’s been cold for a while, but now it’s starting to rev. AUDUSD is flashing signs it wants to push up — not in a rush, but with purpose. I’m seeing strength building, like it’s getting ready to climb. Recovery mode’s not just activated — it’s already in motion. I’m calling for upside here. If it plays out, I’ll be riding the move. If not, hey, I’ll wait for the next setup. But right now? I like the long.
Just my opinion, not financial advice.
