GOLD Technical Analysis - Correction Incoming?OANDA:XAUUSD is trading within a well-defined ascending channel, with price action now testing the upper boundary. This level could act as dynamic resistance, and a rejection here could trigger a corrective move toward the 3,035 support zone.
If buyers defend this support, the bullish structure remains intact, with a potential move back toward higher levels. However, if price breaks below this zone, a deeper pullback toward the lower boundary of the channel could come into play.
Monitoring candlestick patterns and volume at this critical zone is essential for identifying buying opportunities. Proper risk management is advised, always confirm your setups and trade with solid risk management.
If you have any thoughts on this setup or additional insights, drop them in the comments!
Support_and_resistance

GBPAUD at Major Resistance Level - Time to Sell?GBPAUD has reached a weekly resistance level, marked by prior price rejections and significant selling pressure. This area has historically acted as a key supply zone, increasing the likelihood of a bearish reaction if sellers step in again.
The current market structure suggests that if the price confirms a rejection from this weekly resistance, there is a high probability of a downward move. I anticipate that if rejection occurs, the market may head lower toward the 2.03620 level, which serves as a logical target within the current market structure. However, a break above this resistance would invalidate the bearish bias and could lead to further upside.
This setup reflects the potential for a retracement after an impulsive move, supported by the confluence of previous price behavior and the current structure. If you agree with this analysis or have additional insights, feel free to share your thoughts in the comments!

AUDUSD Discretional Analysis: It's Going Down, BroI don't know man, I have a feeling it's gonna go down. If I'm right I'll make some money and if I'm wrong I'll lose some money.
Just my opinion, not financial advice.

ALUMINIUM Discretionary Analysis: Sinking Like the TitanicI’m not entirely sure, but my gut says aluminium will sink even lower, faster than the Titanic. If not, guess it learned to float. Profit if I’m right, lesson if I’m wrong!
Just my opinion, not financial advice.

GBPAUD Trending Higher – Bullish Continuation Toward 2.07770OANDA:GBPAUD is currently trading within an ascending channel, maintaining a bullish structure. The price has broken above a key resistance zone which has now flipped to support, aligning with a potential bullish continuation. The recent retest of this level held successfully, indicating strong buyer interest and reinforcing the bullish outlook.
With momentum favoring the upside, the price could move toward the 2.07770 level, which aligns with the upper boundary of the channel. However, a failure to hold this level could indicate a potential shift in momentum.
Traders should monitor for bullish confirmation signals, such as bullish engulfing candles, strong wicks rejecting the support zone, or increased buying volume, before considering long positions.
Let me know your thoughts or any additional insights you might have! 🚀

LEAP: GBPUSD Week 14 Swing Zone/LevelsWe'll stick with the same calculations as last week and before.
Price should follow the same logic as any mathematical principle—calculable, predictable, and consistent. The key variables are the broader market factors and the strength of the trend.
With that in mind, swing zones and levels are marked on the chart, and price will ultimately decide between option A or B.

EURJPY Approaching Key Resistance — Potential Sell SetupOANDA:EURJPY is approaching a key resistance level, an area that has been a key point of interest where sellers have regained control, leading to notable reversals in the past. Given this, there is potential for a bearish reaction if price action confirms rejection, such as a bearish engulfing candle, long upper wicks or increased selling volume.
If the resistance level holds, I anticipate a downward move toward 161.20, which represents a logical target based on previous price behavior and market structure.
However, if the price breaks above this zone and sustains above it, the bearish outlook may be invalidated, opening the door for further upside.
Just my take on support and resistance zones—not financial advice. Always confirm your setups and trade with solid risk management.
Best of luck!

NZDJPY Approaching Key Resistance — Potential Sell SetupOANDA:NZDJPY is approaching a key resistance zone, a level where sellers have consistently stepped in, leading to notable bearish reversals in the past. This area is marked by strong selling pressure, increasing the likelihood of a bearish move if sellers regain control.
The current price action suggests that if the pair confirms resistance through signals like bearish engulfing candles, long upper wicks, or increased selling volume, we could see a downward move toward 86.100, which represents a logical target based on previous price behavior and market structure.
However, if the price breaks above this zone and sustains, the bearish outlook may be invalidated, opening the door for further upside.
Just my take on support and resistance zones—not financial advice. Always confirm your setups and trade with solid risk management.
Best of luck!

CADCHF - Buy Setup at Key Support LevelOANDA:CADCHF is approaching a key support zone, marked by strong buying pressure. This area has historically served as a demand zone, suggesting the potential for a bullish reversal if buyers step in.
The current market structure indicates that if the price confirms a rejection from this support zone, there is a high probability of an upward move. I anticipate that if buyers defend this level, the market may head higher toward the 0.61900 target, which represents a logical target within the current market structure. However, a break below this support would invalidate the bullish bias and could lead to further declines.
If you have any thoughts on this setup or see an alternative perspective, feel free to comment!

NZDUSD Discretional Analysis: It’s Gonna Drop, BroNo deep analysis here, just think it’ll go lower. If I’m right, I make some, if not, I lose.
Just my opinion, not financial advice.

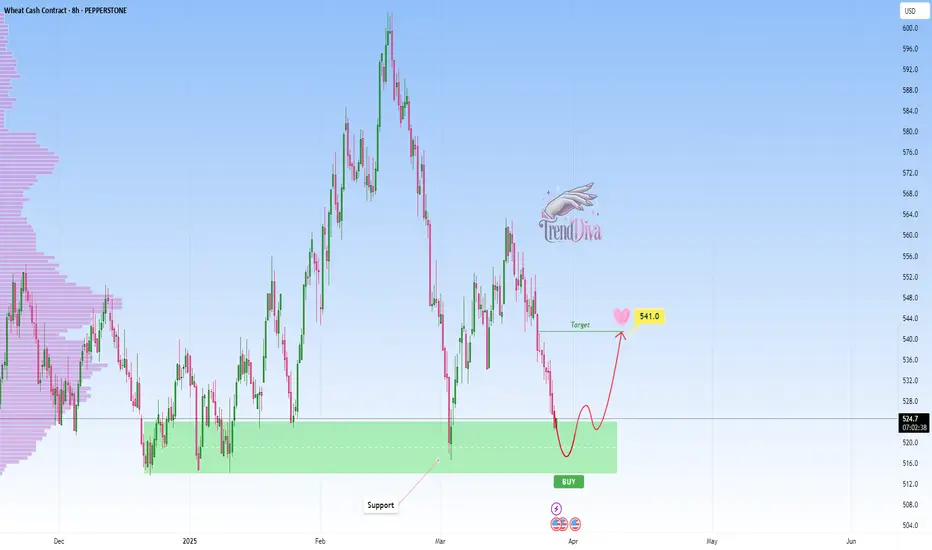
WHEAT at Key Support Level - Will Price Rebound to 541$?PEPPERSTONE:WHEAT has reached a major support level, an area where buyers have previously shown strong interest. This area has previously acted as a key demand zone, increasing the likelihood of a bounce if buyers step in.
A bullish confirmation, such as a strong rejection pattern, bullish engulfing candles, or long lower wicks, would strengthen the case for a move higher. If buyers step in, the price could rally toward the 541$ target. However, a decisive breakdown below this support would invalidate the bullish scenario and could lead to further downside.
This is not financial advice but rather how I approach support/resistance zones. Remember, always wait for confirmation, like a rejection candle or volume spike before jumping in.
Best of luck , TrendDiva
WTI CRUDE OIL – Bullish Continuation Ahead?TVC:USOIL is currently trading within an ascending channel, with price recently bouncing off the trendline support after a corrective move. This rebound suggests that buyers are stepping in, maintaining the bullish structure within the channel.
If the bullish momentum continues, we could see a move toward 70.10, which aligns with a key resistance level within the channel. This level could serve as a potential short-term target before a possible reaction from sellers. A clean breakout above the resistance zone could open the door for further upside. However, a failure to sustain this upward push could lead to another retest of the lower boundary.
Traders should watch for bullish confirmation signals such as higher lows, strong bullish candles, or increasing volume before considering long positions.
If you agree with this outlook or have any additional insights, feel free to share your thoughts!

GOLD Bullish Continuation - Will Buyers Push Toward 3,084$?OANDA:XAUUSD is currently trading within an ascending channel, maintaining a bullish structure. The price has broken above a key resistance zone which has now flipped to support, aligning with a potential bullish continuation.
With momentum favoring the upside, the price could move toward the 3,084$ level, which aligns with the midline of the channel. However, a failure to hold this level could indicate a potential shift in momentum.
Traders should monitor for bullish confirmation signals, such as bullish engulfing candles, strong wicks rejecting the support zone, or increased buying volume, before considering long positions.
Let me know your thoughts or any additional insights you might have! 🚀

EURJPY Discretional Analysis: It's Gonna Go UpHonestly, I can’t fully explain it, but my intuition says it’s gonna go up. If I’m right, I’ll make a profit, and if not, I’ll take the loss and move on to the next trade.
Just my opinion, not financial advice.

CADCHF Discretionary Analysis: We're heading north!I don’t know how to explain it, but everything in me says, “this is going up!” 🚀 If I’m right—sweet profits! 💰 If not, I’ll take the loss like a champ and move on.
Just my opinion, not financial advice.

JPY/USD - Will we make a strong bounce?The JPY/USD is in a downward channel. Will it find support around 0.006 and rebound, or will it break below this key level?
The pair has nearly reached a major support zone—an area where buyers have previously shown strong interest. This level has historically acted as both strong resistance and support, increasing the likelihood of a bounce if buyers step in.
What do we want to see?
For a continuation to the upside, we need this level to hold as support. A bullish engulfing candle could signal a potential reversal.
If JPY/USD is to move lower, we need a clear break below support with high volume to confirm the breakout. In that case, lower prices could follow.
Thanks for your support.
- Make sure to follow me so you don't miss out on the next analysis!
- Drop a like and leave a comment!

CADJPY Retesting Key Level: Will Sellers Step In?OANDA:CADJPY is approaching a key level that previously acted as support. Now that price is retesting it, there’s a good chance it could turn into resistance. If sellers step in, we could see a bearish reaction.
If the price shows clear signs of rejection from this zone, I anticipate a move downward toward the 104.500 level, which serves as a logical target for this setup. Conversely, a clean breakout above the zone could signal a potential bullish continuation.
Traders should monitor for bearish confirmation signals, such as bearish engulfing candles, long upper wicks rejecting the resistance, or increased selling volume before considering short positions. Let me know your thoughts or any additional insights you might have

USDJPY Trending Lower - Will It Drop To 145.200?OANDA:USDJPY is currently trading within a descending channel, indicating a strong bearish structure. The price has broken below a key support zone and may now pull back for a potential retest. This level previously acted as support and could now serve as resistance, aligning with a possible bearish continuation.
If sellers confirm resistance at this zone, the price is likely to move downward toward the 145.200 target. However, a failure to reject this level could indicate a potential shift in momentum.
Traders should monitor for bearish confirmation signals, such as bearish engulfing candles, strong wicks rejecting the resistance zone, or increased selling volume, before considering short positions.
Let me know your thoughts or any additional insights you might have!

CADCHF Approaching Key Support – Rebound Toward 0.61890?OANDA:CADCHF is approaching a key support zone, marked by strong buying pressure. This area has historically served as a demand zone, suggesting the potential for a bullish reversal if buyers step in.
The current market structure indicates that if the price confirms a rejection from this support zone, there is a high probability of an upward move. I anticipate that if buyers defend this level, the market may head higher toward the 0.61890 target, which represents a logical target within the current market structure. However, a break below this support would invalidate the bullish bias and could lead to further declines.
If you have any thoughts on this setup or see an alternative perspective, feel free to comment!

EURCAD Approaching Major Resistance - Correction Incoming?OANDA:EURCAD is approaching a significant resistance zone, marked by prior price rejections and strong selling pressure. This area has historically acted as a key supply zone, indicating the potential for a pullback if sellers step in and regain control.
If the price rejects this resistance, we could see a pullback toward 1.55000, aligning with a corrective move after the recent bullish rally. However, a clean breakout above this resistance zone would invalidate the bearish bias and could lead to further upside toward higher levels.
Traders should monitor for bearish confirmation signals, such as rejection wicks, bearish engulfing candles, or increasing selling volume, before considering short positions.
If you agree with this analysis or have additional insights, feel free to share your thoughts in the comments! 📉

GOOGLE at Key Support Level – Rebound Towards $190?NASDAQ:GOOGL is experiencing a corrective move after rejecting from the upper boundary of the ascending channel. This rejection has triggered increased selling pressure, driving the price back toward the channel's lower boundary. The confluence of trendline support and the overall bullish market structure enhances the likelihood of a rebound from this level.
If buyers defend this level, we could see a push toward $190, which aligns with the midline of the channel and could serve as a short-term target. A successful bounce from here would reinforce the ongoing bullish momentum within the channel.
However, if price fails to hold above this support zone, the bullish outlook could weaken, potentially signaling further downside. Traders should watch for bullish confirmation signals, such as strong rejection wicks, increased volume, or bullish engulfing patterns, before entering long positions.
If you agree with this analysis or have additional insights, feel free to share your thoughts! 🚀

QQQ at Key Support Level – Rebound Towards $532?NASDAQ:QQQ is experiencing a corrective move after forming a double top near the upper boundary of the ascending channel. The rejection from this level has led to increased selling pressure, bringing price back to the lower boundary of the channel.
If buyers regain control at this point, we could see a rebound toward the $532 resistance zone, which aligns with previous price reactions and the midline of the channel. This area could act as a short-term target within the existing bullish structure.
However, if price fails to hold this support and breaks below with momentum, the bullish outlook may be invalidated, potentially signaling further downside. Traders should watch for bullish confirmation signals such as rejection wicks, increasing volume, or bullish engulfing patterns before considering long positions.
If you agree with this analysis or have additional insights, let’s discuss! 🚀

SPAIN 35 Trending Higher – Will It Reach 13,912?OANDA:ESPIXEUR has broken above the key resistance level within the ascending channel, signaling potential bullish continuation. This breakout suggests that buyers are in control, and price could now look to retest the previous resistance as support before continuing toward the upper boundary of the channel.
If price confirms support at this level, we could see a push toward the 13,912 target, aligning with the upper boundary of the channel. This move would reinforce the ongoing bullish structure and offer a buy opportunity for traders looking to capitalize on the momentum toward the upper boundary.
However, if the price fails to hold above the previous resistance and falls back into the range, it could indicate a false breakout, potentially leading to a deeper retracement toward the trendline support. Traders should look for bullish confirmation signals, such as a successful retest with strong buying pressure or bullish candlestick patterns, before entering long positions.
Do you agree with this setup, or do you see any alternative scenarios? Let’s discuss! 🚀
