Z eyes on $68.80-69.75: Resistance even the Fib-Blind can SEEZillow has bounced into a major landmark of its lifetime.
Zone is defined by a Golden Covid and a Minor Genesis fib.
This has been tested from both sides many times already.
$ 68.60-69.75 is the exact resistance to watch.
$ 61.82-62.50 is the first support below to hold.
$ 76.18-7./00 is a good first Target for longs.
===================================================
.
Support and Resistance

TRV eyes on $265.51: Golden Fib break should run to new ATHTRV has been struggling with a Golden Covid fib at $265.51.
This is a MAJOR landmark. proven by the many rejections.
This break may be the ONE, the one to hit All Time Highs.

CSCO eyes on $59.22: Key resistance to Tariff Recovery waveThis "internet oldie" usually lags the newcomers.
The key will be to break the Covid fib at $59.22
If we get a dip then look to the sister fib at $57.81

Now That Gold Ended Bearish Weekly, What Next?After the indecision in the upper week, XAUUSD resumed its sell‑off this the trading week and closed below the prior week’s low, locking in a bearish weekly close. With momentum skewed to the downside, a mean‑reversion likely to occur over the next few weeks.
N.B!
- XAUUSD price might not follow the drawn lines . Actual price movements may likely differ from the forecast.
- Let emotions and sentiments work for you
- ALWAYS Use Proper Risk Management In Your Trades
#gold
#xauusd

Bitcoin Analysis (4H)Bitcoin has lost its trendline and appears to have accumulated significant sell orders near the top.
The zone between $96K and $100K could act as the main supply area, potentially pushing the price down to at least $88K.
Targets are clearly marked on the chart.
A daily candle closing above the invalidation level would invalidate this outlook.
Do not enter the position without capital management and stop setting
Comment if you have any questions
thank you

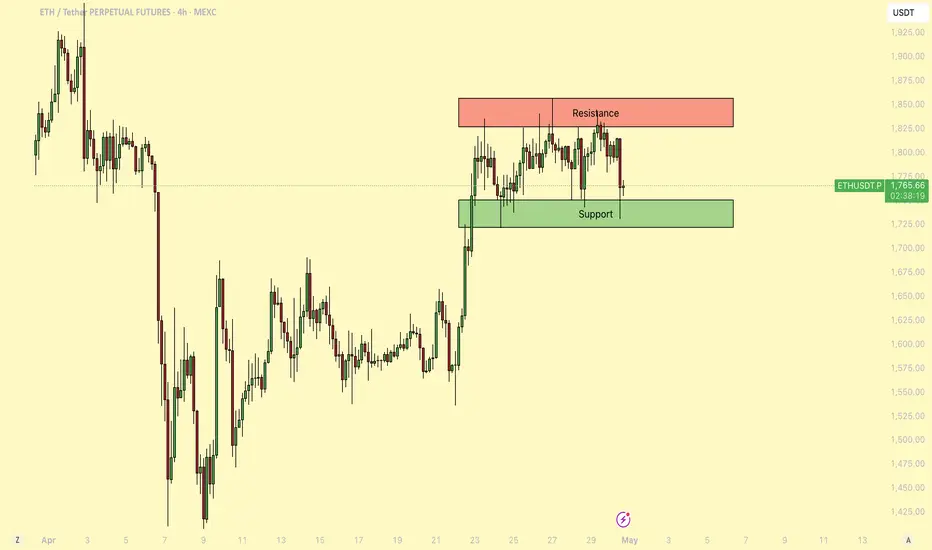
ETHEREUM New Update (1D)Price has approached a supply (flip) zone. It is not expected to break this zone on the first attempt, and bears are likely to regain control for now.
If Ethereum returns once again to the lower zones marked on the chart, it could present a low-risk opportunity for buy/long positions.
The main target can be the upper supply zone.
A daily candle closing below the invalidation level would invalidate this analysis.
Do not enter the position without capital management and stop setting
Comment if you have any questions
thank you

Gold can correct to support level and then continue to move upHello traders, I want share with you my opinion about Gold. After studying this chart, we can track the progression of Gold's price action from strong bullish momentum to its current consolidation. Initially, the market trended confidently inside an upward channel, with steady growth supported by the lower boundary of the channel and occasional corrections after touching the resistance line. Each pullback respected previous support zones, a strong signal of buyer control at the time. The most impulsive move came after the price exited the buyer zone, followed by a clean breakout above the resistance line of the channel. However, once the price entered the seller zone, we saw the momentum start to fade. A strong rejection occurred near the resistance level at 3370, which eventually triggered a series of lower highs and shifted the market into a more neutral, range-bound phase. Currently, Gold is trading inside a defined range between 3205 and 3370. The bottom of this range aligns perfectly with the buyer zone, which already acted as a strong support during the last decline. We can also observe the market beginning to show signs of reversal after tapping the zone again. Given the reaction from the support area and the structure of the range, I expect the price can bounce back and make another attempt to reach the 3370 resistance level, which is my TP1 for this scenario. Please share this idea with your friends and click Boost 🚀

EPIC New Update (8H)EPIC appears ready for a rejection to the downside and a drop.
Maintaining the supply zone, it could drop further.
The marked demand zone could potentially reject the price back upward again.
Do not enter the position without capital management and stop setting
Comment if you have any questions
thank you

BTC - retracement levelsHello chart people 👋
BTC 1D timframe
Key level I'm watching 👀 atm is 94,960. If we break below this level you can see in the chart where price might head to next.
Both RSI and candle uptrend have started to break down signalling negative momentum. This week could be bearish.
A move to the 618 would fill a fair-value-gap. I expect that price will react from the 88,300 - 89,300 range. Wouldn't be surprised if we saw a touch on the daily high Mon 21st Apr @ 88,340 on the button. This move is worth -6.5% from current position 📉
There is a small liquidity Zone sat right above us @ 97,100 so the cruel whales 🐋 might destroy the short people before moving down.
Re: fib levels - I've pinpointed the weekly open 21st Apr as the "swing low" and the 618 and 786 levels seem to magnetise to key levels.

GBPNZD can go longWe can expect a reversal in GBPNZD on Monday. As it has completed AB=CD harmonic Pattern, which may cause a reversal.

15-minute gold time frame analysis
To start the market structure, the 15-minute market is currently bearish, but to start an upward movement, it can be expected to reach the order block 3259-3263 and then continue towards the support area 3220-3210 and from this area it will rise towards the liquidity of the dynamic line of the 1 and 4-hour time frames. If the initial market rise closes above 3264, any lower market pullback is considered an upward trend.

Retest at 92k?Bitcoin broke above resistance at 95k but the CME gap at 92k remains unfilled which is unlikely to stay that way. Makes a long entry at 92k very attractive as resistance is already broken but no financial advice: Price could also retest 89k or go even lower.

Strategy $MSTR hits resistance, what will it do?
NASDAQ:MSTR has rebounded from the bottom fairly fast compared to other stocks and indexes. It's even performed better than Bitcoin itself. It is up about 65% from the low we set a few months ago. However it should be hitting heavy resistance now near 395-400 and above is only heavier resistance. It's time for a pullback and a breather for MSTR. Target is the Point of Control near $350, before going higher. However we could turn bullish again before reaching $350.
I personally know someone who played with fire by buying NASDAQ:MSTR options calls while it was dropping before, meaning he was trying to catch a falling knife and got burnt finally. He lost nearly $500,000 because of it. So I don't mess with options personally, however I will margin trade with stocks and trade futures, forex and leverage trade cryptocurrencies.

MSTR (Strategy) coming up to $395, the smaller resistance levelNASDAQ:MSTR has rebounded from the bottom fairly fast compared to other stocks and indexes. It's even performed better than Bitcoin itself. However it should be hitting heavy resistance now near 395-400 and above is only heavier resistance. It's time for a pullback and a breather for MSTR. Target is the Point of Control near $350, before going higher. However we could turn bullish again before reaching $350
I personally know someone who played with fire by buying MSTR options calls while it was dropping before, meaning he was trying to catch a falling knife and got burnt finally. He lost nearly $500,000 because of it. So I don't mess with options personally, however I will margin trade with stocks and trade futures, forex and leverage trade cryptocurrencies.

Bullish potential detected for WOWEntry conditions:
(i) higher share price for ASX:WOW along with swing up of indicators such as DMI/RSI, and
(ii) observation of market reaction at the resistance level / volume profile area at $32.32 after closing above 200 day MA.
Stop loss for the trade would be, dependent on risk tolerance:
(i) a close below the 200 day moving average (currently $31.63), or
(ii) a close below the 50 day moving average (currently $30.17).

Bearish potential detected for PDNEntry conditions:
(i) lower share price for ASX:PDN along with swing of DMI indicator towards bearishness and RSI downwards, and
(ii) close below the 50 day moving average (currently $5.91), and
(iii) observing market reaction around the share price of $5.72 (open of 28th March).
Stop loss for the trade would be:
(i) above the high of the recent swing high once the trade is activated (currently $6.35 from the high of 2nd May).

The smell of Altseason...The weekly RSI for ETHBTC is the lowest it has ever been. I expect one last liquidity grab at 0.01615 before the tide turns. No financial advice.

ETH - Consolidating before a major breakout!About a week ago, Ethereum (ETH) saw a strong upward move, pushing the price up with notable momentum. Since then, it has entered a period of consolidation, trading within a tight range as the market awaits the next decisive move.
-------------------------------
Which Direction Will ETH Break?
After such a strong rally, this kind of consolidation is normal. It could signal a continuation to the upside, especially if this is part of a broader relief rally. However, it's important to note that during the rapid move up, ETH left behind a 4h Fair Value Gap (FVG), which may attract price back down for a potential fill in the event of a breakdown.
-------------------------------
Stochastic RSI insight
On the daily chart, the Stochastic RSI remains in the overbought zone. Historically, when this indicator lingers in such territory, ETH has seen notable pullbacks. This could be an early sign that a downward move is more likely unless momentum changes soon.
-------------------------------
ETH vs. the 50-Day Moving Average
ETH is currently struggling with the 50-day Moving Average (MA), trading just below this key resistance level. As long as ETH remains under the 50-day MA, bearish pressure could continue. However, a reclaim and sustained hold above this level would likely indicate a shift toward bullish momentum.
-------------------------------
My Outlook
This range is tricky to trade, and a breakout in either direction is possible. Personally, I think there's a chance ETH could sweep the recent highs before a larger move down. The overbought Stochastic RSI and resistance at the 50-day MA both suggest that the rally might be losing steam in the short term.
-------------------------------
Thanks for your support.
- Make sure to follow me so you don't miss out on the next analysis!
- Drop a like and leave a comment!
USDJPY Long PositionUSDJPY pair is currently positioned at a key support zone, where price action has historically reversed direction. Following a recent rebound from this level, the pair retested the support area. Given the broader uptrend structure (characterized by higher highs and higher lows), this retest presents a potential opportunity to enter long positions, contingent on bullish confirmation at this critical juncture.
Key Observations:
Established Uptrend: The pair’s consistent upward trajectory on higher time frames supports a bullish bias.
Support Retest: The current pullback to the support zone aligns with typical price behavior in trending markets, where retests of prior levels often precede trend resumptions, but a decisive close below the support would invalidate the bullish setup, potentially signaling a trend reversal or deeper correction.
Risk Management Strategy: A prudent approach would involve placing a stop-loss below the support zone to protect against a breakdown, while targeting the next resistance level for profit-taking.
Final Assessment:
The setup aligns with bullish momentum, provided the support holds.

AUD/USD Key Rejection Zone Identified – Bearish Momentum in PlayPrice recently tested a significant resistance level (R.L) and showed rejection after forming a lower structure (L.S). The bearish pressure is visible as price fails to break above 0.64640 and starts consolidating below the resistance. A clean break below the marked lower support zone (around 0.64116) could signal further downside potential toward the 0.63707 area.
📍 Resistance Holding
📍 Lower High Formed
📍 Eyes on Key Support Break
Chart timeframe: 30 min
Instrument: AUD/USD

GBPJPY Signal : 1H / 4H Beautiful buy !!!Hello Traders! 👋
What are your thoughts on GBPJPY ?
GBPJPY
Market price : 192.40
Buy Limit: 191.20 - 191.00
Tp1 : 192.10
Tp2 : 193.10
Tp3 : 194.50
Tp4 : 195.90
Sl : 190.10 ( 100 pip )
Don’t forget to like and share your thoughts in the comments! ❤️
Remember this is a position that was found by me and it is a personal idea not a financial advice, you are responsible for your loss and gain.

GOLD ( XAUUSD ) : H4 / D1 : Big Long !!!Hello Traders! 👋
What are your thoughts on Gold?
After a strong upward move, gold entered a corrective phase upon reaching the $3500 resistance zone.
This correction could offer a buy-the-dip opportunity, with potential for a move back toward the recent highs.
XAUUSD
Market price : 3240
Buy limit : 3140 - 3120
Tp1 : 3240
Tp2 : 3340
Tp3 : 3500
Tp4 : 3750
Sl : 3030 ( 100 pip )
Don’t forget to like and share your thoughts in the comments! ❤️

MAGIC Rebuy Setup (4H)This analysis is an update of the analysis you see in the "Related publications" section
The price didn’t reach our red zone for entering a Sell/Short position, but the trend reversal outlook on MAGIC was correct.
We are now looking for a potential Buy/Long position near the support zone.
We will only enter a Buy/Long position if the price touches the green zone.
Targets are marked on the chart.
A daily candle close below the invalidation level will invalidate this analysis.
For risk management, please don't forget stop loss and capital management
When we reach the first target, save some profit and then change the stop to entry
Comment if you have any questions
Thank You
