BANKNIFTYBanknifty levels are based on imbalances
1. gapup 55500 long
2. 55500-55100 trade breakout
3. gapdown 55100 short
Support and Resistance

NIFTYNifty levels are based on imbalances
1. gapup 24500 long
2. 24500-24300 trade breakout
3. gapdown 24300 short

NVDA watch $113.56: Golden Genesis fib and Most Important level NVDA has come back to its "Golden Genesis" fib.
We had a high apogee orbit and have returned.
What happens here will determine the trend.
It is PROBABLE that we orbit this a few times.
It is POSSIBLE that we reject to the fib below.
It is PLAUSIBLE that we break to next fib above.
==========================================

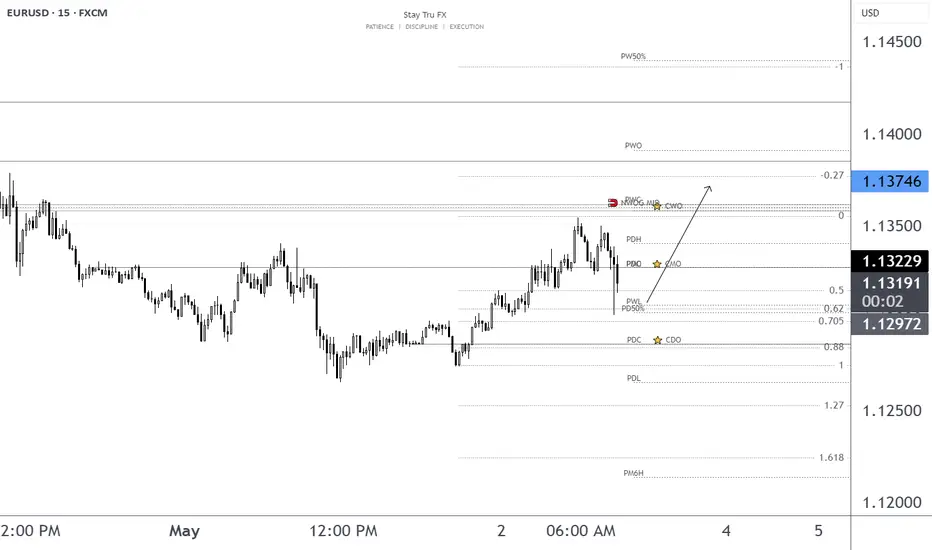
2 May+1 SD levels and ElastiVolTTension +2
Asia and LND H taken out
RTH+ Above
Looking for entry short on LTF

THE KOG REPORT - NFPTHE KOG REPORT – NFP
This is our view for NFP, please do your own research and analysis to make an informed decision on the markets. It is not recommended you try to trade the event if you have less than 6 months trading experience and have a trusted risk strategy in place. The markets are extremely volatile, and these events can cause aggressive swings in price.
We’ve done well this week on gold, capturing the high into the low and then taking the long late session which has nearly completed our higher target for a decent week on this precious metal. As we’ve said, best practice is to let this play out, let them take it to where they want, once it settles, then look for the trade.
We have support now at the 320-35 level which is a key level that will need to break in order to reverse and go lower. This level also lines up with our Excalibur levels and red boxes so we can say it’s pretty strong. Above, we have the 3270-75 region which is the previous order level, our volume indicator is suggesting a pull back, so rejection there can take us back into support to settle for the NFP release. It’s this level, if held which can push this upside and our thoughts are at the moment, are they going to take this back into the previous range and hold it there into the close.
So as long as 3240 holds us, we’re likely to see higher pricing for now, 3310-20 is the key level above which needs to break to then give us the flip and potential for a new all time high.
For now, let’s sit back and see what happens.
RED BOXES:
Break above 3262 for 3265, 3270, 3275 and 3288 in extension of the move
Break below 3252 for 3240, 3236, 3230 and 3220 in extension of the move
Please do support us by hitting the like button, leaving a comment, and giving us a follow. We’ve been doing this for a long time now providing traders with in-depth free analysis on Gold, so your likes and comments are very much appreciated.
As always, trade safe.
KOG

NFP market, looking for opportunities to short goldFundamentals:
Mainly focus on today's NFP market;
Technical aspects:
Gold rebounded near 3200 and has gradually rebounded to around 3265. This wave of rebound is not surprising. After all, I have been insisting on short-term long gold since yesterday, and I have also gained a good profit. As gold falls and breaks through many key supports, my expectations for the magnitude of this rebound are not high. In the short term, it will first face resistance in the 3270-3275 area, and secondly, it will face resistance in the 3285-3295 area.
Moreover, the rebound and rise of gold before the NFP market is very confusing in itself. It is not ruled out that it is to pave the way for the sharp drop in the NFP market. Once gold falls again, it is likely to fall below 3200 and continue to around 3180.
Trading strategy:
1. Consider shorting gold when it rebounds to 3270-3280, TP: 3240-3230;
2. Consider continuing to short gold when it rebounds to 3280-3290, TP is the same as above.

BA watch $186 above 173 below: Golden Genesis fib may give DipBA flying back up from the tariff bottom.
Approaching a Golden Genesis fib at $186.76
We should see a dip soon, possibly to $173.40

Non-agricultural prospective data analysis Operation suggestions📌Fundamentals:
📊Technical aspects:
Technically, spot gold is in a downward trend in the short term, and there is a certain rebound or shock at the key support level. At the 4-hour level, the gold price is running above the lower track of the Bollinger Band, and the opening shows signs of contraction. The MACD indicator dead cross is gradually closing, and the RSI indicator is running in the 35-45 range, showing that the long and short forces are relatively balanced.
🎯Practical strategy:
3260-3270 light position short, target 3225-3200. When it reaches 3225-3200 and stabilizes, try to go long, target 3250-3270.

ASML watch $675: Key Resistance that may Reject or Mark BottomASML trying to recover slowly with the chip sector.
Currently test a key resistance zone $ 673.43-677.93
Looking for a Break-and-Retest to consider long entries.

USDJPY: Bullish Trend Reversal?! 🇺🇸🇯🇵
USDJPY formed a strong bullish reversal pattern on a daily,
breaking the underlined daily resistance and confirming
a Change of Character CHoCH.
I believe that the pair will steadily return to a global bullish trend.
The price may grow at least to 147.0 level after a completion of a retracement.
❤️Please, support my work with like, thank you!❤️

CIEN watch $72 then 76: Serious Resistance zones that cause dip CIEN coming back ferociously from the tariff bottom.
About to break second Major Resistance, one more to go.
Very likely to see a dip from one of these major zones.
$71.88-72.53 is the immediate resistance breaking
$75.93-76.30 is the next resistance to try shorting.
$68.77-69.37 is the first support in case of a dip.
=================================================
.

MS eyes on $119: Major Resistance may End Bounce or Strong BullMS recovering well from the tariff tantrum.
About to test a major resistance $119.08-119.20
Break would show strong bull, but dip more likely.
===========================================
.


NQ KEY ICT LEVELS - 2nd MAY 2025Levels marked on the chart using my free indicator which marks out all of the ICT key levels which can be used for potential POIs where price might react

NQ KEY LEVELS - 2nd MAY 2025Key levels marked by using low volume nodes for potential key levels where we may see price react.

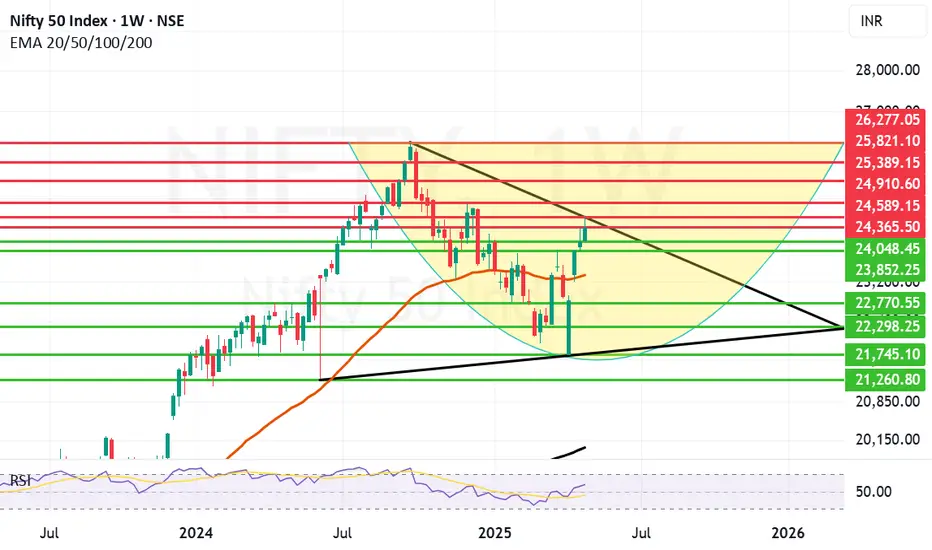
Nifty eyeing Trendline breakout amidst uncertainty. Amidst uncertainty on Geo-Political front Nifty gave up 242 points it had gained earlier in the day. Also it bounced 108 points from the day's low to close 12 points in positive at 24346.7 in a highly volatile Friday.
Reliance remains start of the week after posting stellar results earlier in the week. The Trendline resistance zone between 24365 and 24589 remains difficult to conquer for Nifty. Once we get a closing above 24589 can the bulls try to pull Nifty further up towards 24910 and 25K+ levels.
Incase the trend line resistance is not crossed successfully the support for Nifty remains at 24048, 23852 and 23343. As of now it looks that the level of 23343 which is the Mother line of Weekly candle chart (strong Support) can be breached only if there is flare up of incidents on the Border or elsewhere.
The situation at Indo-Pak Border remains delicate and tense that might be one reason why investors did not carry long positions into the weekend and Nifty lost most of it's gains.
Right now a lot depends on what happens between the 2 nations and surrounding region. Investment in large cap companies remains the safest option looking at the uncertainty. Even in the case of flare-up at the border these companies will be the first to bounce back after situation normalises.
Disclaimer: The above information is provided for educational purpose, analysis and paper trading only. Please don't treat this as a buy or sell recommendation for the stock or index. The Techno-Funda analysis is based on data that is more than 3 months old. Supports and Resistances are determined by historic past peaks and Valley in the chart. Many other indicators and patterns like EMA, RSI, MACD, Volumes, Fibonacci, parallel channel etc. use historic data which is 3 months or older cyclical points. There is no guarantee they will work in future as markets are highly volatile and swings in prices are also due to macro and micro factors based on actions taken by the company as well as region and global events. Equity investment is subject to risks. I or my clients or family members might have positions in the stocks that we mention in our educational posts. We will not be responsible for any Profit or loss that may occur due to any financial decision taken based on any data provided in this message. Do consult your investment advisor before taking any financial decisions. Stop losses should be an important part of any investment in equity.
GBP/JPY LONG GBP/JPY LONG " break of a resistance area and retest it + 61.8% fib retracement + 50 ema dynamic support "

Mantra's -90% Liquidation event: Why Market-Wide Danger LoomsLast night (April 13th) the Mantra (OM) project saw its market capital drop from $6.11B to $419m!
============================================
From the team
============================================
JP Mullin (CEO of @MANTRA_Chain) remarks at BTCON RWA Summit today on CRYPTOCAP:OM price action overnight
• No exploit or hack
• No active selling from MM or investors
• Large investors using CRYPTOCAP:OM as collateral were liquidated, which caused drastic price action
• No profit taken from insiders including team members”
After the 95% correction they said:
“We want to assure you that MANTRA is fundamentally strong.”
Would you say that if Apple dropped 95% overnight?
============================================
The Official reason – A liquidation event
============================================
“There was a massive, forced liquidation from a large OM investor on a CEX. Still working on the details, but we are here, and we're fixing this.”
============================================
Could Technical analysis have foreseen this?
============================================
The correction depth? No, targets like this cannot be forecast. However, the loss of support and market structure was evident on March 26th. Price action was up 450x at this point, greed is the only reason profits were not taken.
If indeed investor confidence has not be destroyed from such an event, look for support around 30 cents. There is no recovery from an event like this until a significant consolidation period.
============================================
Why is this a danger to the whole market?
============================================
Have never be shy on the fact the entire crypto space is a Ponzi scheme. A promise you can make wealth from speculation. The outsized use of leverage compared to spot makes that evident. The number of messages Without Worries continues to receive from folks who have lost meaningful sums of money using Leverage and Futures products has been constant over the past several years. It is frustrating as it is heartbreaking.
If a liquidation event can cause a spot market to drop 95% then the question is, can this happen elsewhere?
369.78K - That was the trading volume for Bitcoin across the entire market these past 24hrs.
528.185K - The current amount of Bitcoin held by Micro Strategy on Leverage.
Average Cost per BTC: $67,458.00 or just $17k below current market prices.
strategytracker.com
"Michael Saylor's company was on a Bitcoin buying spree. Soon it might need to sell"
qz.com
If debtors demand repayment of their loans to Micro strategy, loans that used his Bitcoin as collateral (the irony), forced Bitcoin liquidation has to occur. This fund could wipe out the 24hr trading volume with ease. What do you think such an event would do the whole market?
The recent events on Mantra serves as an excellent example of why the spot market is no longer in control of price discovery. This is a fully fuelled leveraged bubble approaching margin call.
Stay safe, stay wise, and stay away from leverage!
Ww

DeGRAM | SOLUSD Held the $145 level📊 Technical Analysis
● SOL broke above the long-term descending resistance near $130 and held it on a retest, confirming a bullish reversal.
● A consolidative range between $145 support and $154 supply has formed; a decisive break above $154 targets the rising-channel top near $160.
💡 Fundamental Analysis
● SOL staking volume recently surpassed Ethereum’s, underlining robust on-chain yield demand.
● DeFi Development Corp filed to offer $1 billion in securities to boost SOL holdings, signaling institutional accumulation.
✨ Summary
Resistance-turned-support at $145, strong staking growth, and corporate demand support a short-term long bias: targets $154 → $160; invalidation below $140.
-------------------
Share your opinion in the comments and support the idea with a like. Thanks for your support!

Altcoin season closer than ever?It's done. BTC.D finally grabbed liquidity at 65%. Now the majority of liquidity is below.

SHORT ON EUR/JPYEUR/JPY has created a head and shoulders pattern at a major resistance area.
I will be selling EJ to the pervious swing low / demand level.

ETH 2000$📈 CRYPTOCAP:ETH Analysis – May 2, 2025
Ethereum is forming a bullish ascending triangle and reacting to the key resistance at 1812, possibly preparing for a breakout.
🔹 Resistances:
1812 USDT 🔼
1910 USDT 🎯
2000 USDT 🎯
🔹 Supports:
1728 USDT 🛡️
1680 USDT ⚠️
1484 USDT ⚠️
