Trendzilla vs Chop Kong (EUR/JPY)The bias for EUR/JPY - in our view - is higher
On the weekly timeframe:
A) WMA has flattened out and price held above it B) downtrend line broken and held
On daily timeframe:
EUR/JPY just broke resistance for possible breakout trade up to the olf high to 166 - and possibly beyond
Thoughts ?
Support and Resistance

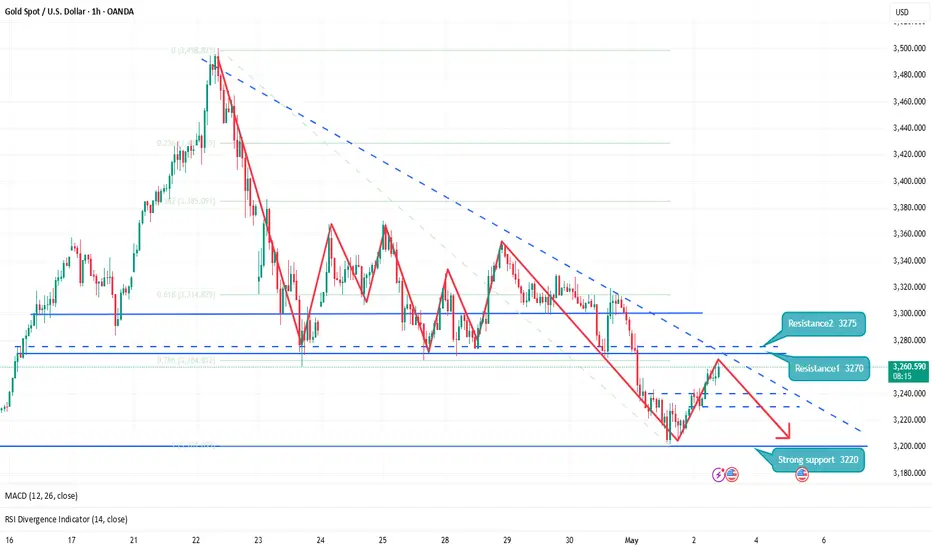
Maintain shock and short position before non-agricultural📌Fundamentals:
From the news perspective: the United States released a trade agreement and tariff reduction signal, the trade situation eased, resulting in a decline in market demand for safe-haven assets, triggering a sell-off in gold; the situation between Russia and Ukraine has eased, and the dawn of peace talks is approaching, which is a negative factor for gold; at the same time, the situation between India and Pakistan has heated up, which has supported the price of gold to a certain extent.
📊Technical aspects:
In the past few days, we have been emphasizing that gold should be bearish, and warned that gold is likely to break and fall sharply.
Gold, the general trend is as described in the continuous analysis. This round of price has fallen from the historical high of 3500. The first round of selling to 3260 rebounded to repair 3370; after rebounding to 3358 during the week, it weakened again, and the Asian market quickly sold off and fell below 3260. The subsequent analysis emphasized that the short-selling pattern of each cycle is good, and the shock bearish trend continued before the non-agricultural, and the target was adjusted to the parallel attack and defense range of 3193-3168;
European and American markets fluctuated and were bearish, which is in line with expectations; short-term resistance 3221, 3226, strong resistance 3231-3235; short-term support 3212, strong support 3202;
🎯Practical strategy:
It is recommended to rebound and sell: short near 3220-3230, target 10-15 points

How to layout gold before non-agricultural data🗞News side:
1. Progress in Sino-US tariff negotiations: The United States has recently contacted China through multiple channels, releasing signals that a trade agreement may be reached. Market concerns about trade friction have significantly cooled down, weakening the safe-haven appeal of gold.
2. The U.S. non-farm payrolls report for April will be released today (expected to add 130,000 new jobs). If the data is weak, it may strengthen expectations for an interest rate cut. On the contrary, if it is stronger than expected, the interest rate cut schedule may be further delayed.
📈Technical aspects:
Gold bottomed out yesterday and has now rebounded to around 3250. For the current market situation, the previous low of 3260-3270 has become an important resistance level above the gold price after the top-to-bottom conversion. In addition, non-agricultural data will be released in the U.S. market today. Therefore, if gold wants to reverse upward, the first resistance will be in the 3260-3270 range. If the counter pull from the bottom fails to stabilize at 3270, then there will be a downward trend. If it breaks through this resistance range, it may test the 3286 line. Before the release of non-agricultural data, the European market can be shorted when encountering resistance at 3260-3270. Everyone is waiting patiently for the opportunity to enter. The following focuses on the important support of 3200.
If you agree with this point of view, or you have a better idea, please leave a message in the comment area. I look forward to hearing different voices.
GBPJPY SIGNAL UPDATE READ THE CAPTAIN(gbpjpy signal technical analysis satup 👇🏼
( GBPJPY) SEEL zone
( TRADE SATUP)
ENTRY POINT (193.400) to (193.300) 📊
FIRST TP (193.000)📊
2ND TARGET (192.400) 📊
LAST TARGET (191.900) 📊
STOP LOOS (193.950)❌
FALLOW RISK MANAGEMENT ✅

WTI: Break It or Bounce ItIf other cyclical asset classes are rallying like a global recession can be avoided, then why shouldn’t crude oil? Yes, there are reports OPEC+ may increase output again, and we know Donald Trump wants lower prices, but those factors should already be priced in. The true swing factor is demand—and if it’s not about to fall in a heap, why should crude?
We’ve now seen three violent rallies from beneath $57.30, including when the level was established in early 2021. If price were to return to those levels in the near-term, it could offer a decent swing trade. Longs could be established above with a stop beneath for protection, targeting a run back to $60.45, a minor level that acted as both support and resistance in April. If that were to give way, a move towards key resistance at $65.27 could follow.
Another option would be to wait for a sustained push above $60.45, allowing longs to be established on the break with a stop beneath, targeting $65.27. Of the two setups, this one screens as higher risk given how lightly $60.45 has been tested.
Momentum remains with the bears, which normally favours selling rips over buying dips. But in these headline-driven markets, that signal may not carry its usual weight. For what it’s worth, downside momentum is easing for now.
A close beneath $57.30 would invalidate the countertrend bullish setup.
Good luck!
DS

KASPA Structure Analysis – Downtrend BreakoutAfter retesting the $0.05 demand zone (previous resistance dating back to August 2023), BITGET:KASUSDT reclaimed the 50-day EMA (yellow) and tested the 200-day EMA (orange), before a brief pullback with the 50-day EMA acting as support.
Key Levels
• $0.050-$0.060: Main demand zone
• $0.083: Current support, reinforced by 50-day EMA
• $0.105: Current resistance, reinforced by 200-day EMA
• ~$0.120: HVN and potential resistance
• $0.155-$0.160: HVN, previous S/R and potential resistance
• $0.180-$0.200: Main supply zone
Here's a weekly chart with volume profiles for more context:
Considerations
• The breakout from the recent downtrend, and the break above the 50-day EMA followed by a retest as support, is a good sign for the bulls.
• If the 200-day EMA is successfully reclaimed, it could offer a good shot at retesting the main supply zone in the $0.180-$0.200 area.
• Conversely, a sustained break back below the 50-day EMA could lead to another test of the $0.050-$0.060 main demand zone.
Neutral outlook until a break above 200-day EMA or below 50-day EMA.

BTCUSD SIGNAL UPDATE READ THE CAPTAIN(Btcusd techincal analysis satup 👇🏼
( BTCUSD) SEEL zone
( TRADE SATUP)
ENTRY POINT (96900) to (96800) 📊
FIRST TP (96550)📊
2ND TARGET (96150) 📊
LAST TARGET (95700) 📊
STOP LOOS (97300)❌
FALLOW RISK MANAGEMENT ✅

FART-The 200% Explosion That's About To Correct – PREPARE now
## The Most Deceptive Chart Pattern In Crypto Right Now 💣
The 4-hour FARTCOIN/USDT chart reveals a textbook example of parabolic extension that's setting up for a critical reversal. This explosive move (+13.93% today) has created the perfect storm for smart traders to position ahead of what appears to be an inevitable correction.
🔥 TECHNICAL ALARM BELLS SCREAMING:
💥 Triple Channel Overextension
* FARTCOIN trapped in powerful ascending yellow megaphone pattern
* Secondary gray channel providing momentum framework
* Price hitting upper boundaries of BOTH channels simultaneously
* Current price ($1.06284) testing resistance cluster
💥 Unsustainable Vertical Rally
* 200%+ gain from April lows ($0.35503) to current levels
* Extreme volume spike (634.2K) signaling potential exhaustion
* Parabolic acceleration far exceeding mean channel growth rate
* Candle structure showing early reversal signals at resistance
💥 Blue Forecast Path: The Smart Money Road Map
* Initial testing of $1.20 psychological resistance
* Multiple retests of the $1.00 psychological support
* Final capitulation toward $0.85-0.90 channel support area
Why This Pattern Is SIGNIFICANTLY More Important Than It Appears
This isn't just another correction—it's the classic "blow-off top" formation that has historically preceded major reversals in speculative assets. The confluence of technical factors suggests we're witnessing the final phase of a multi-week uptrend.
🧠 The Psychology Behind This Pattern:**
* Retail FOMO creating final buying surge
* Smart money distribution happening during high volume spike
* Divergence between price action and momentum indicators
* Pink consolidation zone formed perfect launchpad for final push
## The ACTIONABLE STRATEGY For Maximum Protection & Profit
For CURRENT HOLDERS:
* Consider taking partial profits above $1.10
* Set trailing stops at $1.03 to protect gains
* Prepare for 20-30% retracement possibility
For NEW POSITIONS:
* Primary entry zone: $0.88-$0.92 (lower channel support)
* Potential secondary entry: $0.98-$1.02 (psychological support)
* Invalidation point: Sustained trading above $1.20
Risk:Reward = 1:3 on counter-trend positioning
The Hidden Market Dynamics Few Are Noticing
The explosive move coincides with broader altcoin rotation and appears to be sector-specific rather than fundamentally driven. The technical pattern suggests institutional distribution rather than accumulation—a critical distinction for timing the reversal.

BEAMX Looks Bullish (8H)Two higher lows have been formed at the bottom of the chart, and the price has already created a bullish CH.
A trigger line has been formed, and it is expected to break after a few touches.
With the trading range maintained, the price is expected to move towards the targets, which are marked on the chart.
Closing a daily candle below the invalidation level will invalidate this analysis.
For risk management, please don't forget stop loss and capital management
When we reach the first target, save some profit and then change the stop to entry
Comment if you have any questions
Thank You

ETHUSD – Breaker Block Rejection in Play?Ethereum has been consolidating in a rising channel after failing to break below the 1754 support zone for weeks. Yesterday, price tapped into the 1854 resistance — which also aligns with a bearish breaker block — but failed to close above, showing two strong rejections so far.
Current Observation:
The 1854 level is holding up as resistance, and the most recent candles show weakness at that zone. If price fails to break and close above it, we could see a move back down toward the 1687–1694 support area.
What I'm Watching:
– A confirmed close below the breaker block zone around 1854 could trigger a short setup, with 1754 as the first target.
– If 1754 breaks, I’ll be eyeing the next zone between 1686.8 and 1694.1 for a potential take-profit zone or reaction.
Key Levels:
– Resistance: 1854 → 1881
– Support: 1754 → 1694 → 1687
If 1854 continues to reject price, I’ll be looking to go short on confirmation, targeting a drop back into the lower support zones.
But if we get a strong close above 1854, I’ll reassess for possible upside continuation.
Let’s see how it reacts.
Trade safe.
pClem Trades

GOLD (XAUUSD) Short Idea (Sell Limit)As we see in technicals, there is a major support which can became resistance (SBR) and there is a descending Trendline as well.
So For XAUUSD pair, my presumption is price going up to 3271-3276 level (may spike a little bit) then go down to the Previous day Low level at least.
let's see what GOLD shows us.
If price closes 1H over 3285, then the setup is failed.
GOOD LUCK!

EURUSD SIGNAL UPDATE READ THE CAPTAIN(Eurusd) Signal technically analysis satup 👇🏼
( EURUSD ) BUY zone
( TRADE SATUP)
ENTRY POINT (1.13250) to (1.13200) 📊
FIRST TP (1.13400)📊
2ND TARGET (1.13600) 📊
LAST TARGET (1.13850) 📊
STOP LOOS (1.12900)❌
FALLOW RISK MANAGEMENT ✅

Gold is expected to rebound to the 3270-3275 areaFundamentals:
Focus on today's NFP market;
Technical aspects:
Gold stopped falling near 3200 and gradually rebounded, and has now rebounded to around 3240. As for this round of rebound, I have actually made it clear in my previous opinion that the bulls and bears are wrestling at the 3200 mark, and there will still be repeated in the short term, and after the downward trend slows down, some trapped bulls must have self-rescue behaviors, so it is not surprising that gold has rebounded.
From the current structure, gold has not shown a clear bottoming signal, so the gold rebound is only temporary, and gold will continue to fall after the rebound. From the perspective of frequent switching of intervals, since gold has broken through the area near 3235 during the rebound, the rebound may continue, and is expected to continue to the area near 3270-3275. After breaking through this area, it is even expected to continue to around 3290. This is the position area where we must focus on entering the short position.
Trading strategy:
1. Consider buying gold in the 3235-3230 area, TP: 3245-3255; pay attention to setting protection.
2. Consider selling gold in batches after gold rebounds to the 3270-3275 area, TP: 3240-3230

El Sewedy Electric Stock Trend AnalysisEl Sewedy Electric stock trend rose last period from the support line 78.287 to the resistance line 88.149, then rebounded to reach the support line 78.65, so the general trend was down by 0.24%. The stock rose, and broke the first support line 78.65 to reach the second support line 78.7574, then the third support line 78.858. On the other hand, when the stock rebounded, it broke the first resistance line 88.045 to reach the second resistance line 86.073, then the third resistance line 85.554

XAUUSD GOLD SIGNAL UPDATE READ THE CAPTIAN(xauusd signal technical analysis satup👇🏼
( XAUUSD) BUY zone
( TRADE SATUP)
ENTRY POINT (3255) to (3253) 📊
FIRST TP (3260)📊
2ND TARGET (3268) 📊
LAST TARGET (3280) 📊
STOP LOOS (3242)❌
FALLOW RISK MANAGEMENT ✅

GOLD - Bearish Pressure The chart for Gold (XAU/USD) on the 1-hour timeframe shows a recent sharp downward move, breaking below a previous level of support around $3,250. The price action has created a bearish fair value gap (FVG) between approximately $3,260 and $3,270, which could act as a potential resistance zone. Above this FVG, a Breaker Block in orange is also visible above - further reinforcing this area as significant resistance.
The initial sharp decline is indicated by a strong bearish candle, followed by some consolidation. A projected path suggests a potential retracement back up towards the FVG or volume imbalance before continuing its downward trajectory towards lower support levels around $3,200 and potentially $3,175. The $3,300 level appears to be a significant area of past volume resistance.

gold sellOANDA:XAUUSD Next TRD strategy and entry for Gold (XAUUSD) is here ↓
Expected price Dump after touching the entry zone.
TVC:GOLD TVC:GOLD

NIFTY Index View - May 02, 2025The index has been moving sideways since last few days this week but has moved upwards with fine volume as we had analyzed on Tuesday (April 29th).
The index still looks strong enough to continue the trend further upwards.

CHILLGUY Looks Super Bullish (1D)Note: This is a highly volatile meme coin. Risk management and capital management should not be forgotten.
It appears that a large-scale corrective wave has ended, and the price has entered a bullish wave of the same degree.
Recently, we observed a bullish CH (Change of Character) and a clean break above a resistance zone on the chart. Currently, the price is approaching a supply zone, and a significant amount of sell orders have entered CHILLGUY. A short-term correction is expected, after which the bullish move is likely to continue.
If the price reaches our marked entry points, we will enter a buy position in spot.
Targets are indicated on the chart.
The closure of a daily candle below the invalidation level will negate this outlook.
For risk management, please don't forget stop loss and capital management
When we reach the first target, save some profit and then change the stop to entry
Comment if you have any questions
Thank You

Long-term smallcap play, Clarity Pharmaceuticals (ASX:CU6)Clarity is a clinical-stage radiopharmaceutical company developing targeted theranostics — drugs that combine diagnostic imaging and therapy — using copper isotopes (Cu-64 and Cu-67).
SAR-bisPSMA: A dual-function radiopharmaceutical targeting PSMA for both imaging (with 64Cu) and therapy (with 67Cu) in prostate cancer. Est. market entry 2026-2027
SAR-Bombesin: Targets the gastrin-releasing peptide receptor (GRPR) for imaging and treatment of GRPR-positive cancers, including prostate and breast cancers. Est. market entry 2027-2028
SARTATE: Designed for diagnosing and treating neuroblastoma and neuroendocrine tumors using copper isotopes. Est. market entry 2028+
SAR-trastuzumab: A preclinical radioimmunotherapy combining trastuzumab with Clarity’s SAR Technology to target HER2-positive breast cancer. Est. market entry 2030+

XLE eyes on $83.30: Genesis fib that held Tariff Relief bounce XLE testing a key Genesis fib again at $83.30
This fib stopped the massive tariff Relief bounce.
If oil keeps dropping, this would be a good short.

CVS eyes on $68.34: Earnings Dip level to buy at Genesis fibCVS had a good earnings report that gave a nice pump.
Now looking for dip to buy or add, at Genesis fib of $68.34
Bounce needs to break the proven resistance at $70.23-70.53
=====================================================

GAP eyes on $22.xx: Proven Resistance zone could End BounceGAP struggling to recover from the tariff tantrum.
It has bounced back to the pre-tariff price level.
This would be a good spot of bears to step in heavy.
$ 22.21-22.31 is the current and previous resistance.
$ 23.21-23.45 is next resistance for back up or stop loss.
==================================================
.
