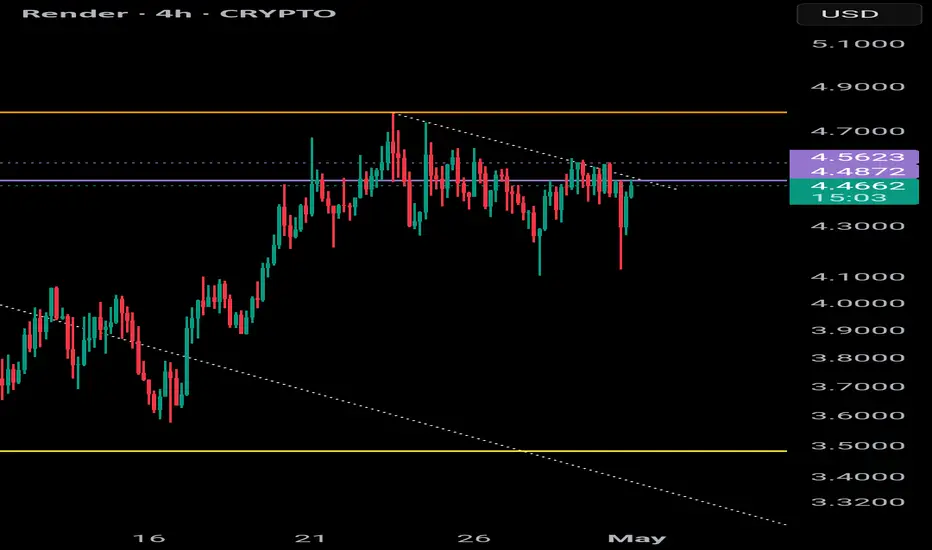
RENDER conditional longRENDER appears to be reacting to the fibonacci levels. Currently finding resistance @ the 382. If price starts to break above this level I believe the next natural step would be the 236
Conditional order = long if we break 4.52 (which also represents a break of a downtrend on the micro Timeframe - zoom into the hourly)
Setting TP @ 6.3 which is just underneath key resistance points.
Support and Resistance
ASX 200 Futures Stare Down Resistance Ahead of Pivotal ThursdayThursday looms as an important session for Australian ASX 200 SPI futures, with the price approaching a tough layer of technical resistance overhead.
Horizontal resistance at 8135, the 200-day moving average at 8142, and the October 2023 uptrend around 8180 all stand between a potential run back towards the record highs set earlier this year or a possible reversal towards 8000. The price has already broken below the uptrend established from the April lows, although the late fightback in overnight trade suggests bulls won’t give up just yet.
Momentum indicators continue to trend higher in positive territory, favouring a bullish bias that prefers buying dips over selling rips.
If price fails to break and close above the 200DMA, it creates an opportunity to establish shorts targeting a pullback to 8000, a psychologically important level. The 50-day moving average is also nearby at 7956. A stop above the 200DMA would protect against a continuation of the prevailing trend.
Alternatively, a break and close above the 200DMA would flip the setup, allowing for longs to be established with a stop below for protection. 8280—having acted as both support and resistance earlier this year—would be a logical upside target. Beyond that, a retest of the former record highs would be on the cards.
Good luck!
DS

GBPUSD ANALYSIS From the previous trading day we see that the market closed on bearish but looking at the big picture we can see that the pair is still in a bullish tend

EURJPY ANALYSISA quick breakdown into what to expect on eurjpy for the new trading day after seeing the daily candle close really bearish and the 4hr still pushing to the downside in terms of structure

Bitcoin - consolidation will lead to continuation (up)
Very basic chart.. only needs one markup !
- Institutional buyers are scared the price will drop
- Retail buyers are worried it drops (like so many are predicting)
But nobody knows where it will go next.
Common sense - After consolidation comes continuation... it wont go sideways much longer, its lightly to go up at least to the 100+ range.
That's my short summary for the next few weeks.

Sony Wave Analysis – 30 April 2025- Sony broke resistance zone
- Likely to rise to resistance level 27.00
Sony recently broke the resistance zone between the resistance level 25.60 (which stopped the previous waves (1) and B) intersecting with the resistance trendline of the daily up channel from January.
The breakout of this resistance zone accelerated the active impulse waves 3 and (3).
Given the clear daily uptrend, Sony can be expected to rise to the next resistance level 27.00, the target price for the completion of the active impulse wave 3.

EURCAD Wave Analysis – 30 April 2025
- EURCAD reversed from resistance level 1.5880
- Likely to fall to support level 1.5495
EURCAD currency pair recently reversed down from the pivotal resistance level 1.5880 (which has been reversing the price from the start of July) intersecting with the upper daily Bollinger Band and the resistance trendline of the daily up channel from 2022.
The downward reversal from the resistance level 1.5880 created the weekly Shooting Star – a strong sell signal for EURCAD.
Given the overbought daily Stochastic and the strength of the resistance level 1.5880, EURCAD currency pair can be expected to fall to the next support level 1.5495.

DXY Forecast: More Bearish OrderflowThis week, I anticipate further downside movement on the DXY, with price potentially reaching a key area of interest—a bullish order block. While the reaction at this level remains uncertain, my current bias remains bearish unless a break of structure to the upside signals a continuation of the bullish trend.

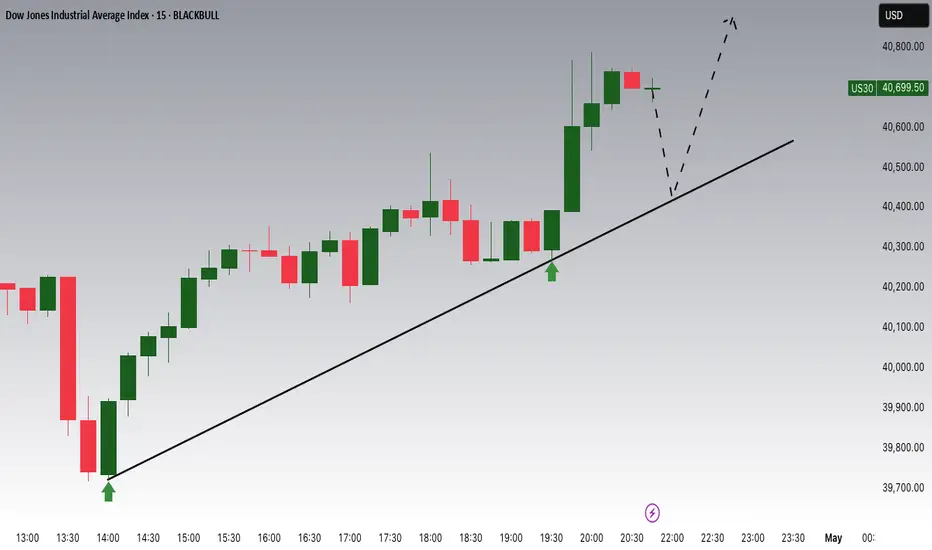
Dow Jones Potential UpsidesHey Traders, in today's trading session we are monitoring US30 for a buying opportunity around 40400 zone, Dow Jones is trading in an uptrend and currently is in a correction phase in which it is approaching the trend at 40400 support and resistance area.
Trade safe, Joe.
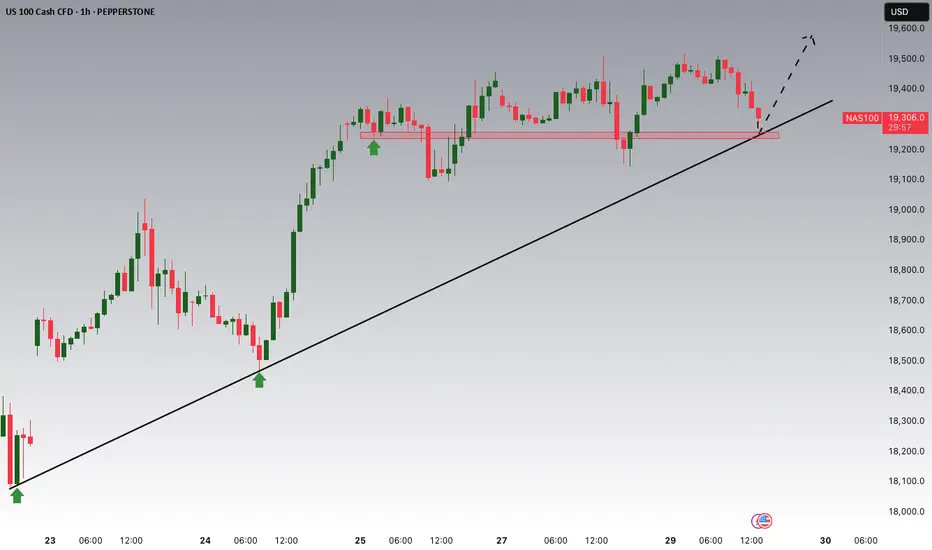
NASDAQ Potential UpsidesHey Traders, in today's trading session we are monitoring NAS100 for a buying opportunity around 19250 zone, NASDAQ is trading in an uptrend and currently is in a correction phase in which it is approaching the trend at 19250 support and resistance area.
Trade safe, Joe.
ETHUSD Stuck Below 1,830 – Bulls Losing Steam or Gearing Up?Ethereum remains range-bound below the 1,830 🔼 resistance after a failed bullish breakout attempt. Price has been consolidating between the 1,500 🔽 support and the 1,830 🔼 resistance for weeks. A breakout from either level will determine the next directional move.
Support at: 1,500 🔽
Resistance at: 1,830 🔼, 2,100 🔼, 2,530 🔼, 3,040 🔼, 4,036 🔼
Bias:
🔼 Bullish: Break and close above 1,830 could open room toward 2,100 and 2,530.
🔽 Bearish: Rejection at 1,830 or drop below 1,700 could push price back toward 1,500.
📛 Disclaimer: This is not financial advice. Trade at your own risk.

XRP/USDT – Two Long Scenarios: Support Reaction or 2.59 BreakoutXRP is currently trading around $2.19, having respected and rebounded multiple times from the $2.00–$1.80 support zone. This area has clearly acted as a structural demand zone, and it also aligns with the 50% Fibonacci retracement, adding a high-probability confluence for bullish continuation.
The recent consolidation beneath the downtrend line is now showing signs of accumulation. A bullish breakout above $2.59 would signal a structural shift, confirming a break of the descending trendline and reactivating momentum toward new highs. This level acts as a technical trigger for traders awaiting confirmation.
The Trend Strength Index (TSI) indicators also support the bullish setup:
TSI(20): 0.77, clearly bullish and strengthening
TSI(10): 0.58, near overbought, suggesting price may still pull back slightly before resuming higher
If that happens, a retest of the $2.00–$1.80 area would offer an attractive second opportunity to enter long before momentum accelerates. Both setups remain valid as long as the price holds above $1.6134, which should be the invalidation level for risk management purposes.
Upside targets include:
$3.40 (previous high)
$4.08 (Fibonacci 23.6% extension from the major leg)
Trade Setup Summary:
Entry 1: $2.00–$1.80 (support + 50% retracement)
Entry 2: Break and retest of $2.59 (trendline + structure shift)
Target 1: $3.40
Target 2: $4.08
Stop Loss: Below $1.6134
Trend Structure: Bullish while above $1.80
TSI Reading: Strong momentum with possible short-term pullback
Ripple (XRP) remains one of the most followed altcoins due to its role in real-time cross-border payments and its ongoing legal clarity in the U.S. market. With part of the SEC litigation already resolved in favor of Ripple, institutional confidence has improved, opening doors for future partnerships and potential integrations with traditional finance systems. Additionally, XRP Ledger's growing ecosystem and the company's push for stablecoin issuance on its chain support its long-term use case. Technically and fundamentally, XRP is positioned to benefit from renewed market rotation into large-cap altcoins, especially if broader sentiment continues to improve.
Disclaimer: This content is for educational and informational purposes only. It does not represent financial advice or a recommendation to buy or sell any financial instrument. Trading involves risk, and you should only trade with money you can afford to lose.

SPX as an exampleCorrect me if I'm wrong, but this has got to be one of the craziest monthly candlesticks the stock markets have ever printed, and perfectly completes a potential wave 4 in a 5 wave count.

SHORT AGAIN 100 95run it back they still dont make enough money for this valuation risky short yet again. grabbed may 23 100 90P

UK100 Bulls Charging – Will They Breach 8,490 or Stall?Price is currently consolidating just below the 8,490 🔼 resistance after a strong bullish rally. The structure remains bullish with consistent higher lows, and price is testing a key supply-turned-resistance zone. Bulls need a clear breakout to maintain momentum.
Support at: 8,378 🔽, 8,165 🔽, 7,935 🔽, 7,600 🔽
Resistance at: 8,490 🔼, 8,625 🔼, 8,729 🔼
Bias:
🔼 Bullish: A confirmed breakout above 8,490 could trigger a continuation toward 8,625 and 8,779.
🔽 Bearish: Rejection at 8,490 or break below 8,378 could initiate a drop back to 8,165 or lower.
📛 Disclaimer: This is not financial advice. Trade at your own risk.

US30 Bulls Testing Resistance – Will 40,770 Hold or Break?Price is currently testing the 40,770 🔼 resistance zone after a strong bullish push. This level has previously acted as a key ceiling and could determine the next directional move. Price has been climbing steadily with higher lows, indicating bullish momentum.
Support at: 40,194 🔽, 39,070 🔽, 36,800 🔽
Resistance at: 40,770 🔼, 41,552 🔼, 42,540 🔼
Bias:
🔼 Bullish: A clean breakout and hold above 40,770 could open the path to 41,552 and 42,540.
🔽 Bearish: Rejection at 40,770 or a drop below 40,194 could signal weakness and send price back to 39,070.
📛 Disclaimer: This is not financial advice. Trade at your own risk.

GOLD → Consolidation. Traders are waiting for news...FX:XAUUSD remains in consolidation at 3370-3270. Traders are in no hurry to take any action, as there is a lot of important news ahead. Let's take a closer look at the situation...
On Wednesday, gold is trading lower, remaining in a sideways range as traders await the release of US GDP data for the first quarter. A sharp slowdown in growth is expected, and a possible contraction in the economy could increase bets on a Fed rate cut and support gold. Meanwhile, the dollar is holding steady amid tariff news and expectations for key employment and inflation data.
A retest of the range support is forming. The approach is quite sharp, and the pre-breakout potential has been exhausted. A false breakout of support could trigger an upward correction.
Support levels: 3270, 3245
Resistance levels: 3314, 3329, 3352
If the dollar continues to fall after the news, this could support gold and the price could continue to trade between 3370 and 3270. Unpredictable news could trigger a breakout and a fall.
Best regards, R. Linda!

Short gold, gold may continue to fall to 3245-3235Fundamentals:
1. Focus on the performance of US economic data and the dynamics of the Federal Reserve;
2. Pay attention to whether the geopolitical conflicts will escalate, including the situation between India and Pakistan, Russia and Ukraine, and the situation between the United States and Iran, etc.
Technical aspects:
The rebound momentum of gold has gradually weakened, and gold has failed to effectively break through the 3320-3330 resistance zone many times recently, and has built multiple short-term top structures in this area, which has limited the height of gold rebound and further strengthened the bearish sentiment in the market, which is conducive to further decline of gold. In addition, gold has tested the area near 3260 many times, which has weakened the support strength of this area to a certain extent. Gold may fall below this area at any time and continue to the 3245-235 zone.
Trading strategy:
Consider shorting gold again with the 3315-3325 zone as resistance, and expect gold to fall below 3260 and continue to the 3245-3235 zone.

NASDAQ, USTECH, DEAD CAT BOUNCEContinues bearish divergence
Multiple rejections from resistance area
Dead cat bounce appeared
failure to break resistance can lead towards 18500 area
Gap needs to be filled in that area
Negative GDP data will be the actalyst in bearish move
job market data is also negative
slowdown of economic growth

AMD Key Long-term LevelsThese are key Long-term Levels for AMD.
Currently it is reacting positively at the key support zone of 80 to 90.
Considering the earnings release date is on 6th May 2025, monitoring the price action post earnings need to be observed. Any positive impact could possibly push the price higher.
The next key Target in the medium-term is around 120 to 130 Level.
Disclaimer:
This chart is for educational purposes only and does not constitute financial advice.

Gold key resistance not broken, Continuation of weak shock!📌 Pattern analysis and attention:
📊Technical aspects: The current golden week maintains a range of 3260-3360 fluctuations, showing a weak oscillation pattern of falling first and then rising, but with stronger downward momentum. Technical aspects show that 3360 is a short-term long-short watershed. If it cannot be broken through, it will maintain low-level fluctuations; 3340 is the core key position. If it stands firm, it will turn into a strong oscillation, otherwise it will continue to be weak. The first two days of the week closed below 3320, confirming short-term weakness.
🎯Practical strategy: Short sell when it rebounds to 3320-3325 area, target 3310-3300.

EURUSD meltdown incoming | 🔹 Pair / TF | EUR/USD, 4 h → Lower Timeframes |
| 🔹 Bias | Bearish (potential reversal after reaching higher resistance, with RFI divergence) |
📊 Key Levels (Adjusted based on higher price)
Level: ~1.13900 - ~1.14100 (Potential Immediate Resistance Zone - based on possible previous highs or Fibonacci levels not visible on the prior chart)
Level: ~1.14954 (Potential Higher Resistance - extrapolating from previous chart structure)
Level: ~1.11504 (Previous R1 - now potential support if price reverses significantly)
Level: ~1.10777 (Previous Resistance Zone - now potential stronger support if price falls further)
🚨 Trigger (Adjusted)
With an entry at 1.1375, you are likely anticipating a reversal from a higher resistance level.
Look for bearish rejection signals (bearish engulfing, pin bar) forming around the ~1.13900 - ~1.14100 zone or potentially higher.
Crucially, examine the RFI on the lower timeframes (if possible). If the price made a higher high to reach 1.1375, but the RFI did not make a corresponding higher high (or showed a lower high), this would indicate bearish divergence, strengthening the case for a potential reversal.
✅ Confirmation (Adjusted)
Confirm bearish candlestick patterns on lower timeframes (1h, 15m) at the potential resistance levels.
Look for bearish divergence on the RFI. This is a strong signal that upward momentum is waning.
If you are using RSI, watch for a break below the 50 level after the bearish price action.
Increasing selling volume on lower timeframes during the rejection would add confirmation.
🎯 Entry & Stops (Adjusted)
| 🔶 Entry | 1.1375 (Your Given Entry Price) |
| 🔴 Stop-Loss | Above the high of the rejection candle and potentially above the ~1.14100 level or the next visible resistance, depending on your risk tolerance (e.g., ~1.14250 - ~1.14400) |
Your entry is already executed. Now focus on stop-loss placement and target levels.
Risk: Manage your position size according to your risk tolerance and the chosen stop-loss level.
🎯 Profit Targets (Adjusted)
| Target | Level | Pips (approximate from 1.1375) | RRR (depending on stop-loss) |
| :----- | :--------- | :----------------------------- | :--------------------------- |
| T1 | ~1.13000 | ~75 | Varies |
| T2 | ~1.12500 | ~125 | Varies |
| T3 | ~1.11504 | ~225 | Varies |
Consider taking partial profits at each target level.
Adjust your stop-loss to breakeven or in profit as the trade moves in your favor.
⚙️ Trade Management (Adjusted)
Monitor the RFI closely for any signs of bullish resurgence. If the RFI starts breaking back above previous highs or its trendline (if one forms), consider reducing your position or closing the trade.
Pay attention to price action at potential support levels.
Be prepared to adjust your targets based on market conditions.
🔑 Rationale (Adjusted)
With an entry at 1.1375, the trade idea is based on a potential reversal from a higher, currently identified resistance level.
Bearish divergence on the RFI (if present) would be a key supporting factor, indicating that the recent upward move lacked strong momentum.
Bearish price action at resistance would confirm the selling pressure.
Targeting previous support levels offers logical profit objectives.
⚡ Highlight (Adjusted):
Given your entry at 1.1375, the strategy now revolves around a potential bearish reversal from a higher resistance level, with a strong emphasis on identifying bearish divergence on the RFI to support the short trade. Monitor price action and the RFI closely for confirmation and trade management.

Wheat / ZWN2025 / ZW1! - Price action at weekly supportWheat futures have had an interesting short-term price action character change, with a Higher-High printing on the H1. The price action is happening on a weekly level that has formed over the last year. Seasonality also favours wheat higher in the short term, although that is not the basis of this trade idea.
In anticipation of a Higher-Low forming on the H1 in this area around local support and the 61.8 fib level, there is a favourable RR trade in this area. I have decided to sell a put spread just below the market. I'm treating a break of the weekly level as a signal to manage the risk on the spread, with a first target at the daily swing high from two weeks ago. I will manage any trailing risk via the H4.
