$BTC back to $59-62kAs you can see from the chart, BTC is rejecting from the range highs which sets up the next (and final) leg lower before we continue the bull run.
Despite the bounce over the last few weeks, all we've done is retested the area which we broke down from back in February.
Now this sets up a large move lower down to the lower support levels at GETTEX:59K -$62k.
After we tag those levels, we'll continue our next move higher into 2026-2027.
Support and Resistance

SUI UPDATEHello friends✌
As you can see, after a price drop, buyers were able to break the downtrend and form an ascending channel, which, given the entry of buyers, we can buy in batches with capital and risk management to move towards the specified goals.
*Trade safely with us*

RBLX watch $60.55-61.15: Key barrier to Reject or Break to Run RBLX recovering nicely from the tariff dumps.
Currently testing a key resistance at $60.55-61.15
Look for a rejection or Break-n-Retest for entries.

BTC Breaks Out Above Key Resistance Bullish Momentum AcceleratesClassic Technical Breakout:
Bitcoin has surged past the critical $91,607 resistance level, which had capped its upside since February. This breakout marks a major shift in market momentum.
Broader Bullish Structure:
The move confirms a larger bullish structure, defined by a consistent pattern of higher lows and higher highs since the March lows, signaling strong market health.
Accumulation Zone Cleared:
Bitcoin’s breakout from the well-established $76,000–$92,000 accumulation zone further strengthens the bullish outlook, highlighting robust underlying demand.
Road to Six Figures:
Now trading above key psychological and technical levels, Bitcoin appears poised for a potential move toward six figures and a retest of all-time highs above $108,000 — as long as it holds above the breakout zone.
Conclusion:
Momentum is clearly favoring the bulls. Bitcoin’s breakout could mark the beginning of its next major rally phase. 🚀📈
#Bitcoin #BTC #Crypto #Breakout #TechnicalAnalysis #Bullish #Resistance #CryptoMarket #MarketUpdate

GOOGL eyes on $159.41-160.25: Key support that bulls MUST HoldGOOGL had a nice bounce into Resistance and retracing.
Watching well proven support zone now, at $159.41-160.25
Bulls need to Hold this zone and start going back Northward.

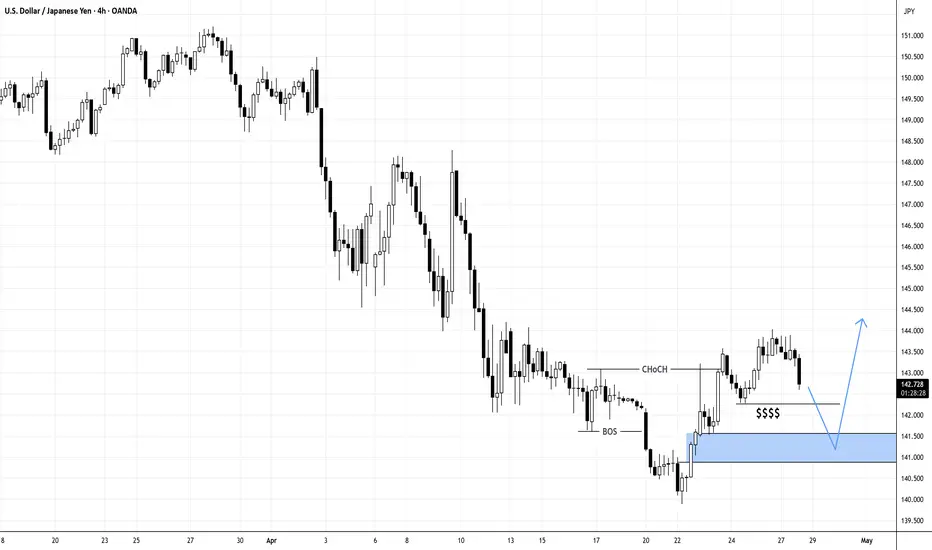
Will USDJPY Shows Reaction Below Liquidity?$$$$
N.B!
- USDJPY price might not follow the drawn lines . Actual price movements may likely differ from the forecast.
- Let emotions and sentiments work for you
- ALWAYS Use Proper Risk Management In Your Trades
#usdjpy
#usd
#jpy
CVNA watch $236-238: High support to Hold for next Leg UpCVNA recovering nicely, possible support at $236.50-238.17
If we get a dip, then watch the next Support $222.42-224.47
Likely we get a pop to next Resistance zone at $250.91-251.35

XAUUSD BULLISH CHART MAPPING IN 15-M TFI Created This XAUUSD Chart Analysis In 15-M Tf
Entry: BUY from 3387
Support zone : 3386
Target Will Be : 3405
NOTE : THIS SIGNAL IS BASED ON PERSONAL ANALYSIS FOR LEARNING PURPOSES. PLEASE USE PROPER RISK MANAGEMENT

Wajani Investments: BCHUSDPair has formed invest neck and shoulder (same formation as XRP). A bullish wedge is also indicated on the chart. In addition, the market tested a very strong resistance become support level or zone. All these indicators point to a bullish move.
NB: Always check your entries and make necessary adjustments.
Let me know your thoughts.
Please let me your thoughts. In addition, I'm trying to build followers so if you like my ideas, don't forget to like and follow for more updates.
Thank you.

Opportunity Beneath the Fear: SPY's Reversal SetupIn the Shadow of Headlines: SPY’s Drop Could Be 2025’s Big Opportunity
As markets react sharply to renewed tariff fears and Trump-related headlines, SPY continues its descent. Panic is setting in—but behind the noise, a strategic opportunity may be quietly forming.
While many rush to exit, others are beginning to position for the bounce. A well-structured entry strategy could be key to turning uncertainty into gains.
Entry Zone (Staggered):
🔹 543: First watch level—look for signs of slowing momentum.
🔹 515: Deeper entry point as the selloff extends.
🔹 <500 (TBD): Stay flexible—if panic accelerates, this could mark a generational setup.
Profit Targets:
✅ 570: Initial rebound target.
✅ 590: Mid-range level if recovery builds.
✅ 610+: Full recovery potential—rewarding those with patience and vision.
Remember: Headlines fade, but price action and preparation stay. This selloff may continue—but it might also be laying the foundation for 2025’s most powerful move. The key? Enter with discipline, protect your capital, and let the market come to you.
⚠️ Disclaimer: This content is for educational purposes only and does not constitute financial advice. Trading carries significant risk. Always conduct your own research and use proper risk management.

$SPY bear flag target between $387-443AMEX:SPY has been consolidating in a bear flag since April 7th. Should we break down from the flag, I can see a sharp move down to the lower support levels.
I think the most likely targets are at $443 and $409. However, it's possible we can find support at the other targets as well.
I think the move likely plays out before June. Let's see where we end up bouncing.
Invalidation of the downside would be a break over $567.

DIS watch $84.19-84.56: Key support might say "Bottom Is In"DIS struggling to maintain any altitude at all.
Lost all of the tariff relief bump, looking weak.
See if bulls hold key support zone $84.19-84.56

GBPUSD...LONGOANDA:GBPUSD
Market structure suggests is preparing for its next move. The AND level will likely play a critical role in the upcoming direction.
If structure breaks and confirms the shift, a new bias might form after the retest.

Wajani Investments: XRPUSD AnalysisPair has formed an inverse neck and shoulder and broken through the neckline. In addition, a bullish wedge is formed as shown. More so, the market respected a very strong resistance become support zone which has just made a LH. All these indicators point to the fact that the market is bullish.
NB: Always monitor entry and stop loss entries to make adjustments.
Let me know your thoughts.
Thank you.

KBE watch $48.16/18: Double fib to End Bounce or Break-n-Run?KBE and financials trying to recover from tariff dump.
Currently testing a double fib zone at $48.16-48.18.
Look for Rejection or Break-n-Retest for entries soon.

MicroStrategy Ignites Major Breakout Could Send Prices Soaring📈 MicroStrategy (MSTR) 4H Technical Analysis
MicroStrategy ( NASDAQ:MSTR ) is exhibiting a strong breakout structure on the 4-hour timeframe, signaling potential continuation to the upside.
Breakout Confirmation
Price action has decisively broken above the descending trendline that had acted as resistance since March.
A successful retest of the breakout level around $340-$350 strengthens the bullish case.
Key Support and Resistance Levels
Immediate support zones: $341.26 and $338.24
Deeper support: $317.48 and $301.46
Upside resistance targets : $435.76 initially, with an extended target toward $455.10 if momentum persists.
Risk-Reward Outlook
The setup offers a favorable risk-to-reward ratio, exceeding 2:1.
Well-defined risk parameters below recent support provide a clear invalidation point.
Volume and Momentum
Breakout is supported by increasing volume, confirming strong buying interest.
Momentum indicators on higher timeframes continue to tilt bullish, suggesting further room for upward movement.
Macro Context
With MicroStrategy’s heavy exposure to Bitcoin, any strength in the cryptocurrency market could act as a catalyst for continued gains.
NASDAQ:MSTR maintains above the $338–$341 support region, the technical bias remains bullish with targets set toward $435–$455. A sustained move below $317 would invalidate this outlook and shift bias back to neutral or bearish.

BANKNIFTYBanknifty levels are based on imbalances
1. gapup 55900 long
2. 55900-55550 trade breakout
3. gapdown 55550 short

Gold shocks pull the trend towards the bearish side!Gold market trend analysis:
Gold technical analysis: You should have seen the exaggeration of gold, right? Gold has also experienced several major ups and downs in history, but this time is definitely one that can be recorded in the history books. The daily lines in the past few months are very exaggerated, and the rise and fall range is unprecedented. Just today's Asian market, a simple dive is dozens of points. This is the market. The market is always right. We need to respect it the most, rather than blindly look at it subjectively. Surviving in such a big market is the most important thing. Many times, the fluctuation of gold is basically not related to technicality. We try to follow the direct pursuit mode in operation, and we can catch big profits in such a big market. Last week, the weekly line closed with a big tombstone, the weekly line top appeared, and the air force appeared. In May, gold will at least adjust to around 3,000.
The above is the 4-hour pattern, which is repairing below the moving average. If the bulls break 3370 again, there is a possibility of rising again. Otherwise, gold will adjust deeply again. This wave of adjustment is at the weekly level. The daily pattern is also turning into a peaking mode. Note that the rise and fall of gold is not based on technical aspects, but more on fundamentals and big data, as well as the impact of tariffs. Without these influences, we will be bearish this week. If the decline of the big C wave continues, the target will be 3230 (the half point of the entire April rebound) in turn. 3165 is the Fibonacci 61.8 position of the callback and also the previous high point, which is easy to form a rebound. Today's gold focuses on two major suppressions, one is the hourly suppression around 3300, and the other is 3315 and 3328, both of which are opportunities for air forces. On the whole, today's short-term operation strategy for gold is to short on rebounds and to buy on pullbacks. The upper short-term focus is on the 3298-3300 resistance line, and the lower short-term focus is on the 3265-3260 support line. Friends must keep up with the rhythm. It is necessary to control the position and stop loss, set stop loss strictly, and do not resist single operation. The specific points are mainly based on real-time intraday trading. Welcome to experience, exchange real-time market conditions, and follow real-time orders.

NIFTYNifty levels are based on imbalances
1. gapup 24500 long
2. 24500-24400 trade breakout
3. gapdown 24400 short

Gold is expected to continue to retrace the 3235-3225 region.Fundamentals:
1. The tariff issue has been relatively eased, and Trump's repeated attitude towards tariffs has made the market bullish energy not firm;
2. A small-scale conflict broke out between India and Pakistan, which has not had a great impact on gold for the time being. It is necessary to pay attention to whether the situation will escalate;
3. At the same time, it is necessary to pay attention to the dynamics of the Federal Reserve, the Russia-Ukraine negotiations, the US-Iran negotiations, etc.
Technical aspects:
At present, gold is in a state of shock correction as a whole, but from the current structure, the rebound momentum of gold is insufficient, and the rebound high is gradually decreasing. The short-term support below is in the 3265-3260 zone; the short-term resistance above is at 3310-3320; if gold cannot stand above 3300 in the short term, gold may fall further and break through the 3265-3260 zone, and continue to the 3235-3225 zone.
Trading strategy:
Short-term trading is still mainly shorting gold after the rebound. You can use the 3300-3320 area as resistance and short gold in batches
Trading target:
Profit target this week: ≥$30K;
OANDA:XAUUSD CAPITALCOM:GOLD FOREXCOM:XAUUSD FOREXCOM:XAUUSD

BTC - break of RSI?Possibility that the RSI uptrend could break and this could lead to a rectracement.
Finding resistance at 95K level.
Next level down would be 89K
Presents a long scalp opportunity: 93K TP

BITCOIN (BTCUSD): Very Bullish Pattern The price of BITCOIN formed a bullish flag pattern on a 4 hour chart following a significant uptrend.
Breaking through the flag's resistance is a strong indication of continued bullish momentum and a likely uptrend.
It is anticipated that the price could soon reach levels of 97,000 and 100,000.

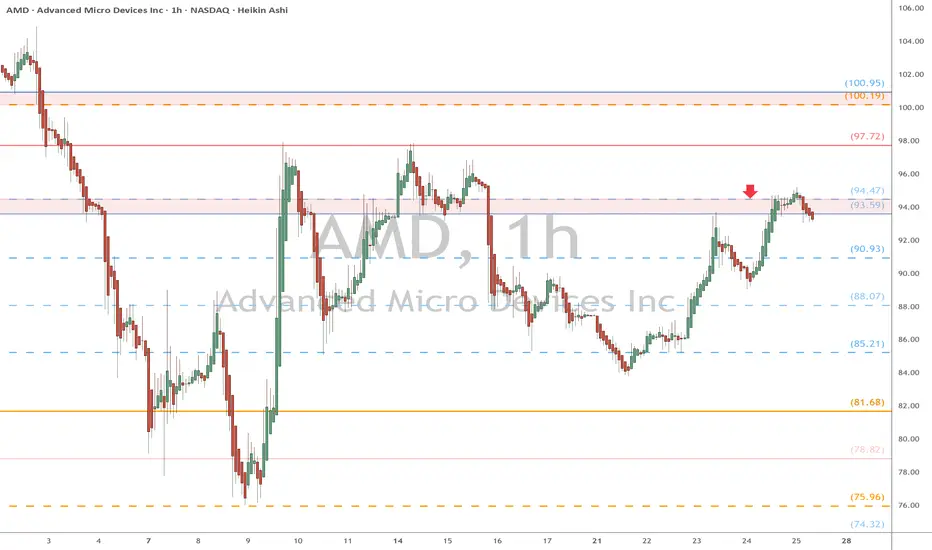
AMD watch $93.59-94.47: Key resistance to Tariff Recovery wave AMD trying to recover along with the general chip sector.
Currently testing a key resistance zone at $93.59-94.47
Pullback from here expectable, Break would show strength.