Bitcoin a Technical Summery technical summary based on what you're describing for BTCUSDT on the 4H timeframe:
Forecast from Mr Martin Date 05 May 2025
Current Setup:
Pattern: Two-sided consolidation/pattern (likely symmetrical triangle or range)
Key Support: ~89,000 USDT
Key Resistance: ~95,000 USDT
Scenarios:
Bullish Breakout:
If price holds above 95K and confirms breakout: Next target: ~98,000 USDT
Above 98K, could test psychological levels like 100K.
Bearish Breakdown: If price falls below 89K:nExpect a retest or quick rebound toward resistance (~95K).
You may see more details in the chart Ps Support with like and comments for more analysis Thanks
Support and Resistance

Just hit major resistance w/ bearish indicators.Target level is $415 to $400.
Political news will most likely influence this move. Earnings were great.
Huge volume profile gap that I think will be closed.
Watch out for another bull trap soon, but I think we just peaked.

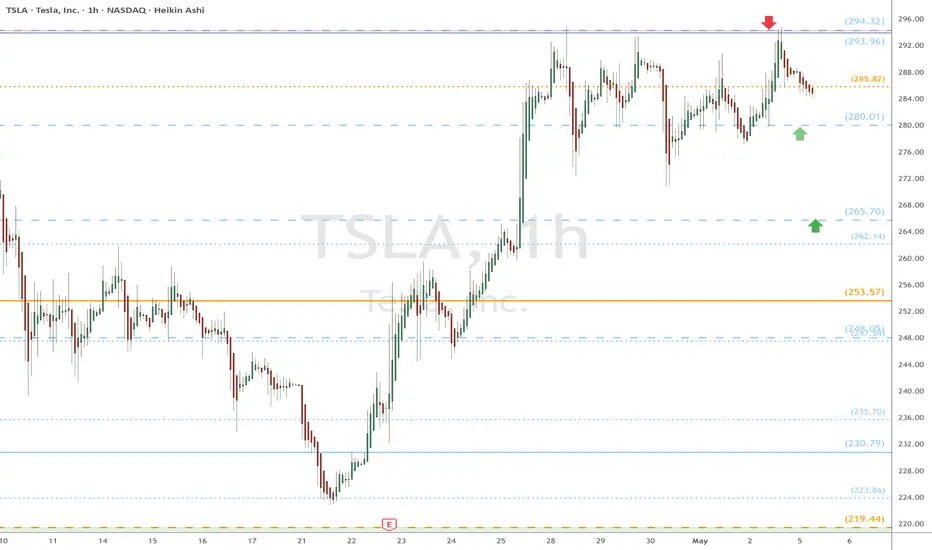
TSLA eyes on $294: Proven Resistance that bulls MUST break NOW TSLA back to a critical double fib resistance $293.96-294.32
Bulls MUST break and retest this as support and do it right now.
Any weakness could give a dip to fibs below at $280.01 or 265.70
GBP/USD Approaching Key Intraday Resistance – Will It Break The GBP/USD pair is currently testing a crucial short-term resistance zone near 1.33310 after a solid rebound from recent lows. Price is approaching this key area with increasing momentum, but previous reactions suggest this zone could act as a turning point. A rejection here might open the door for a bearish move back toward the 1.32450–1.32500 support area, while a breakout could trigger further upside potential.
**Key Levels:**
* Resistance Zone: 1.33250 – 1.33310
* Support Zone: 1.32450 – 1.32500
**What to Watch:**
* Volume behavior near resistance
* Rejection wicks or breakout candles
* Retest confirmation before entry
Set alerts around these zones to stay ahead of potential market moves. Will the bulls break through, or will sellers take control?

$CHILLGUY/USDT ready for a massive pump to $0.15BYBIT:CHILLGUYUSDT has been showing bullish signs, and is earing up for a big bullish push. Having broken and retested the $0.045 resistance zone, and also a break out rom the bullish flag formed. I believe we are about to see a huge rally up to $0.15 region, but then some resistance zones should not be overlooked as price usual bounce off from such support & resistance zones.
So prices is expected to push to;
TP1: $0.063
TP2: $0.09
TP3: $0.15
Expect minor retracements along the way.

Nifty levels - May 06, 2025Nifty support and resistance levels are valuable tools for making informed trading decisions, specifically when combined with the analysis of 5-minute timeframe candlesticks and VWAP. By closely monitoring these levels and observing the price movements within this timeframe, traders can enhance the accuracy of their entry and exit points. It is important to bear in mind that support and resistance levels are not fixed, and they can change over time as market conditions evolve.
The dashed lines on the chart indicate the reaction levels, serving as additional points of significance to consider. Furthermore, take note of the response at the levels of the High, Low, and Close values from the day prior.
We hope you find this information beneficial in your trading endeavors.
* If you found the idea appealing, kindly tap the Boost icon located below the chart. We encourage you to share your thoughts and comments regarding it.
Wishing you success in your trading activities!

Bitcoin / US Dollar Analysis mid TermI've intoduced a good Demand area in 92800-94350 which has reacted well .
It's Target would be a good Supply are for sellers. which is 95600-95800.

S/USDT 4H1. Price Trend and Key Levels
The current price is around 0.5250, attempting to hold above that zone.
Key resistance levels:
0.5300 (first major resistance)
0.5900 – 0.5999 (strong resistance zone)
0.6450 (long-term resistance)
Key support levels:
0.4585
0.4010 (stronger support at channel bottom)
---
2. Indicators Overview
BB %B (Bollinger Band Midline)
Currently below the midline, indicating past selling pressure. However, the indicator is curving upward, suggesting a possible shift toward buying.
WaveTrend (WT_LB)
Both WT lines have bounced from the oversold area (below the -60 green line), signaling a potential start of a bullish wave.
---
3. Trendlines & Channels
Multiple descending trendlines from the previous top (in blue) act as dynamic resistance.
Price is fluctuating between the blue channels marked 50000 and 30000.
---
Conclusion – Long or Short?
Long Scenario:
If the price breaks and holds above 0.5300 with strong volume:
Target: 0.5900 to 0.5999
Stop-loss: Below 0.5150
Short Scenario:
If the price fails to break 0.5300 and forms a strong bearish candle:
Target: 0.4585
Stop-loss: Above 0.5350
---
Final Thought:
Momentum is shifting toward the bulls, but there’s no strong confirmation yet. It’s better to wait for a clear breakout above 0.5300 before entering a strong long.
If you prefer an early entry, a light long position with tight risk management could be considered.
Would you like a precise entry strategy with targets and risk/reward?

XAUUSD SIGNAL UPDATE READ THE CAPTAINXauusd signal technical analysis satup 👇🏼
( Xauusd ) Sell zone
( TRADE SATUP)
ENTRY POINT (3366) to (3364) 📊
FIRST TP (3357)📊
2ND TARGET (3346) 📊
LAST TARGET (3335) 📊
STOP LOOS (3375)❌
FALLOW RISK MANAGEMENT ✅

SHORT ON NAS100Nice Double Top on NAS at a major resistance level.
I will be selling nas to the next demand level for 2000-3000 points.

LONG ON GBP/NZDGBP/NZD is respecting a major support zone and is currently ready to rise.
I will be buying GBP/NZD to the previous swing high looking to catch 200-300 pips throughout the rest of the week.

GBPNZD Bias: Bullish on support confirmationPrice has now completed the deeper pullback to 2.22091, which was our lower-level support target. On the 4H chart, price is beginning to form support here, suggesting potential upside continuation.
If this level holds, I’ll be looking for staged buys from:
2.22091 (current support area)
2.23958 (previous key support/structure break)
2.24775 (resistance flip and clean structure)
Intraday target:
2.26228 — around 400 pips from the 2.22091 support area
Next steps: Wait for confirmation from current 4H candle. If support holds and bullish structure confirms, execute in layers toward 2.26228. If 2.22091 breaks, we reassess.

EURNZDPrices broke out of H4 support zone, made a retest and gave an engulfing candle. On the H1 it formed a bearish pennant and also broke out. Alot of bearish movements going on. Looking at 1.88000 as 1st target. Lets see what price does next.

Tata Motors - Short term target - 850 to 900Tata Motors has formed Shark pattern confirmation.
Based on Fib targets it will have resistance at 850 to 900.
In short term it will have potential to reach 900 with following targets,
700 / 750 / 780 / 820 / 860 & 900.
2 Weekly candle close above 900 will have further potential upside.

Bitcoin INSIDE SchemeFib channel config of uptrend fractal starting from 2020.
Testing QM principle of uncertainty of (upward and downward) spin of particle and relating it to the condition of the market where nobody can tell if the price goes up or down, thus we have similar setting of uncertainty with fib channels of upward and downward directions. Either way market goes, the price action will always react to the fib lines.
Hence, the levels where the fib lines cross produce set of probabilities. This will always be the backbone of my further works.
Scheme can be used to compare your targets and determine if they are justified by the laws of golden ratio.
Based on outcome of graph below:

Buy gold, it will continue to 3350!Fundamentals:
Focus on Trump and the Fed;
Technical aspects:
Currently, gold is moving in a fluctuating upward manner, and in the short term, the effective double bottom structure constructed in the area around 3200 and 3220 supports the continued upward movement of gold. In the short term, gold is not very willing to fall, and it has not even been able to fall back below 3300 again. If gold breaks through the 3330-3335 area during the rebound, then gold will inevitably continue to rise to the area around 3350, or even the area around 3380.
Trading strategy:
If gold retreats next, we will mainly focus on the opportunity to go long on gold in the 3315-3305 area; TP: 3350

It’s the right time to short📌Fundamentals:
This week, the Federal Reserve will hold a rate decision, which is expected to dominate the market this week. In addition, we need to continue to pay attention to news related to the international trade situation.
📊Technical aspects:
The 1-hour moving average begins to turn, so the unilateral decline of gold has temporarily come to an end. However, the rise of gold has reached the key resistance area in the early stage, which is the starting point of the early stage of 3330. It is obviously not appropriate to chase more at this position, so the short-term may begin to adjust, and gold will go short at 3325 first. The market is changing rapidly. If gold breaks upward without stepping back, there will be no opportunity to go long. Then there is no need to chase more gold. Go short first and look at the decline and adjustment. On the whole, the short-term operation strategy of gold today is to go short on rebounds and go long on pullbacks. The short-term focus on the upper resistance of 3328-3330, and the support on the lower side is 3280-3293.
🎯Practical strategy:
Short gold when it rebounds to around 3325-3328, target around 3300-3280.
Buy gold when it falls back to 3280-3295, target around 3325-30.

GBPAUD..PULLBACKWe took profit on the previous OANDA:GBPAUD long trade.
Now the price has returned and broken that same level .
Waiting for a pullback to consider entering a short position.
Follow for more level-based strategies and real-time updates.

GBPUSD:Sharing of the Latest Trading StrategyThis week’s trading wrapped up successfully. Our exclusive VIP trading signals achieved a 90% accuracy rate!👉👉👉
This week, the exchange rate of the GBPUSD was quoted at 1.3265, dropping by 0.1054% compared to the previous trading day. Technically, focus on the resistance near 1.3329 at the upper side and the support near 1.3260 at the lower side. One can consider placing small long positions near the support level. Meanwhile, pay attention to the impact of economic data of the UK and the US as well as their monetary policies on the exchange rate.
Trading Strategy:
buy@1.3240-1.32500
TP:1.3380-1.3420
The signals in the Signature have brought about continuous profits, and accurate signals are shared every day. Hurry up and click to get them!
👇 👇 👇 Obtain signals👉👉👉

My buy view for NVDAMy buy view for NVDA.
If positive fundamentals continue to outweigh bad news, we are likely to see NVDA push further up towards $120, $130, $140, and then its previous peak of $150.
Trade with care if you are day trading, but this baby is still selling at discount in my view

EURJPY → False breakout of strong resistance at 164.FX:EURJPY rallies on news and reaches an important milestone. The liquidity pool formed above 164.00 may prevent the price from rising. There is a high chance of a false breakout.
Against the backdrop of the dollar's growth caused by PMI news, the currency pair is forming a retest of the key resistance level of 164.188 as part of a consolidation distribution and, with no possibility of continuing its growth, is making a false breakout.
Consolidation in the sell zone (below 164.188) will trigger a reversal and a fall.
Overall, the situation is neutral, with the market in a sideways range, and a false breakout could lead to a correction or reversal of the local trend.
Resistance levels: 164.188
Support levels: 163.17, 162.57
The formation of a reversal pattern relative to resistance and price consolidation below the level could give a good signal for a reversal.
Best regards, R. Linda!

XAUUSD:Sharing of the Latest Trading StrategyToday, all the trading signals finally yielded profits! Check it!👉👉👉
Today, gold has strongly rallied, breaking through the range-bound trading pattern. It climbed to as high as the level of 3,328 at its peak. However, there has been basically no retracement in the price of gold. Thus, it is highly probable that the safe-haven sentiment will be directly released, after which gold will commence its adjustment. Therefore, it is not appropriate to chase the upward trend at this position. Instead, it is advisable to patiently wait for the opportunity of a pullback from the high level. When there is a rebound to a high position, directly go short on gold!
Trading Strategy:
sell@3330-3320
TP:3300-3280
The signals in the Signature have brought about continuous profits, and accurate signals are shared every day. Hurry up and click to get them!
👇 👇 👇 Obtain signals👉👉👉

Swing Trading/XAUUSDband trading strategy points out. XAUUSD can be bought on the left side, TP3330-3350.
Aggressive traders can buy at the current price. Conservative traders can wait until the price retreats to around 3300 or below before buying.
The Swing Trading Strategy Center continues to announce trading opportunities. Stay tuned.
