BREAK AND RETESTGALAUSDT has been bullish inside of the channel forming higher highs and higher lows. Recently we saw a break and retest of the support highlighted on the chart...
For that reason , my bias is bullish from the 0.01750 level.
SL : 0.01684
TP : 0.01942
Support and Resistance

Bullish Setup on Gold: Correction hints continuation opportunityOANDA:XAUUSD is trading within a well-defined ascending channel, signaling strong bullish momentum. The price has consistently formed higher highs and higher lows, which aligns with the continuation of the uptrend. The recent pullback appears to be a healthy correction within the overall uptrend , allowing the market to potentially reset before continuing its upward trajectory within the ascending channel.
This pullback is offering a potential re-entry point for buyers, if key support levels hold. This would reinforce the bullish structure and increase the likelihood of a move toward the 3,680 price, which aligns with the channel’s upper boundary.
As long as the price remains above the support zone, the bullish outlook stays intact. However, a failure to hold above this level could invalidate the bullish scenario and increase the likelihood of a pullback toward the channel’s lower boundary.

BITCOIN Breakout Confirmed - Is $106K the Next Stop?COINBASE:BTCUSD is displaying strong bullish momentum after breaking decisively above the key $90,000 level. This breakout occurred after a well-defined double bottom formed around the major support zone near $74,000. The inability to create a new low and the sharp rejection from that zone confirmed strong buyer presence and marked a clear exhaustion of sellers.
The market is now following through with a solid bullish impulse, pushing past intermediate resistance and confirming the continuation of the ascending channel structure. With buyers stepping in aggressively and price respecting bullish market structure, Bitcoin now appears poised to reach the next significant resistance zone around $106,000, which also aligns with a big resistance level.
From a fundamental perspective, Bitcoin is gaining strength due to several key macroeconomic shifts. The recent escalation of trade tariffs by the Trump administration has heightened economic uncertainty, driving investors to seek alternative assets outside traditional markets. Historically, Bitcoin has thrived during such periods of instability, acting as a hedge against fiat volatility and centralized policy manipulation.
Adding to this backdrop, global central banks continue tightening monetary policy, increasing fears of a recession. As inflation remains sticky and growth slows, capital is flowing into assets with limited supply and no centralized control, reinforcing Bitcoin’s position as digital gold.
Meanwhile, institutional adoption continues to climb. Spot market activity is increasing, and institutional investment vehicles are seeing significant inflows. Improvements in regulatory clarity and market infrastructure are reducing barriers, allowing larger players to participate confidently. This deepening institutional interest is providing a strong foundation for sustained price movement toward $106,000.
The convergence of powerful technical patterns, especially the confirmed breakout and continuation within the ascending channel, along with strong macro and institutional support, points to a likely continuation of Bitcoin’s upside momentum.
Traders should closely monitor confirmation signals, such as bullish volume surges, strong candle closures above the $90,000 breakout level, and continuation patterns forming on lower timeframes to validate this scenario.
Feel free to share your thoughts or add further insights into this analysis!

Bullish set up is breaking out.... BUT, we have a gap to close.At the very moment we saw big rejection in this golden pocket zone were in right now from the descending channel its been in for a while.
This tells me that the market makers are creating liquidity at this level potentially to revisit at a later date.
We could quickly see this go to $6.35 or $5.40 which I would be a major buyer at.
Still in the longer term bullish trend... for now.
Option contract positions from institutions are primarily short at 5-6 strike. BUT something very interesting to me is that the $8.50 strike has a lot of puts at open interest which might squeeze it over that level if they have to cover.

GOLD REMAINS BULLISH ON LOWER TIMEFRAME - H4Despite posting the weekly indecision on gold, the metal remains bullish on the lower timeframe like H4 which is yet to break it's bullish structure. And with the rejection followed by the bullish candle before the close last trading week, XAUUSD likely will continue to rally up when market opens for trade next week.
N.B!
- XAUUSD price might not follow the drawn lines . Actual price movements may likely differ from the forecast.
- Let emotions and sentiments work for you
- ALWAYS Use Proper Risk Management In Your Trades
#gold
#xauusd

SPX / SPY / ESM5 - Resistance levels aheadSPX is looking healthier above its shorter term MAs, particular with two closes above the 21 and downward trend line. There are still plenty of resistance areas ahead, including key fib levels, a gap fill, 100 and 200 down-sloping EMAs, and a swing symmetry level.

YINN Stock Chart Fibonacci Analysis 042525Trading Idea
1) Find a FIBO slingshot
2) Check FIBO 61.80% level
3) Entry Point > 30/61.80%
Chart time frame: D
A) 15 min(1W-3M)
B) 1 hr(3M-6M)
C) 4 hr(6M-1year)
D) 1 day(1-3years)
Stock progress: A
A) Keep rising over 61.80% resistance
B) 61.80% resistance
C) 61.80% support
D) Hit the bottom
E) Hit the top
Stocks rise as they rise from support and fall from resistance. Our goal is to find a low support point and enter. It can be referred to as buying at the pullback point. The pullback point can be found with a Fibonacci extension of 61.80%. This is a step to find entry level. 1) Find a triangle (Fibonacci Speed Fan Line) that connects the high (resistance) and low (support) points of the stock in progress, where it is continuously expressed as a Slingshot, 2) and create a Fibonacci extension level for the first rising wave from the start point of slingshot pattern.
When the current price goes over 61.80% level , that can be a good entry point, especially if the SMA 100 and 200 curves are gathered together at 61.80%, it is a very good entry point.
As a great help, tradingview provides these Fibonacci speed fan lines and extension levels with ease. So if you use the Fibonacci fan line, the extension level, and the SMA 100/200 curve well, you can find an entry point for the stock market. At least you have to enter at this low point to avoid trading failure, and if you are skilled at entering this low point, with fibonacci6180 technique, your reading skill to chart will be greatly improved.
If you want to do day trading, please set the time frame to 5 minutes or 15 minutes, and you will see many of the low point of rising stocks.
If want to prefer long term range trading, you can set the time frame to 1 hr or 1 day.

TESLA Stock Chart Fibonacci Analysis 042525Trading Idea
1) Find a FIBO slingshot
2) Check FIBO 61.80% level
3) Entry Point > 260/61.80%
Chart time frame: B
A) 15 min(1W-3M)
B) 1 hr(3M-6M)
C) 4 hr(6M-1year)
D) 1 day(1-3years)
Stock progress: A
A) Keep rising over 61.80% resistance
B) 61.80% resistance
C) 61.80% support
D) Hit the bottom
E) Hit the top
Stocks rise as they rise from support and fall from resistance. Our goal is to find a low support point and enter. It can be referred to as buying at the pullback point. The pullback point can be found with a Fibonacci extension of 61.80%. This is a step to find entry level. 1) Find a triangle (Fibonacci Speed Fan Line) that connects the high (resistance) and low (support) points of the stock in progress, where it is continuously expressed as a Slingshot, 2) and create a Fibonacci extension level for the first rising wave from the start point of slingshot pattern.
When the current price goes over 61.80% level , that can be a good entry point, especially if the SMA 100 and 200 curves are gathered together at 61.80%, it is a very good entry point.
As a great help, tradingview provides these Fibonacci speed fan lines and extension levels with ease. So if you use the Fibonacci fan line, the extension level, and the SMA 100/200 curve well, you can find an entry point for the stock market. At least you have to enter at this low point to avoid trading failure, and if you are skilled at entering this low point, with fibonacci6180 technique, your reading skill to chart will be greatly improved.
If you want to do day trading, please set the time frame to 5 minutes or 15 minutes, and you will see many of the low point of rising stocks.
If want to prefer long term range trading, you can set the time frame to 1 hr or 1 day.

Bounce Token (Auction) to $100 over the next 120 daysOn the month of August 2023 at a price of $4 Without Worries published “Bounce Token (Auction) to $40” (see below / green triangle on chart above). Price action went 10x over the next 120 days. Almost worth getting out of bed for. Then the idea “Auction to $16” (see below / red triangle) was published at $45 on December 2023. Price action corrected to $7.
Overall price action has corrected 85% since the last idea. A number of reasons now exist to consider a long position, they include:
1. Price action and RSI resistance breakouts.
2. Support on past resistance. Not just the downtrend resistance, the horizontal support also, look left. All the way left back to 2022 (see chart below).
3. The same hidden bullish divergence that printed in early February (orange circles) now prints again. Previously this divergence was followed by a 600% breakout move in the 6 weeks that followed.
Until this point conditions 1 through 3 are an exact copy of the $40 idea. Look left, a higher low matched in both price action and RSI breakouts, wonderful isn't it?
4. The Bull flag takes the first impulsive wave to measure the next forecast the next wave to circa $110 area.
Is it possible price action continue to correct? Sure.
Is it probable? No.
Ww
“Bounce Token (Auction) to $40”
“Auction to $16”
Horizontal support / resistance from 2022

#PEPEUSDT: Ready to launch | Will price hit previous high? EPEUSDT’s price has accumulated and is currently in the distribution phase, where we can anticipate a bullish impulse pattern. There are three targets, but our long-term objective is for the price to surpass its previous record high. We anticipate the price to reach or even surpass the previous high.
Wishing you good luck and safe trading!
Thank you for your unwavering support! 😊
If you’d like to contribute, here are a few ways you can help us:
- Like our ideas
- Comment on our ideas
- Share our ideas
Team Setupsfx_
❤️🚀

VETUSDT: trend in daily time framesThe color levels are very accurate levels of support and resistance in different time frames, and we have to wait for their reaction in these areas.
So, Please pay special attention to the very accurate trend, colored levels, and you must know that SETUP is very sensitive.
Be careful
BEST
MT

SUSDT: trend in daily time framesThe color levels are very accurate levels of support and resistance in different time frames, and we have to wait for their reaction in these areas.
So, Please pay special attention to the very accurate trend, colored levels, and you must know that SETUP is very sensitive.
Be careful
BEST
MT

Yatharth hospital 470-490Yatharth hospital 470-490
Yatharth Hospital & Trauma Care Services Ltd. is a multi-specialty hospital chain operating in North India, with locations in Noida, Greater Noida, Noida Extension, and Jhansi. The hospital has been expanding its bed capacity and revenue at a strong pace, with operational bed capacity growing at a 25% CAGR and revenue increasing at 50% CAGR

UNH Long $400 - Wyckoff Re-Accumulation SchematicWyckoff Re-Accumulation on UNH after recent ER sell off. Look for $400 to be supportive. Potentially an excellent addition the long term portfolio.
NYSE:UNH

With Last Trading Week Indecision Next Week Will be BIG for GoldGold shows indecision after the close of trading hours for last week, and with the long sellers' wick exhibited on the candlestick, XAUUSD will require a huge geopolitical uncertainty news for price to continue to rise. A further rejection will drag gold's price to its mean.
N.B!
- XAUUSD price might not follow the drawn lines . Actual price movements may likely differ from the forecast.
- Let emotions and sentiments work for you
- ALWAYS Use Proper Risk Management In Your Trades
#gold
#xauusd

GOOGL Alphabet Inc (Google) Opportunity After the Breakout?The stock's recent breakout from a descending channel pattern indicates potential for continued upward momentum. Monitoring the $155 support level is crucial, as a drop below may signal a trend reversal.
📊 Technical Analysis
Current Price: $161.96
52-Week Range: $140.53 – $207.05
Recent Breakout: Surpassed descending channel resistance
Key Support: $155
🎯 Entry Points:
$158 (ideal pullback)
$155 (support confirmation)
$145-132 (aggressive long-term entry)
📈 Targets:
First target: $168
Second target: $182
Third target: $196+
Disclaimer:
This analysis is for educational and informational purposes only and should not be considered financial advice. Always do your own research before making any investment decisions.

The beginning of the carry trade unwind part 2?If we look at the chart, the current structure looks very similar to what happened right before the market decline in August.
We've formed a head and shoulders (albeit not perfect as it's slanted), and price seems to be breaking down.
If price action accelerates to do downside, it's likely to take the market with it just like it did the last time.
Paying attention to this over the coming weeks.

$SOL one more leg lower to $64-80Even though CRYPTOCAP:SOL has bounced nearly 50% from the bottom, the fall isn't over yet.
If we look at the chart, we can see that Solana has only fallen 4/5 waves down and it's the last leg down that will be painful for most.
Everyone is long again calling for new highs, yet the chart is still bearish.
I think it's likely that price retraces from around this level and falls down to the lower supports at $64-80.
Once we hit that region, it'll setup a good trade for the long term.

TRX/USDTThe coin has a macro bullish structure. After a correction, it’s been in accumulation for 127 days. Upside targets are 0.33–0.44

AAVE/USDTThe coin is showing a bullish structure both locally and on the higher timeframes. Once the November low is swept, we can look for longs with a target at 194

BTC BACK AT A PREVIOUS MONTH HIGH OF 94k! WHAT NEXT?Price trades at $94,264 which is previous month high price. Technically, this is a resistance high which we’re likely going to see a further bullish breakout before we can confirm a high probability of price trading back at $100,000
From the technical standpoint, we’re likely going to see a possible pullback of the previous week impulse move before buyers can step in again. Next bull target is 100k,110k

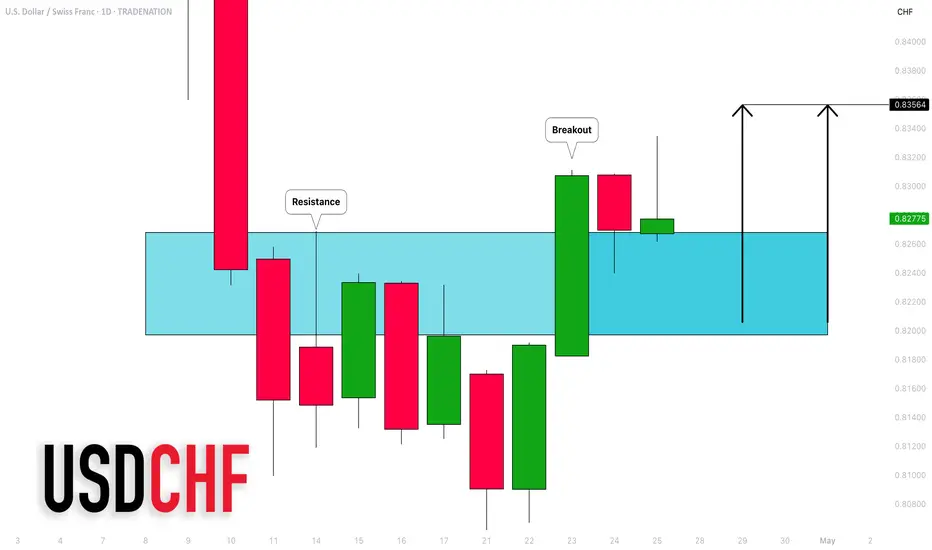
USDCHF: Important Breakout & Bullish Outlook Explained
USDCHF broke and closed above a key daily horizontal resistance area.
The broken structure most likely turned in a strong support.
I expect a bullish continuation from that next week.
Goal - 0.8356
❤️Please, support my work with like, thank you!❤️
I am part of Trade Nation's Influencer program and receive a monthly fee for using their TradingView charts in my analysis.
XRP - Bulls Preparing to Push Towards $2.50XRP has maintained a bullish tone after completing a significant gap fill, currently consolidating around $2.18. The previous impulsive move left behind an unmitigated imbalance below, suggesting that the market could be preparing for a controlled retracement. The overall structure remains bullish, but a corrective dip into key demand zones would align with healthy price development before the next leg higher.
Imbalance Structure and Retest Expectation
During the rally from the sub-$2.00 range, XRP formed a sharp move that created an inefficiency between approximately $2.05 and $2.12. This gap between buyers and sellers indicates that liquidity was left behind, often acting as a magnet for price.
Currently, XRP appears to be positioning itself to retest this imbalance, refilling orders and potentially gathering the momentum needed for a stronger continuation. I expect price to sweep into this zone, likely finding responsive buyers as it rebalances the inefficiency and revisits previous structural points of interest.
Reaction Zone and Bullish Confirmation
The primary area of interest lies firmly within the $2.05 to $2.12 range. A reaction from this zone, confirmed by strong bullish price action such as a higher low formation or a bullish engulfing candle, would validate the setup for further upside.
Following the retracement and bounce, the immediate objective will be a clean break above the $2.30 resistance. This level has acted as a cap on recent price action and represents a key liquidity threshold. A decisive move through this resistance would open the path toward higher targets, confirming the strength of the new impulsive phase.
Upside Target Projection
My upside target for this trade idea is located at $2.47. This level coincides with a previous high and clusters near the upper boundary of visible supply zones on the higher timeframes. Reaching this target would represent a continuation of the broader bullish structure while also completing a logical expansion leg relative to the recent price range.
Risk Management and Invalidation
The bullish bias remains valid as long as XRP holds above the lower boundary of the imbalance zone, around $2.05. A sustained breakdown below this level, particularly if accompanied by strong bearish momentum, would invalidate the idea, signaling that a deeper retracement is unfolding.
Until such invalidation occurs, the approach remains to monitor the retracement into the key demand zone and assess the strength of the subsequent reaction for potential long entries.
Conclusion
XRP is showing strong structural signs of bullish continuation but may first revisit the unfilled imbalance below. A clean reaction from this zone, followed by a break above $2.30, would likely set the stage for a rally into the $2.47 target. Patience is key in awaiting the retest and confirming bullish intent before execution.
___________________________________
Thanks for your support!
If you found this idea helpful or learned something new, drop a like 👍 and leave a comment, I’d love to hear your thoughts! 🚀
Make sure to follow me for more price action insights, free indicators, and trading strategies. Let’s grow and trade smarter together! 📈
