TON Buy/Long Setup (2H)On your chart, the coin has been forming consecutive higher lows and consistent bullish CHs on the lower timeframes.
We can enter positions around the green lines, which are our ENTRY levels.
The targets are marked on the chart.
Let’s wait and see what happens.
For risk management, please don't forget stop loss and capital management
When we reach the first target, save some profit and then change the stop to entry
Comment if you have any questions
Thank You
Support and Resistance

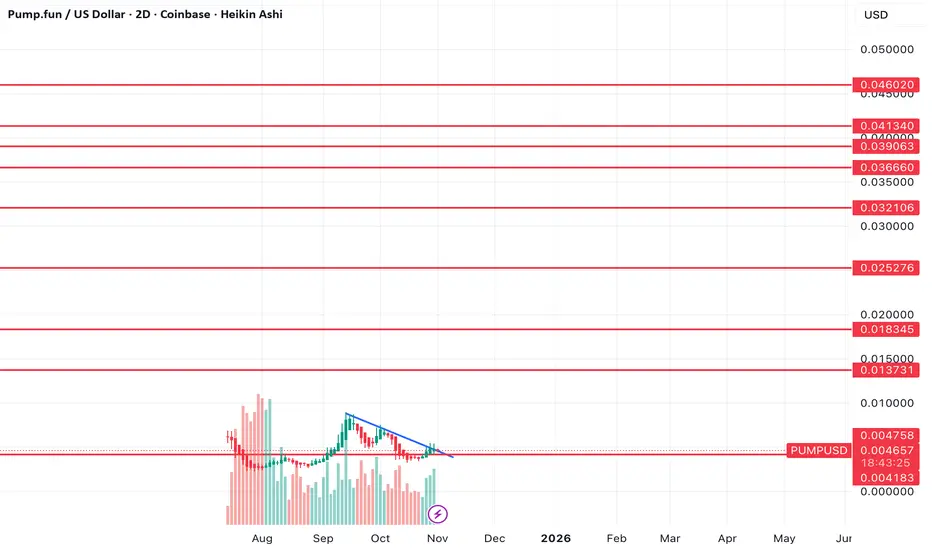
Is pump about to pump to new highs?Since September, Pump has corrected, however now it looks like we've broken and retested the downtrend and it looks set to move higher from here.
I've marked off key resistance levels on the way up.
Think we could see a pretty large move if this really gets going.
GBPUSD is in the Buying DirectionHello Traders
In This Chart GBPUSD HOURLY Forex Forecast By FOREX PLANET
today GBPUSD analysis 👆
🟢This Chart includes_ (GBPUSD market update)
🟢What is The Next Opportunity on GBPUSD Market
🟢how to Enter to the Valid Entry With Assurance Profit
This CHART is For Trader's that Want to Improve Their Technical Analysis Skills and Their Trading By Understanding How To Analyze The Market Using Multiple Timeframes and Understanding The Bigger Picture on the Charts

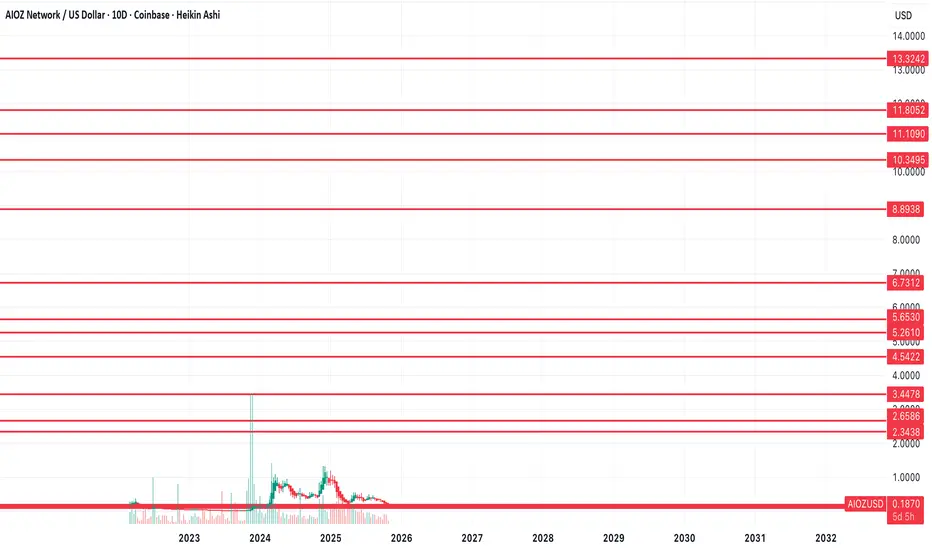
$AIOZ getting into long term buy levels$AIOZ is coming into my long term buy area here. I bought some at $.179, and it maybe can see one more move down to $.15 and have some lower supports on the chart incase of an extreme capitulation, but I'm accumulating from here on out as I think this could be a coin that sees over $10.
Let's see how it plays out.
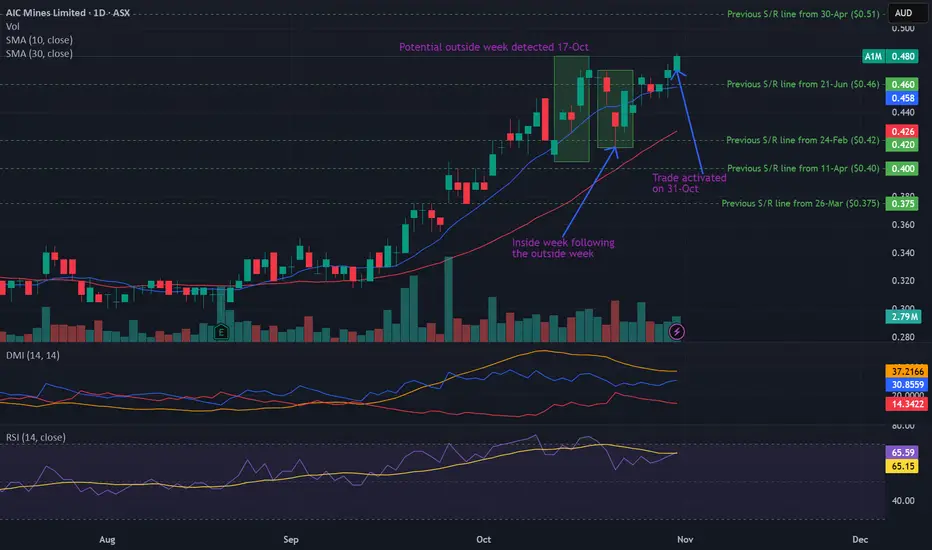
Potential outside week and bullish potential for A1MEntry conditions:
(i) higher share price for ASX:A1M above the level of the inside week following the potential outside week noted on 17th October (i.e.: above the level of $0.47).
Stop loss for the trade would be:
(i) below the low of the inside week on 22nd October (i.e.: below $0.415), should the trade activate.
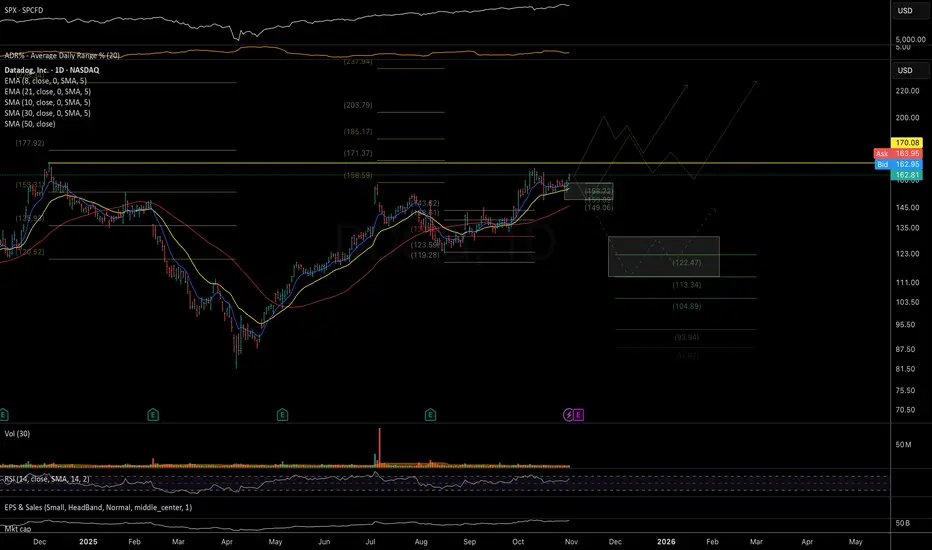
DDOG: interesting macro potential Interesting large multi-year VCP formation. Earnings are on Nov 6. While there’s still a chance that the correction from the June highs isn’t fully complete and that price is currently in a higher-degree bounce (running flat correction), I’ll be on the lookout for a potential (gap-up) earnings breakout.
If such a move occurs—especially if supported by a strong and positive catalyst—I’ll be watching for a delayed-reaction setup for a possible entry.
Chart:
Macro view:
$GIGAUSD 200%-500% bounce incoming?Alts are starting to look really interesting down here.
If we look at the chart of Giga, it looks like we've had capitulation and have broken prior lows, however it also looks like a strong bottom/base is forming here and we could be setting up for a larger move higher.
We've been consolidating in a falling wedge and the next move at the top of the wedge should break it to the upside.
I've marked off key resistance levels that I think we can see a move to, however, I think it's possible we can head to the top resistance.
I'm long.

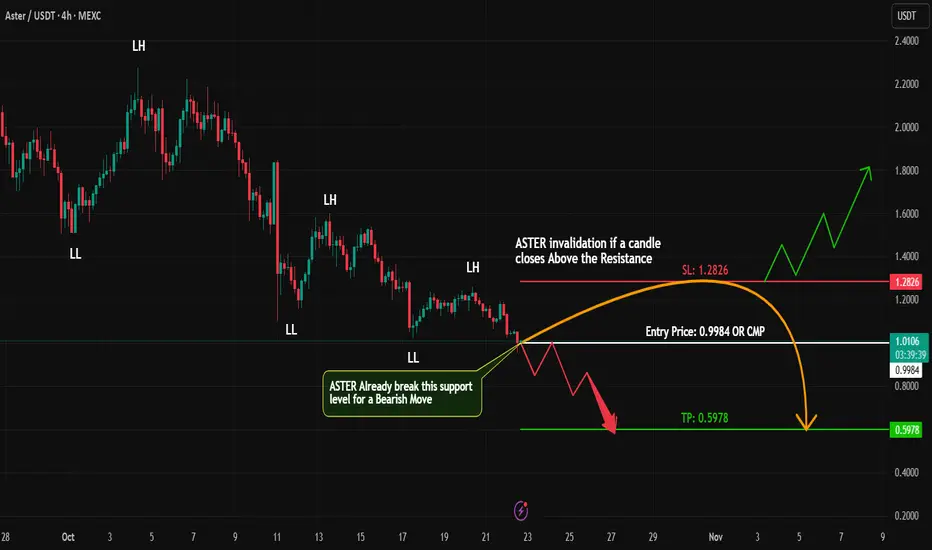
ASTER Short Setup | Simple Dow Theory in ActionDescription:
According to Dow Theory, the market defines a downtrend when it consistently forms Lower Highs (LHs) and Lower Lows (LLs) — and that’s exactly what #ASTER is showing on the 4H timeframe.
The price has broken below the previous LL, confirming a continuation of the bearish structure. This breakdown gives a strong technical confirmation for a potential short trade at the current market price (CMP).
I’ll be watching for:
Sustained price action below the recent LL
Retest rejection for entry confirmation
Strict risk management to protect capital
Remember, even strong projects experience healthy corrections — #ASTER remains a fundamentally solid coin, but the technical are favoring bears in the short term.
What’s your view on this setup? Are you taking the short or waiting for a reversal signal?
#ASTER #CryptoAnalysis #DowTheory #PriceAction #ShortSetup #4HChart #BearishTrend #CryptoTrading #TechnicalAnalysis #TradingViewCommunity
Gold is Ready For Bull From SupportHello Traders
In This Chart GOLD HOURLY Forex Forecast By FOREX PLANET
today Gold analysis 👆
🟢This Chart includes_ (GOLD market update)
🟢What is The Next Opportunity on GOLD Market
🟢how to Enter to the Valid Entry With Assurance Profit
This CHART is For Trader's that Want to Improve Their Technical Analysis Skills and Their Trading By Understanding How To Analyze The Market Using Multiple Timeframes and Understanding The Bigger Picture on the Charts

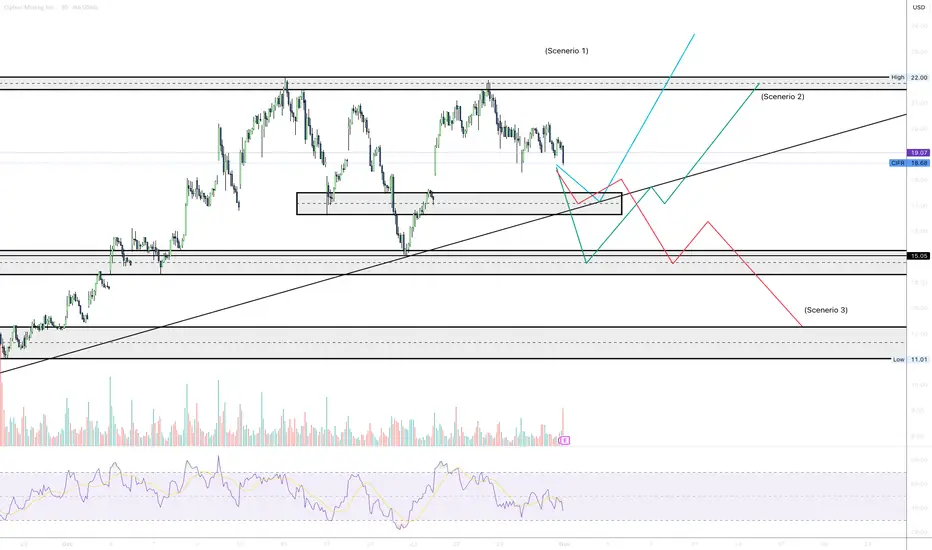
CIFR CHART ANALYSIS - WEEK OF NOVEMBER 3rd 2025 - 4HR TIMEFRAME4HR CHART ANALYSIS. Price continues to be bullish if price stays along the trend-line and stay above strong support (please refer to the chart).
Nifty Short term resistances and Supports. Nifty came crumbling down on Profit booking and US trade deal issue not settling down even as another month goes by.
The support currently for Nifty remain near the trend line which is at 25708. If this support is broken Nifty may fall further and the next supports in line are at 25629, 25585, 25512 and a strong Father line support of 200 Hours EMA at 25455.
Resistances on the other hand for Nifty in case of any of the mentioned support is taken remain at 25841 Strong Mother line resistance of 50 Hours EMA and 25880. If these 2 resistances are crossed and we get a closing above them the next resistances in line are at 25956, 26039 and 26108.
After we get a closing above 26108 we can think of Nifty regaining the previous all-time high or even crossing it.
Disclaimer: The above information is provided for educational purpose, analysis and paper trading only. Please don't treat this as a buy or sell recommendation for the stock or index. The Techno-Funda analysis is based on data that is more than 3 months old. Supports and Resistances are determined by historic past peaks and Valley in the chart. Many other indicators and patterns like EMA, RSI, MACD, Volumes, Fibonacci, parallel channel etc. use historic data which is 3 months or older cyclical points. There is no guarantee they will work in future as markets are highly volatile and swings in prices are also due to macro and micro factors based on actions taken by the company as well as region and global events. Equity investment is subject to risks. I or my clients or family members might have positions in the stocks that we mention in our educational posts. We will not be responsible for any Profit or loss that may occur due to any financial decision taken based on any data provided in this message. Do consult your investment advisor before taking any financial decisions. Stop losses should be an important part of any investment in equity.

AKE Analysis (4H)It seems that AKE is oscillating within a large range to absorb liquidity. It keeps forming lower highs while clinging to a weak trendline. It’s expected that this trendline will soon break, or at least the candles will retest it once more.
The best area for a price rejection—at least down to the weak trendline (which is also our liquidity pool)| is the red-marked zone.
A daily candle closing above the invalidation level will invalidate this analysis.
For risk management, please don't forget stop loss and capital management
When we reach the first target, save some profit and then change the stop to entry
Comment if you have any questions
Thank You

TeslaI have taken 2 time frames to get confused. 😇 The 15-minute time frame shows a resistance breakout out and the hourly time frame shows a descending channel resistance.
It is always better to take less risky trade entries.
If the price is unable to break the channel's resistance and fall, watch whether the price is showing bullish strength around the 440 to 444 zone. If there is bullish strength, buy above 445 with the stop loss of 440 for the targets 449, 454, 459 and 464.
Always do your analysis before taking any trade.

NZDUSD is in the Selling DirectionHello Traders
In This Chart NZDUSD HOURLY Forex Forecast By FOREX PLANET
today GBPUSD analysis 👆
🟢This Chart includes_ (NZDUSD market update)
🟢What is The Next Opportunity on NZDUSD Market
🟢how to Enter to the Valid Entry With Assurance Profit
This CHART is For Trader's that Want to Improve Their Technical Analysis Skills and Their Trading By Understanding How To Analyze The Market Using Multiple Timeframes and Understanding The Bigger Picture on the Charts

GBPAUD is in the Bullish TrendHello Traders
In This Chart GBPAUD HOURLY Forex Forecast By FOREX PLANET
today GBPAUD analysis 👆
🟢This Chart includes_ (GBPAUD market update)
🟢What is The Next Opportunity on GBPJPY Market
🟢how to Enter to the Valid Entry With Assurance Profit
This CHART is For Trader's that Want to Improve Their Technical Analysis Skills and Their Trading By Understanding How To Analyze The Market Using Multiple Timeframes and Understanding The Bigger Picture on the Charts

EXPECTATION FOR THE WEEK/WEEKS AHEAD Gold is in-between two major zones, buy zone at 3998-3980 and a sell zone at 4020-4037 and price can respect any of the two major zones and start moving in either direction but based on last week price action i will still go for sells, although Gold is fundamentally expected to buy again because of reduced rate and higher inflation it would probably sell again this week ahead to create the monthly low and also to test a higher time frame buy zone below before it starts with another massive buys to end the year,
so let target a sell at 4014-4020 when market opens, with sl around 4035/37 and tp not less than 500pips or far below , because this sell is expected to reach somewhere 3870-50, before the long term buy start , i will update you along the way and if it decides to buy midway i will signal or update you but if it reaches 3870-50 and it decides to move below it to sell more too i will update and that will signal a very long term sells so let be on alert mood as i always be .
A lot discovered so always be around, forex is not scary to us anymore it's rather interesting because everything is based on time and price, that's why you see prices plotted against time, very interesting indeed.

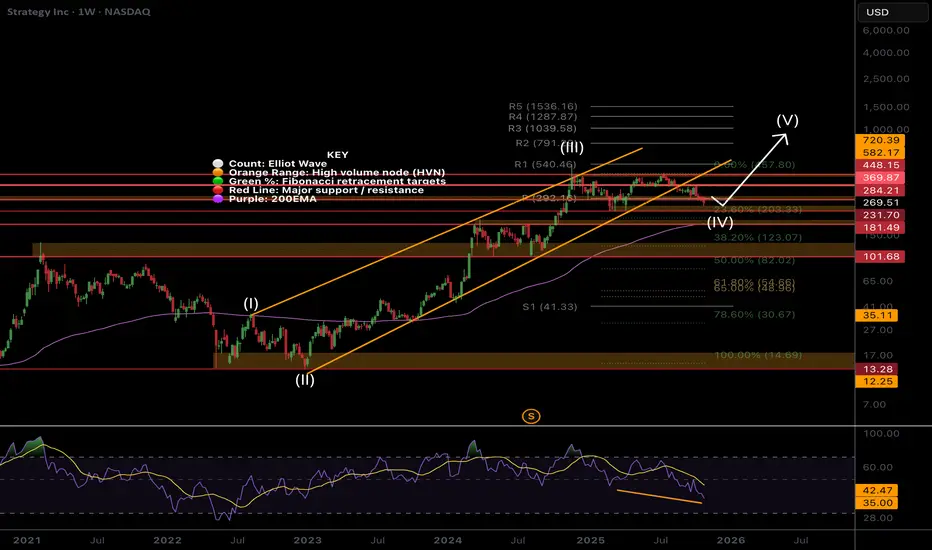
MSTR weekly bull divergence on low sentimentSentiment is low, the asset is hated and misunderstood by TradFi and retail. It’s a recipe for a bottom!
Price is still in a wave (IV) which are expected to be long and drawn out, driving investors into shallow capitulation through boredom into patient hands. I don’t expect wave (V) to kick in until Bitcoin moves. Wave (V) has an expected target of the R3 daily pivot at $1039 but will overextend if Bitcoin does.
Price has fallen out of the lower channel boundary and sitting below the weekly pivot, still above the weekly 200EMA so the outlook is bullish. Wave (4) may complete at the 0.236 Fibonacci retracement at $230. For now I am waiting to see what happens before entering. Good opportunities are setting up.
🎯 Terminal target for the business cycle could see prices as high as $1000 based on Fibonacci extensions
📈 Weekly RSI has bullish divergence
👉 Analysis is invalidated if we close back below $82
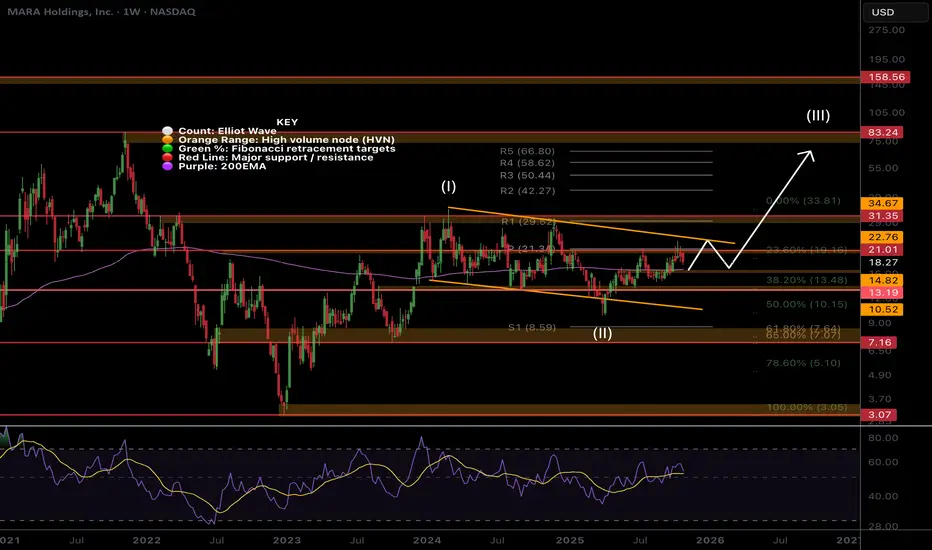
MARA boring... Investors cant waitMara has the potential for a strong move alongside Bitcoin but has ultimately been boring. Investors struggle the most with boredom and see is as negative and bearish. This is not the case and it could just be accumulating towards a strong breakout.
Price is stalling at the weekly pivot as expected but is above the 200EMA- a great buy spot. Wave (II) appears complete at the 0.5 Fibonacci retracement with a swing below the lower boundary trend-line. Wave 3 of (III) appears to be underway so I am looking for an aggressive breakout to the upside once we clear the current resistance. The R1 pivot is the first target at $30 where the last bit of major resistance is. Wave (III) has a target of $83 at the next major High Volume Node resistance, just above the R5 pivot.
🎯 Terminal target for the business cycle could see prices as high as $80 based on Fibonacci extensions and High Volume Nodes
📈 Weekly RSI is at the EQ.
👉 Analysis is invalidated if we close back below wave 2 at $9.50.
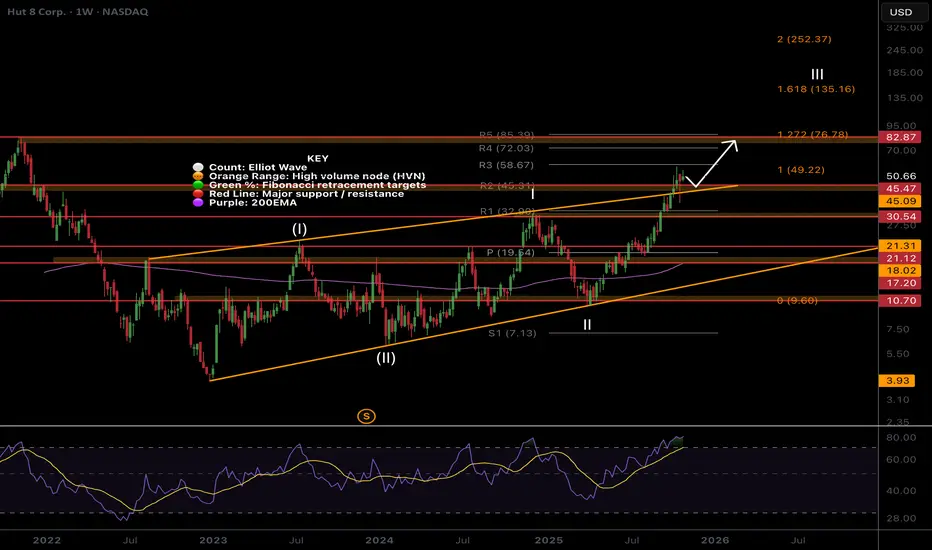
HUT, ready for more upsideHuge daily candles are perfectly normal behaviour and nothing to be afraid of, we stay zoomed out to observe the larger trend to keep our emotions check.
Price has broken out of the channel upper boundary and a test of the boundary took place as expected, quickly catching a bid. We are now looking for continuation to trigger a long.
The next target is the High Volume Node resistance at $82 just under the R5 weekly pivot. Fibonacci extension 2 has a terminal target of $252, achieved with momentum and tailwinds only.
📈 Weekly RSI is oversold with no divergence and can remain here for months as price keeps increasing.
👉 Analysis is invalidated if we close back below the weekly 200EMA
GBP-USD Bearish Bias! Sell!
Hello,Traders!
GBPUSD Price continues its bearish structure after rejecting from the horizontal supply area. Smart money is targeting the liquidity resting below the recent swing lows. Time Frame 5H.
Sell!
Comment and subscribe to help us grow!
Check out other forecasts below too!
Disclosure: I am part of Trade Nation's Influencer program and receive a monthly fee for using their TradingView charts in my analysis.

Nifty Analysis EOD – November 3, 2025 – Monday🟢 Nifty Analysis EOD – November 3, 2025 – Monday 🔴
A Day of False Breakouts — Signs of Base Building or Just Another Trap?
🗞 Nifty Summary
Nifty opened 38 points lower, quickly filled the gap in the initial move but couldn’t hold above the 25715 support zone, slipping further to mark the day’s low at 25645.50. From there, a sharp recovery of over 100 points lifted the index above the previous day’s close (PDC) to a new day high of 25761.5, forming the Initial Balance (IB) High.
After a brief retracement, a strong rally attempted to break the IB High, but the very next candle proved it a false breakout, pulling Nifty back under control of the bears. Price hovered near the IB zone, with multiple breakout attempts followed by quick rejections. A double bottom pattern emerged around the earlier swing low, which helped bulls stage another rally toward the IB High — and once again, a false breakout ensued.
Finally, around 2:10 PM, Nifty decisively broke above the IB High, rallying to the next resistance zone of 25790, where it again faced rejection but managed to close near the day’s high at 25774.3, above both CDO and PDC levels.
While the day looked random at first glance, the price behavior reflected a pattern typical of base-building phases — a mix of failed breakouts, mid-range compressions, and reactive rallies. If this indeed is a base formation, the 25700 zone must hold in coming sessions.
As highlighted in yesterday’s note, 25790 was the key level, and today’s close near it makes tomorrow’s close above 25790 crucial for bulls’ continuation. The 25700 level remains the guiding line for short-term structure.
🛡 5 Min Intraday Chart with Levels
🛡 Intraday Walk
Opened 38 points negative and tested 25715 zone.
Failed to sustain, slipped to 25645.5 marking day’s low.
Sharp 100+ point recovery to 25761.5 forming IB High.
Multiple fake breakouts above IB High followed by rejections.
Double bottom near 25650–25670 region provided strong bounce.
Final rally tested 25790 resistance; closed at 25774.3 near the high.
📉 Daily Time Frame Chart with Intraday Levels
🕯 Daily Candle Breakdown
Open: 25,696.85
High: 25,803.10
Low: 25,645.50
Close: 25,763.35
Change: +41.25 (+0.16%)
🏗️ Structure Breakdown
Type: Small-bodied bullish candle with wicks on both ends — indecision with mild bullish bias.
Range (High–Low): 157.60 points → moderate volatility.
Body: ≈ 66.50 points → limited directional strength.
Upper Wick: ≈ 39.75 points → rejection near 25,800.
Lower Wick: ≈ 51.35 points → buying support near 25,650.
📚 Interpretation
After two strong bearish days, Nifty managed to hold key supports and stage a mild comeback. Bulls defended the 25,650–25,700 zone well, though momentum above 25,800 remains lacking. The close above open signals buyer re-entry, albeit cautiously — a potential pause before reversal or consolidation.
🕯Candle Type
A Spinning Top, appearing after consecutive bearish sessions — a classic indecision candle often preceding a short-term base or pullback.
🛡 5 Min Intraday Chart
⚔️ Gladiator Strategy Update
ATR: 201.94
IB Range: 116. → Medium
Market Structure: balanced
Trade Highlights:
9:36 – Long Trade → Target Achieved (R:R 1:1.69)
10:43 – Long Trade → SL Hit
11:26 – Short Trade → Trailing SL Hit
📌 What’s Next? / Bias Direction
The short-term trend remains in flux — bulls are attempting to defend their ground, while bears continue rejecting higher zones.
A close above 25790 could confirm short-term strength and push Nifty toward 25880–25940.
If the 25700 level fails, the market may retest 25580–25550 as the next strong demand area.
📌 Support & Resistance Levels
Resistance Zones:
25790
25865 ~ 25880
25920 ~ 25944
Support Zones:
25635 ~ 25615
25585
25550
25510
25460 ~ 25440
💡 Final Thoughts
“Base-building phases test patience — not skill. The disciplined trader sees patterns where others see noise.”
✏️ Disclaimer
This is just my personal viewpoint. Always consult your financial advisor before taking any action.

AUD/NZD poised to take on higher levels!Ahead of tomorrow’s RBA interest rate decision – which is largely expected to hold the cash rate steady at 3.60% – the AUD/NZD continues to power higher, refreshing YTD highs and touching levels not seen since 2022. 1M resistance is seen overhead at NZ$1.1487, closely shadowed by another resistance at NZ$1.1524 (3M). Engulfing said barrier places the currency pair at levels not reached since 2015!
Given the overhead resistance between NZ$1.1524 and NZ$1.1487, traders will likely be cautious about entering long. If price does engulf that level, nevertheless, breakout buying could take hold, targeting a 3M resistance as far north as NZ$1.1736.
Written by the FP Markets Research Team

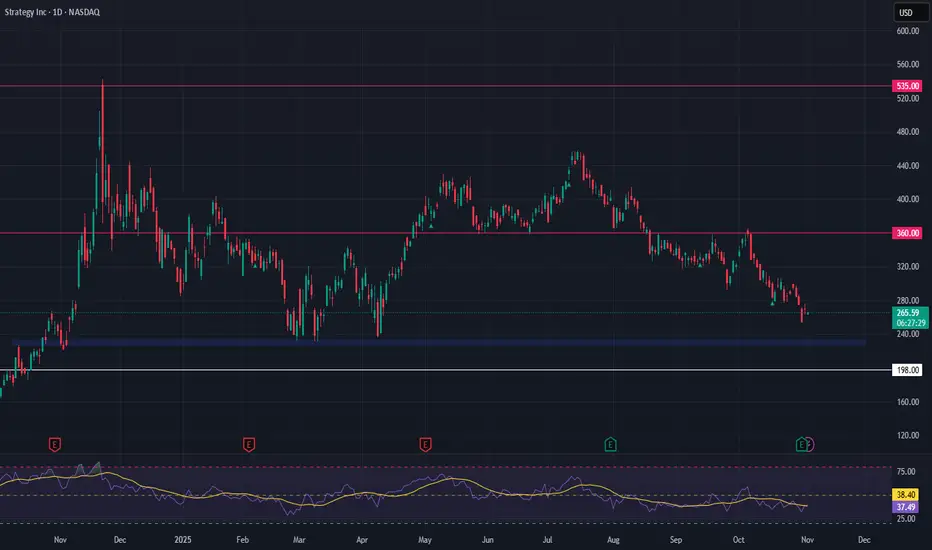
Strategy Inc (MSTR) – High-Beta Bitcoin Proxy at Key SupportStrategy Inc NASDAQ:MSTR has delivered another strong quarterly report, underscoring its continued commitment to aggressive Bitcoin accumulation. With over 158,000 BTC on the books, MSTR has firmly positioned itself as a leveraged proxy for Bitcoin, offering equity traders indirect crypto exposure. This bold balance sheet strategy has also pushed MSTR into alignment with S&P 500 inclusion criteria — a potential catalyst if index inclusion materializes.
Technically, the stock is now retesting a key support zone between $228 and $233. This level has historically held well and may offer a high-conviction entry for those anticipating a BTC rebound. Should Bitcoin aim for new highs, MSTR could respond with outsized upside, though traders must account for the volatility and downside risks that come with crypto-correlated equities.
🎯 Trade Setup:
Entry Zone: $228 – $233
Take Profit Targets: $360 and $535
Stop Loss: $198
This setup offers a high-risk, high-reward opportunity. As always, manage position size carefully and watch BTC price action for confirmation.