BTCUSD SIGNAL UPDATE READ THE CAPTAINBtcusd signal technical analysis satup 👇🏼
( Btcusd ) Buy zone
( TRADE SATUP)
ENTRY POINT (94700) to (94600) 📊
FIRST TP (95100)📊
2ND TARGET (95700) 📊
LAST TARGET (96300) 📊
STOP LOOS (94000)❌
FALLOW RISK MANAGEMENT ✅
Support and Resistance

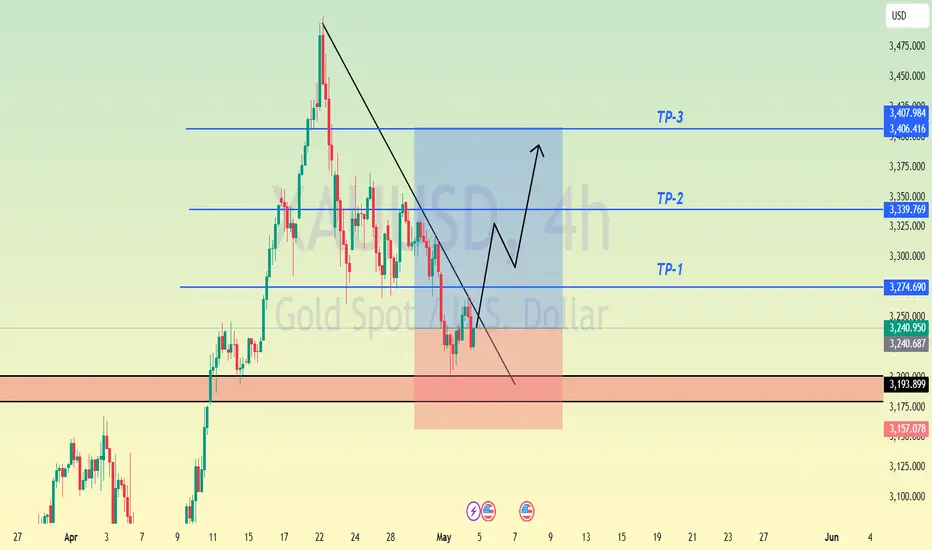
GOLD (XAUUSD): Support & Resistance Analysis For Next Week
Here is my latest structure analysis for Gold.
Resistance 1: 3260 - 3288 area
Resistance 2: 3350 - 3386 area
Resistance 3: 3482 - 3501 area
Support 1: 3191 - 3210 area
Support 2: 3135 - 3167 area
Support 3: 2956 - 2981 area
Consider these structures for pullback/breakout trading.
❤️Please, support my work with like, thank you!❤️
I am part of Trade Nation's Influencer program and receive a monthly fee for using their TradingView charts in my analysis.

DXY:Sharing of the Latest Trading StrategyThis week’s trading wrapped up successfully. Our exclusive VIP trading signals achieved a 90% accuracy rate!👉👉👉
This week, the DXY was quoted at 100.0471. Technically, the index is in a downward channel. Focus on the resistance level of 100.8500. If it breaks through this level, there is a good chance of an upward movement; otherwise, it may test the recent low point. In terms of trading operations, it is recommended to mainly take short positions during rebounds. Trade with a small position size and also pay attention to the changes in economic data and the trade situation.
Trading Strategy:
sell@100.5000-100.2000
TP:99.5000-99.0000
The signals in the Signature have brought about continuous profits, and accurate signals are shared every day. Hurry up and click to get them!
👇 👇 👇 Obtain signals👉👉👉

AUDCAD break resistance line.with the GDP announcement on 30/04/2025, market show the negative result. During the day, it showed that the market is going downward as retail trader might follow the previous market react. However, on friday, trader has follow back the news and buy into the market.

Ethereum is Nearing The Daily TrendHey Traders, in today's trading session we are monitoring ETH/USDT for a selling opportunity around 2,000 zone, Ethereum is trading a downtrend and currently is in a correction phase in which it is approaching the trend at 2,000 support and resistance area.
Trade safe, Joe.

Bitcoin Potential UpsidesHey Traders, in today's trading session we are monitoring Bitcoin for a buying opportunity around 95,000 zone, Bitcoin is trading in an uptrend and currently is in a correction phase in which it is approaching the trend at 95,000 support and resistance area.
Trade safe, Joe.


B3 Aanalysis (12H)The strong bullish move on B3 is turning into a 3D. It could move from the supply zone towards the SWAP zone and then get rejected upwards.
We are looking for buy/long positions in the green zone. Targets are marked on the chart.
A daily candle close below the invalidation level will invalidate this analysis.
For risk management, please don't forget stop loss and capital management
When we reach the first target, save some profit and then change the stop to entry
Comment if you have any questions
Thank You

META watch $545-549: Resistance to End Bounce unless strong BullMETA struggling with anti-trust case and AI spend factors.
Currently up against a key Resistance zone $545.51-549.38
If it dips then watch solo fib at 532.20 or zone 504.44-508.71
.
Previous Analysis calling $489 as possible bottom:
"Genesis Sequence" that has caught every major turn:
===========================================================

TSLA daily trading (option)1. Key Level: TSLA was at a risky spot — it hit resistance and has been moving sideways, with about a 50/50 chance of going up or down.
2. Strategy Triggered: It dropped and then retested the 50 SMA on the H1 chart.
3. Pattern Observed: An uptrend breakdown.
➡️ I think TSLA could go up in the long term (next 1–2 weeks), but we might see a red candle tomorrow or Monday

BTCUSDT:Sharing of the Latest Trading StrategyThis week’s trading wrapped up successfully. Our exclusive VIP trading signals achieved a 90% accuracy rate!👉👉👉
This week, crude oil prices have consecutively closed with bearish candles and declined. On the 4-hour chart, there are four consecutive bearish candles exerting pressure. On Saturday, the OPEC+ convened a meeting ahead of schedule and confirmed the decision to increase production by 411,000 barrels per day in June, which further intensifies the market's concerns about oversupply. It is recommended that for crude oil trading next Monday, short positions should be mainly taken at the resistance level during rebounds.
Trading Strategy:
buy@94500-95500
TP:97500-98500
The signals in the Signature have brought about continuous profits, and accurate signals are shared every day. Hurry up and click to get them!
👇 👇 👇 Obtain signals👉👉👉

GOLD(XAUUSD) -Weekly Forecast,Technical Analysis & Trading IdeasMidterm forecast:
2772.38 is a major support, while this level is not broken, the Midterm wave will be uptrend.
TVC:GOLD OANDA:XAUUSD
Technical analysis:
A trough is formed in daily chart at 2956.50 on 04/07/2025, so more gains to resistance(s) 3357.00, 3500.00 and more heights is expected.
Take Profits:
2833.00
2879.11
2955.00
3057.40
3160.00
3257.03
3357.00
3500.00
__________________________________________________________________
❤️ If you find this helpful and want more FREE forecasts in TradingView,
. . . . . . . . Hit the 'BOOST' button 👍
. . . . . . . . . . . Drop some feedback in the comments below! (e.g., What did you find most useful? How can we improve?)
🙏 Your support is appreciated!
Now, it's your turn!
Be sure to leave a comment; let us know how you see this opportunity and forecast.
Have a successful week,
ForecastCity Support Team

AUDCAD Elliott Wave AnalysisHello friends
On the AUDCAD chart we see the formation of a complete Elliott wave pattern. These waves from 1 to 5 are quite clear and you can even count its sub-waves.
Now wave 5 is forming and wave 5 of 5 is not yet completed.
So we expect the price to grow to the resistance level of 0.9000 and then we will see the price correction.
Good luck and be profitable.

Gold in Daily viewIn Daily Time Frame Gold is in Uptrend way.
First Support has shown on the chart.
Chart will be updated....

CCJ Gets Another Bounce from Key Demand ZoneCameco has bounced from the key demand zone at 32.50–35.50 for the sixth time, further confirming this area as a significant support level. The 200-day moving average also played a major role in the bounce, acting as a magnet. In the last three instances, when the price moved nearly 20% below the 200-day SMA, an upward reaction followed, this time marks the fourth occurrence of the same pattern.
However, NYSE:CCJ continues to face pressure from falling uranium prices, which have been declining for nearly 14 months. While long-term prospects remain positive due to growing investments in nuclear energy, the medium-term outlook remains uncertain. A breakdown below the 32.50–35.50 zone could lead to intensified bearish pressure.
On the upside, the 40.00 and 46.40 levels are key short-term resistance zones that traders should watch.

US100 Locking as Bullish directionUS00 Structure Looking as strong Bullish Pattern,
Forecast from Mr Martin Date 02 May 2025,
US100 Price will looking as buy side recently price will break and catch the support after push to buy side the bullish structure continue to play out the next project would be a clean rally toward the top of the channel US100 is holding its bullish structure well,
Key Level to watch
Resistance level 20,500 / 21,000
Support Levels 19,500
you can find more details in the chart of you find this idea help or learned something new then leave comments Thanks for Regarding.

Gold Will be Bullish from a Historic Support LevelHello Traders
In This Chart GOLD HOURLY Forex Forecast By FOREX PLANET
today Gold analysis 👆
🟢This Chart includes_ (GOLD market update)
🟢What is The Next Opportunity on GOLD Market
🟢how to Enter to the Valid Entry With Assurance Profit
This CHART is For Trader's that Want to Improve Their Technical Analysis Skills and Their Trading By Understanding How To Analyze The Market Using Multiple Timeframes and Understanding The Bigger Picture on the Charts
GBPUSD is in the Selling DirectionHello Traders
In This Chart GBPUSD HOURLY Forex Forecast By FOREX PLANET
today GBPUSD analysis 👆
🟢This Chart includes_ (GBPUSD market update)
🟢What is The Next Opportunity on GBPUSD Market
🟢how to Enter to the Valid Entry With Assurance Profit
This CHART is For Trader's that Want to Improve Their Technical Analysis Skills and Their Trading By Understanding How To Analyze The Market Using Multiple Timeframes and Understanding The Bigger Picture on the Charts

USOIL:Sharing of the Latest Trading StrategyThis week’s trading wrapped up successfully. Our exclusive VIP trading signals achieved a 90% accuracy rate!👉👉👉
This week, crude oil prices have consecutively closed with bearish candles and declined. On the 4-hour chart, there are four consecutive bearish candles exerting pressure. On Saturday, the OPEC+ convened a meeting ahead of schedule and confirmed the decision to increase production by 411,000 barrels per day in June, which further intensifies the market's concerns about oversupply. It is recommended that for crude oil trading next Monday, short positions should be mainly taken at the resistance level during rebounds.
Trading Strategy:
sell@59.5-58.5
TP:57-55
The signals in the Signature have brought about continuous profits, and accurate signals are shared every day. Hurry up and click to get them!
👇 👇 👇 Obtain signals👉👉👉

TEM eyes on $50 round: Key fib and psych level to breakTEM trying to recover along with the general market.
Testing a key fib Zone and psych val $50.01-50.27
Look for break and retest for blue skies above.

NBIS watch $23 below, $24.5 above: Double Fibs defining key zoneNBIS recovering quite well but currently retracing.
Watching double fibs below for support at %23.01-23.03
If we bounce then target will be double at $24.57-24.59

GBPJPY.. PULLBACK[ OANDA:GBPJPY ] is approaching the key resistance zone at .
I'm watching closely for a valid reaction before considering any position.
*** If the level breaks and price retests it successfully, I may consider a counter-directional setup.

BTCUSDT - Key Support Zone Holding StrongPrice has pulled back to a well-defined support zone after a strong upward move and a clear break of structure (BOS). A bullish reaction is visible from the support area, aligning with a potential reversal setup. The chart also highlights a recent retest of the resistance zone (R.S) before this drop. Watching for a continuation toward the upper target if the support holds.
