Bitcoin Price Prediction Trend : Consolidating between $86,000 (support) and $98,000 (resistance)
Key Levels to Watch
Support : $86,000 – Strong demand zone
Resistance : $98,000 – Key supply zone
Possible Scenarios
Breakout Bullish : Above $98,000 → Target $102,000+
Breakdown Bearish : Below $86,000 → Target $82,000 or lower
Most Likely Short-Term Move : Continued sideways movement within the range
Outlook
Short-Term (1–2 Weeks) : Range-bound with potential for breakout
Long-Term (3–6 Months) : Depends on whether price breaks key support/resistance
Support and Resistance

CAT watch $308 above 302 below: Major fibs define range to breakCAT just released Earnings report with small "miss".
Price oscillating between major fibs $301.97-308.82
If Bull, look for a pop to tight zone $325.49-326.16

Riot to 6.84RIOT Platforms, Inc. is showing signs of a potential retracement after a strong rejection from the $8.15–$8.18 resistance zone. The long upper wick and red daily candle suggest sellers are stepping in. Price has re-entered a Fair Value Gap (FVG), and I anticipate that imbalance to get filled.
The $6.84 level is a key support zone from previous structure and coincides with the lower boundary of the last bullish impulse. It’s also where multiple wicks formed on high volume, indicating liquidity and buyer interest.
Trade Setup:
• Entry: $7.83 (current level)
• Target: $6.84
• Stop Loss: $8.35 (above rejection wick)
• Risk/Reward: ~1.5R
Thesis:
Price likely revisits $6.84 to fill the FVG before any bullish continuation.
What Invalidates This Trade:
• A strong daily close above $8.40
• Bullish engulfing candle reclaiming $8.18 with volume
• Bitcoin making a new high and dragging crypto-related stocks up with it
Key Metrics to Monitor:
• Daily volume spike above average on green candles
• Bitcoin spot price above $67,000 (macro correlation)
• RSI breaching 60 with bullish divergence
• Reclaim of 21 EMA on the daily
⸻
Disclaimer:
This is not financial advice. These are my personal opinions and ideas based on chart analysis. I’m not a financial advisor. Always do your own due diligence and consult a licensed professional before making any investment or trading decisions.

BTC - Bullish Momentum To Continue!INDEX:BTCUSD has broken the lower highs and resistance trend line on the daily chart after forming bullish divergence on RSI.
RSI divergence signals reversals and in BTC's case, it has led to the break of lower highs (bullish reversal) and continuation of the overall bullish trend on higher timeframes.
I am expecting BTC to create a higher low around the support zone and continue its upward momentum!

Wajani Investments: Wheat analysisWheat has formed a very strong Head and Shoulder with a bearish wedge or descending triangle . This can be seen from both monthly, weekly and daily timeframes. All these points to lower prices in the weeks ahead. In this market you can risk a 1:3
Remember to always adapt or make changes as the market changes.
Let me know your thoughts.

AUDCAD SHORT Market structure bearish on HTFs DW
Entry at both Daily and Weekly AOi
Weekly Rejection at AOi
Previous Weekly Structure Point
Daily Rejection At AOi
Daily previous Structure point
Around Psychological Level 0.89500
H4 Candlestick rejection
Levels 5.41
Entry 95%
REMEMBER : Trading is a Game Of Probability
: Manage Your Risk
: Be Patient
: Every Moment Is Unique
: Rinse, Wash, Repeat!
: Christ is King.

BANKNIFTYBanknifty levels are based on imbalances
1. gapup 55400 long
2. 55400-55000 trade breakout
3. gapdown 55000 short

UPDATE ON EUR/USD ANALYSISEUR/USD 15M - Afternoon people, I hope you are all well, sorry for my absence this morning. As some of you know I am travelling to Sydney next week and have some things I MUST finish before I fly.
Its also my birthday later on in the week as well, so please bare with me and understand this week and next maybe a little slow. Nevertheless here is an update on the market from yesterdays Sunday Sessions video.
As you can see above price went on to break structure to the upside and delivered us with a perfect opportunity to long the market, I have gone ahead and marked out the hidden order block price came to trade back down and into.
This is where we could have entered in long from this morning, setting our TP just below the last high to guarantee a TP hit and our SL below the zone we got involved in. This opportunity went on to trade 7RR

NIFTYNifty levels are based on imbalances
1. gapup 24625 long
2. 24625-24460 trade breakout
3. gapdown 24460 shorrt

HolderStat | preparing for the May saleThis smart trader withdrew 2.965 CRYPTOCAP:ETH ~$4.9K to Crypto.com—proof this trader is primed to load up on alts. With a lifetime 1832% return over 9 trades this fresh deposit signals full force into the next altcoin rally 🌟

XAUUSD SELL OPPORTUNITY ALERTPrice is rising to a pullback resistance of 3362.61 we’re likely to see sellers momentum kick in around that price level. A sell opportunity is envisaged around the price area of 3351.60 our tarter profit is 3251

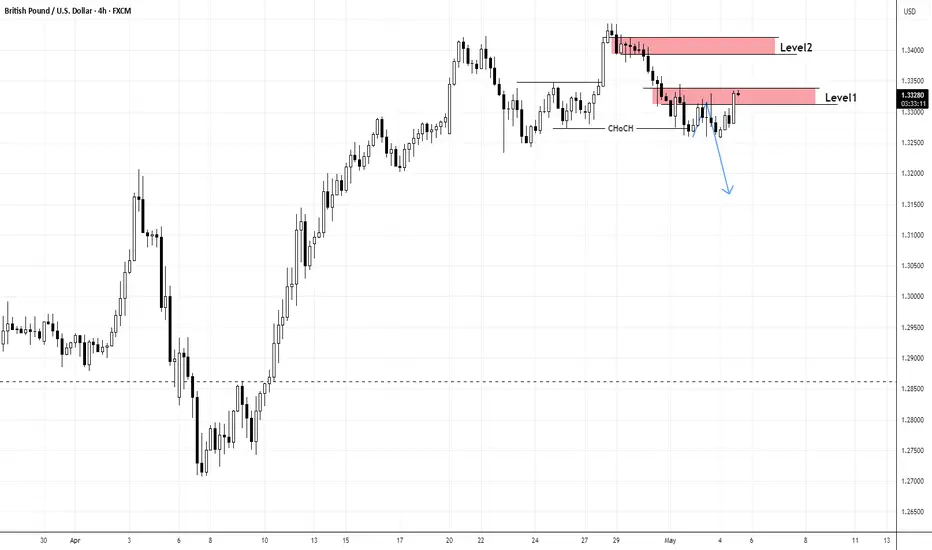
Level 1 Or Level 2, GBPUSD Is Likely Going DownGBPUSD!
N.B!
- GBPUSD price might not follow the drawn lines . Actual price movements may likely differ from the forecast.
- Let emotions and sentiments work for you
- ALWAYS Use Proper Risk Management In Your Trades
#gbpusd
EUR/GBP : Potential Short Opportunity !!Hey guys,
As you can see on the chart, price broke a major support zone and now we’re in the retest phase.
Price is showing bearish intent and could continue lower.
TP 1: 0.84733
TP 2: 0.84457
Not financial advice.

MSTR heads up at $357: Double Fib that may be Strong Resistance MSTR getting a nice boost from the Bitcoin surges.
Nearing a Double Fib that may be strong resistance.
Look for clean Rejection or Break-n-Retest for entry.

Netweb-a breakout stock to watchNetweb has recorded stellar quarterly results- double digit earnings and revenue growth YoY. But stock has not performed since market was unfavorable and it has stored pent up energy of strong earnings backing. Now stock has reached a resistance zone on daily chart that too with a humungous volume. Today its quarterly earnings were announced and yet again stock has delivered very good results. It's a good breakout stock to watch.

TOST eyes on $36.26: Proven Resistance fib that might give Dip TOST is struggling against a minor Genesis fib at $36.26.
If we get a dip then look for Golden Genesis at $33.40
Break out should pop quickly to the next fib at $38.03
=================================================

ORCL watch $151-152: Major Resistance should give a Dip BuyORCL trying to recover with the rest of big tech.
Just hit a major resistance zone at $151.29-152.48
If it dips to fibs below, good support $141.24-141.72

ADSK watch $281-285: Major Resistance zone may give a Dip BuyADSK recovering nicely from the tariff turmoil.
But it has just hit a MAOR resistance zone of two fibs.
Golden Genesis at $285.49 and a Covid fib at $281.53
It is PROBABLE that we get a dip here
It is POSSIBLE to break and retest to GO
If is PLAUSIBLE for a local top for a while.
===============================================

XAUUSD WEEKLY ANALYSIS Hey everyone happy new week…I’m sharing with you my projections this week kinda neutral but if we get a clean breakout of that zone and pullback with a confirmation I will be executing for buys to the last ATH…Let’s see how it goes and if am executing I will also update you guys see ya..

NQ KEY ICT LEVELS - 5th MAY 2025Levels marked on the chart using my free indicator which marks out all of the ICT key levels which can be used for potential POIs where price might react

NQ KEY LEVELS - 5th MAY 2025Key levels marked by using low volume nodes for potential key levels where we may see price react.

Why I'm not holding Tesla Tesla was dropping! I got in at around 220. However, within three weeks, I sold for a small profit.
BUT, why did I sell? This is why I'm not holding NASDAQ:TSLA
It's time to buy!
From a technical and historical point of view, buying Tesla right now makes perfect sense. The stock has a history of making significant price gains, is currently oversold, and is testing key support areas, such as the monthly 50 SMA.
A trader or investor who is 100% technical-based, this stock looks like a dream.
However, all the hype hits the floor when the fundamentals are considered...
Meh...
✔ The company has been increasing sales and cash year-on-year until recently
✔ Tesla has plenty of cash and assets. A simple acid test ratio shows liabilities vs. assets around 1:2.
❌ The issue is profit. Both gross and net profit margins have been falling year-on-year. The net profit margin is down from 15% two years ago to 7% last year.
❌ Worse, the current forecasts predict decreased sales and other key financials.
Poor and worsening financials are a clear red flag when buying stocks. Stay away. No matter how appealing the price looks.
Don't get me wrong, I don't think Tesla is doomed, and it may still yield returns. However, I would not be surprised if the stock consolidates or moves lower from here. For me, Tesla is not the significant buy it once was.

AUDJPY –From Breakdown to Breakout Long Setup After Failed ShortFX:AUDJPY
The short idea was invalidated after price broke above the key resistance zone and hit our stop.
Now, we’re watching for a pullback to the broken zone for a potential long setup, supported by bullish momentum.
Keep it clean. Wait for confirmation.
Stay sharp, stay disciplined.
Smart Forex Analysis | Weekly Setups
Clean charts. No noise. Just levels.
