WTI TRADE IDEAhello everyone
From the previous oil movement, the entry at 58.52 moved up by 80 pips before hitting breakeven. For the upcoming open market, if the trendline and support or resistance break out as shown on the M30 chart, it could signal an opportunity to enter the market.
Ensure strong confirmation before acting, and keep an eye on shifts in market structure.
Thanks a lot for your support & best of luck
**My trading strategy is not intended to be a signal. It's a process of learning about market structure and sharpening my trading my skills also for my trade journal**
Supportandresistanceanalysis

XAUUSD UPDATE : FED INTEREST RATE DECISION hello & happy weekend everyone
For coming week trade forecast. From the left side, the daily chart indicates that a breakout has occurred, and the current increase is a temporary pullback. If a rejection happens at the 0.236 daily retracement and the trendline on 1 hour chart successfully pushes the price downward, I see an opportunity to short towards the upcoming Fed interest rate decision.
And I am very grateful for the support given, especially in some of the previous trades. I hope that my trade plan can help traders identify the direction to enter the market.
good luck all
**My trading strategy is not intended to be a signal. It's a process of learning about market structure and sharpening my trading my skills also for my trade journal**
Thanks a lot for your support

GBP/USD - Potential Bearish Reversal Setup
📉Market Structure:
The pair has been in an uptrend, forming a rising channel. However, price is now facing strong resistance around 1.2936 - 1.3009, showing signs of exhaustion. A potential reversal could be forming.
🔍 Key Levels:
Resistance Zone: 1.2936 - 1.3009
Current Price: 1.2936
Target Support: 1.2208
📊 Trade Idea:
A rejection from the resistance zone could initiate a bearish move.
A confirmed breakdown below 1.2900 may trigger further downside toward the 1.2208 target zone.
Stop-loss placed above the 1.3009 resistance to manage risk.
🚨 Confirmation & Risk Management:
Bearish Confirmation: Rejection from resistance with strong selling momentum.
Invalidation: A breakout above 1.3009, indicating bullish continuation.
Risk Management: Stop-loss at 1.3009 with a favorable risk-to-reward ratio.
This setup suggests a short opportunity if price respects resistance and begins a downward move. Traders should watch for confirmation signals before entering.

USOIL WEEKLY UPDATE hello trader...
I noticed a divergence in the daily oil chart between the rsi and waves 3 and 5. Rsi is still over 50 level in daily chart, which leads me to believe that the uptrend is still in progress.
yet H4 rsi is currently below 50 level. My plan is to short around $93.7 and monitor the RSI daily whether I can stay below the 50 level or any news from us or any oil announcement .
a break above previous high might took oil to next resistance level at $101. so hold you buy.
**I have no intention of using my trading approach as a signal. I'm practicing my trading strategies, learning about market dynamics, and figuring out the best way to enter the market in the right direction.

EURJPY WEEKLY TRADE UPDATEHi
same applies to the eurjpy. I continue to be biased toward the rise despite the sideways market. the closest support level at 156.579, thus a rejection could be a good idea to keep long eur.
**My trading strategy is not intended to be a signal. It's a process of learning about market structure and sharpening my trading my skills also for my trade journal**
Thanks a lot for your support

GBPJPY WEEKLY TRADE UPDATEHi all
I find that the gbp/jpy move in the sideways market has a bias upwards.
Weekly support at level 180.39, and if the price rejects that level, I'm looking for a three-wave uptrend, as the chart shows.
**My trading strategy is not intended to be a signal. It's a process of learning about market structure and sharpening my trading my skills also for my trade journal**
Thanks a lot for your support

USDCAD TRADE IDEAHello traders
I think this is a correction move following a breakthrough of weekly support unless it makes a new high.
*I have no intention of using my trading approach as a signal. I'm practicing my trading strategies, learning about market dynamics, and figuring out the best way to enter the market in the right direction.

XAUUSD TRADE IDEAHi all..
still look for short...
**I have no intention of using my trading approach as a signal. I'm practicing my trading strategies, learning about market dynamics, and figuring out the best way to enter the market in the right direction.

XAUUSD WEEKLY UPDATEhi trader..
Gold is almost to 100 fibo extension. So, either gold is going to climb higher and break the triple top, or it will form an LH wave (6) and continue to form wave (7).
so good luck to all of you and have wonderful weekend
**I have no intention of using my trading approach as a signal. I'm practicing my trading strategies, learning about market dynamics, and figuring out the best way to enter the market in the right direction.

XAUUSD THE BIG WHYHi all
i hope its help retail trader understand the move & direction..
so good luck to u all
*I have no intention of using my trading approach as a signal. I'm practicing my trading strategies, learning about market dynamics, and figuring out the best way to enter the market in the right direction.

COPPER TRADE IDEAhello all
My plan is to buy copper until the resistance level is reached.
*I have no intention of using my trading approach as a signal. I'm practicing my trading strategies, learning about market dynamics, and figuring out the best way to enter the market in the right direction.

XAGUSD WEEKLY UPDATEhello silver trader
silver testing support at level 21.464, I think. A break through that point might lead to the following support level at 21.464.
Silver will likely fall further because of the trendline's breakthrough.
**I have no intention of using my trading approach as a signal. I'm practicing my trading strategies, learning about market dynamics, and figuring out the best way to enter the market in the right direction.

USDX WEEKLY UPDATEHello all
I still believe that the USD has room to go upward. I won't start holding long positions in the xxxusd until the nfp or the cpi in the following month, with the exception of usdjpy.
usdcad more likely neutral, eurusd and gbpusd sideway bias short.
others not under my watch
**I have no intention of using my trading approach as a signal. I'm practicing my trading strategies, learning about market dynamics, and figuring out the best way to enter the market in the right direction.

XAUUSD TRADE IDEAhello
I only intend to enter the market once a trendline has broken and pulled back.
**My trading strategy is not intended to be a signal. It's a process of learning about market structure and sharpening my trading skills**
Thanks a lot for your support

USDX UPDATEHi all
The weekly level has already broken through.
I see a head and shoulders pattern from the structure.
I plan on going short USDX in a short term for correction.
I plan to enter the market with these two levels.
good luck
**My trading strategy is not intended to be a signal. It's a process of learning about market structure and sharpening my trading skills**
Thanks a lot for your support

GBPJPY TRADE IDEAHello reader
I intend to long short-term JPY in ahead of the release of the gbp monetary policy on September 21.
My exit level is the target 100 fibo extension.
**My trading strategy is not intended to be a signal. It's a process of learning about market structure and sharpening my trading skills**
Thanks a lot for your support

EURJPY TRADE IDEAhello everyone
I look for a correction between the the fibonacci retracement of 50 and 61.8.
Today's ECB Monetary Policy Statement makes trading highly risky.
good luck
**My trading strategy is not intended to be a signal. It's a process of learning about market structure and sharpening my trading skills**
Thanks a lot for your support

USOIL TRADE IDEAHi all
I seek two more waves to complete wave 5 and search for long oil.
I only intend to enter the market once a trendline has broken and pulled back.
**My trading strategy is not intended to be a signal. It's a process of learning about market structure and sharpening my trading skills**
Thanks a lot for your support

GBPUSD WEEKLY TRADE IDEAhi
After a strong fall rally, I believe it is time for a correction or a buying dip.
good luck to you guys
**My trading strategy is not intended to be a signal. It's a process of learning about market structure and sharpening my trading skills**
Thanks a lot for your support

XAGUSD TRADE IDEAhello
sideways downward bias on the daily chart
So, I only intend to enter the market once a trendline has broken and pulled back.
**My trading strategy is not intended to be a signal. It's a process of learning about market structure and sharpening my trading skills**
Thanks a lot for your support

EURUSD UPDATEhello
I only intend to enter the market once a trendline has broken and pulled back.
**My trading strategy is not intended to be a signal. It's a process of learning about market structure and sharpening my trading skills**
Thanks a lot for your support

XAUUSD UPDATEhi all
reversal or correction ?
**My trading strategy is not intended to be a signal. It's a process of learning about market structure and sharpening my trading skills**
Thanks a lot for your support

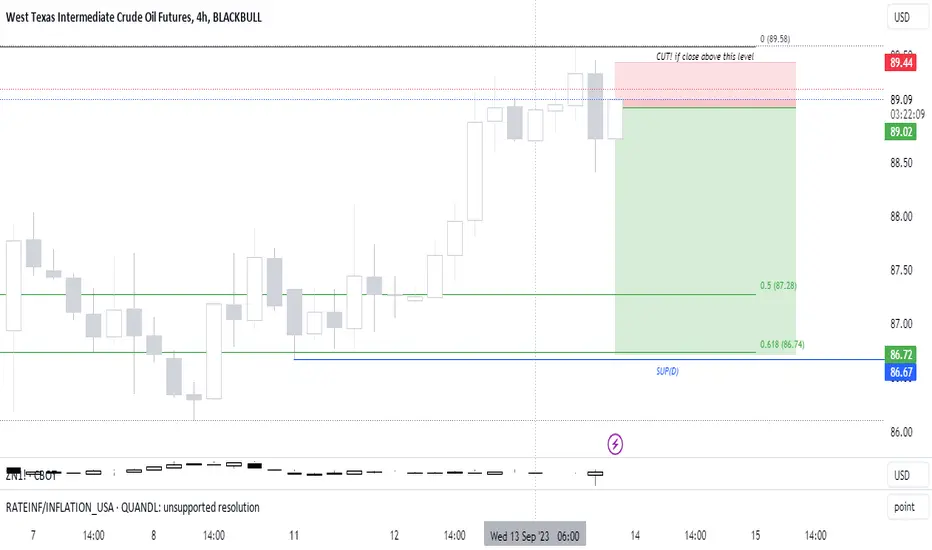
USOIL TRADE IDEAhi all
I'm looking for a pullback at the fibonacci retracement level of 50 to 61.8%.
**My trading strategy is not intended to be a signal. It's a process of learning about market structure and sharpening my trading skills**
Thanks a lot for your support