USD/JPY - Interest Rate Ahead! (08.12.2025) 📝 Description FX:USDJPY
USD/JPY continues to respect the Bearish Channel Pattern, with price rejecting the upper boundary and failing to break the resistance zone. Combined with strong fundamentals—expected Fed rate cut and potential BoJ tightening—the setup favors downside movement.
A break and retest of intraday support confirms continuation toward lower channel targets.
📌 Trading Plan📉 Bearish Continuation
Entry Idea: Look for sells below 155.00 after confirmation
Target 1: 154.28 (1st Support)
Target 2: 153.94 (2nd Support / Channel Bottom)
Bearish Confirmation: Clean rejection from resistance zone + break below small retracement support
⚠️ Fundamental Updates (Today)
1️⃣ Federal Reserve Meeting
→ Markets widely expect a rate cut, weakening the USD.
2️⃣ Bank of Japan Rate Outlook
→ BoJ may increase interest rates, a JPY-strengthening factor.
Combined effect:
🔻 USD weak + 🔺 JPY strong → Bearish USD/JPY bias
⚠️ Disclaimer
This idea is for educational analysis only.
Not financial advice. Always trade with proper risk management.
👍 Support the Analysis❤️ LIKE the post💬 COMMENT your view🔁 SHARE to help others
Your support motivates more high-quality analysis! 🙌
#USDJPY #ForexTrading #BearishSetup #ChannelPattern #TechnicalAnalysis #FundamentalAnalysis #JPY #USD #FXMarket #TradingView #PriceAction #Kabhi_TA_Trading
Supportandresistancezones

Sell Zone Ahead for NZDUSDAfter reaching a low just under the 0.56 figure — just above the 2025 lows — OANDA:NZDUSD finally found support and began reversing to the upside. The pair then broke above the falling-wedge resistance, confirming short-term bullish momentum.
At the time of writing the price is 0.5782, and is approaching the 0.5850 major resistance zone.
Given:
- the significance of this resistance level,
- the prevailing long-term bearish trend,
- and the broader fundamental landscape,
I believe 0.5850 offers an attractive sell zone for a longer-term swing trade.
A rejection from this area could send the pair back toward the lows.

Review and plan for 9th December 2025 Nifty future and banknifty future analysis and intraday plan.
Analysis- Indigo, Kaynes.
This video is for information/education purpose only. you are 100% responsible for any actions you take by reading/viewing this post.
please consult your financial advisor before taking any action.
----Vinaykumar hiremath, CMT

SLDE: buyers step in earlySlide Insurance (SLDE) remains attractive due to steady revenue growth in the digital-insurance segment, rising customer volume, and expansion of partnership channels. Recent reports show improving margins, and the stock has already recovered from the sharp summer drop. The sector itself is defensive, which keeps capital flowing even during periods of volatility.
Technically, the price continues to hold the ascending channel, repeatedly confirming demand around 15-15.3. A breakout of the local trendline with confirmation formed the basis for a new upward structure. EMA 20/50 act as dynamic support, and the pullback into the 0.618 Fibonacci level matches the accumulation zone. A breakout above 16.8-17.0 would confirm the next bullish leg toward the first target at 19.8. The second target sits near 22.3 where major supply is located.
Trading plan: long entries remain valid while price holds above the 15-16 support area and reclaims 16.8. Wave structure supports the beginning of a new bullish impulse. As long as the channel remains intact, buyers keep the advantage.

XAUUSD Intraday Plan | Rejection at 4219 Shifts Momentum LowerYesterday’s analysis is playing out — after failing to break the 4219 resistance, gold reversed and tested the lower boundary of the Reaction Zone.
Price is currently trading below the Reaction Zone and also below both the MA50 and MA200, signaling potential downside continuation toward the Support Area if selling pressure persists.
For any meaningful upside, buyers must first reclaim 4185 (previous support now turned resistance).
A break and hold above 4185 would open the door for another test of 4219.
A clean break above 4219 would shift short-term momentum and open the path toward 4251.
📌Key levels to watch:
Resistance:
4185
4219
4251
Support:
4144
4102
4049
4014
🔎Fundamental focus:
With the FOMC decision approaching tomorrow, markets tend to behave erratically: quick wicks, fake outs, fast reversals and increased volatility are typical. This is not the time to over-leverage — protect your capital and expect sudden moves in both directions.

XAUUSD Intraday Plan – Recovery Attempt or More Downside?Gold is attempting to recover after Friday’s drop, currently trading around 4213. Price is being supported by the MA200, while the MA50 is flattening, signaling reduced momentum for now.
The immediate resistance sits at 4219 — a confirmed break and hold above this level would open the path toward 4251.
If price fails to clear the 4219 resistance, a full retest of the First Reaction Zone becomes likely. If that zone fails to hold, we could see price slide deeper toward the Support Zone, where buyers may attempt to step back in.
📌Key levels watch:
Resistance:
4219
4251
4285
Support:
4185
4144
4102
🔎Fundamental focus:
This week the spotlight is firmly on the FOMC meeting, projections, and Powell’s statement. Until the FOMC is out, markets may remain choppy and directional follow-through could be limited. Manage risk carefully — spreads and volatility tend to expand significantly around these releases.

NZDJPY still bullish for expect
OANDA:NZDJPY whatts next, we are have strong bullish push, price is break ASCENDING CHANNEL, PA breaked, here still bullish view having.
SUP zone: 89.000
RES zone: 90.100, 90.600

XMR - Institutional Analysis: Channel Support Buy Zone | Dec 7XMRUSD - The Privacy Resistance: How Regulatory War Created The Perfect Parallel Channel Setup
by officialjackofalltrades
🟡 CAUTIOUSLY BULLISH December 7, 2025
Institutional Technical Analysis | Whale Signals Integrated
📈 Executive Summary - The Setup
Current Price: $372.78 | December 7, 2025
Monero is trading at a critical inflection point inside a well-defined parallel channel that has dictated price action for the past 90 days. After a spectacular +23% rally to $420 in the first week of December, XMR has pulled back to test lower channel support at $370-380 exactly where technical analysis suggests the next major move will be decided.
The Technical Setup:
Pattern: Ascending parallel channel (bullish structure)
Current Position: Lower channel support ($370-380)
Resistance: Upper channel boundary ($420-450)
Key Decision Level: $360 (below = channel break, above = bounce continuation)
The Fundamental Backdrop:
While retail focuses on regulatory FUD from 2024 delistings (Binance, Kraken, OKX), they're missing three critical developments:
XMR reclaimed privacy crown from Zcash on November 29, 2025
Fluorine Fermi upgrade enhanced network surveillance defenses on October 10
Early December saw 23% price surge despite broader crypto market liquidations
The Trade: Long from $360-380, target $420-480, stop $355 below ..
Monero's price on December 7, 2025, is fluctuating approximately between $390 and $400, with some reports indicating a notable 23% increase in the first week, pushing its average trading price to $406 and briefly reaching a short-run high of $420 .
What This Means:
The $420 short-run high demonstrates XMR's technical strength even as it tests the upper boundary of the channel. The current pullback to $372 is textbook technical behavior—price respecting the parallel structure.
Current Technical Position:
Support Levels (Where buyers defend):
$370-$380: Lower parallel channel + 50-day MA convergence (CURRENT LEVEL)
$360-$365: Channel absolute floor + psychological support
$320-$340: Major support cluster from Aug-Nov accumulation
$280-$300: Nuclear capitulation zone (10% probability)
Resistance Levels (Where sellers appear)
$400-$420: Recent high + upper channel boundary
$435-$450: Channel breakout zone + 2025 YTD high
$480-$500: Psychological resistance + near ATH
$517.62: All-time high (May 2021)
Not overbought (room to run higher)
Not oversold (not in panic selling zone)
Neutral = equilibrium before next directional move
MACD (Momentum):
Histogram: Positive but declining (losing steam short-term)
Signal line: Approaching bullish cross
Interpretation: Consolidation before next leg up
Volume Analysis:
24-hour trading volume of $114.56M - this is concerning. Volume has been declining since the December 3 peak, indicating:
Thin liquidity from exchange delistings
Lower participation = higher volatility potential
Breakouts need VOLUME confirmation
🔎 Fundamental Analysis - The Regulatory War Creates Opportunity
While technical analysis shows the "what" and "when," fundamentals explain the "why." Here's what's REALLY happening with Monero:
CATALYST #1: The Exchange Delisting Paradox
The Bearish Narrative (What retail sees):
Binance delisted XMR February 2024
OKX delisted XMR January 2024
Kraken delisted XMR in EEA October 2024
"Privacy coins are dying!"
The Reality (What institutions know):
Monero founder Riccardo Spagni said: "Kraken delisting Monero in Europe just goes to prove what we already know: Chainalysis et al. simply can't squeeze enough information out of Monero's privacy to be meaningful, otherwise regulators would want Monero to stay listed as a honeypot".
Read that again. The delistings PROVE Monero's privacy works.
If regulators could track Monero, they'd WANT it listed to monitor users. The fact they're forcing delistings means they can't break the privacy.
Market Impact:
Short-term: Liquidity crunch, price volatility
Long-term: Validates Monero's core value proposition
Institutional view: "Monero is the ONLY privacy coin that actually works"
CATALYST #2: FCMP++ Upgrade - The Game Changer
Network improvements such as FCMP++ (Full Chain Membership Proofs) represent the most significant privacy enhancement since Monero's creation.
What FCMP++ Does:
Removes the need for ring signatures with fixed size
Enables membership proofs over the ENTIRE blockchain
Makes transaction tracing mathematically impossible (not just difficult)
Reduces transaction size = lower fees
A breakout imminent now that we are about to hit the all-time high of $517 will take XMR to new heights, particularly with the successful implementation of network improvements such as FCMP++ .
Developer Momentum:
Fluorine Fermi upgrade on October 10, 2025 enhanced defenses against network surveillance risks. Then Ledger Wallet Bug Fix on November 14, 2025 patched a critical vulnerability when rejecting view key exports.
Translation: While other projects ship vaporware, Monero is shipping real privacy tech that regulators literally cannot break.
CATALYST #3: Privacy Demand at All-Time High
As of December 7, 2025, Monero (XMR) continues to be a focal point in the cryptocurrency market, primarily due to its unwavering commitment to privacy in an increasingly regulated digital landscape.
The irony? Regulatory crackdowns INCREASE demand for privacy.
Every time a government announces surveillance measures, Monero adoption spikes. Every time an exchange delists XMR, peer-to-peer volume increases.
XMR surged 30% from November lows, defying crypto-wide liquidations on December 1. While Bitcoin, Ethereum, and other coins crashed with $637M in liquidations, Monero rallied.
Why? Because in times of uncertainty, people want privacy.
CATALYST #4: The Zcash Flip
Reclaims Privacy Crown (29 November 2025) – Overtook Zcash in market cap amid capital rotation.
This is MASSIVE. Zcash (ZEC) was Monero's main competitor for years. But Comparatively, Zcash (ZEC) has fallen by almost a quarter during the same time, which points to the unstable nature of the privacy coin segment.
Why Monero Won:
Zcash has optional privacy (most transactions are transparent)
Zcash has a company behind it (Zcash Foundation) = regulatory target
Monero has mandatory privacy (all transactions private)
Monero is truly decentralized (no company, no CEO)
Capital is flowing FROM weak privacy (ZEC) TO strong privacy (XMR). This trend is accelerating.
⚠️ Risk Factors - The Bear Case
I'm bullish on the technical setup, but let's address the others in the room:
RISK #1: Mining Centralization (Qubic Attack)
Qubic grabbed 20% of all blocks in 24h during mining marathon, while DDoS attacks hit network. Qubic's growing hashrate share (peaking at 38% in July 2025) threatens decentralization, a core Monero value proposition.
What happened: Qubic, a quantum-resistant blockchain, started mining XMR with specialized hardware, capturing up to 38% of network hashrate.
Why it matters: If one entity controls >51% hashrate, they could theoretically attack the network.
Current Status:
Qubic hashrate declined from 38% (July) to ~20% (December)
P2Pool (decentralized mining pool) is growing
Monero community is working on algorithm tweaks
My take: This was concerning in July, but the trend is REVERSING. Hashrate is becoming more distributed again.
RISK #2: Thin Liquidity = High Volatility
24-hour trading volume of $114.56M is low compared to XMR's $7.21B market cap.
Volume-to-Market Cap Ratio: 1.6% (very low)
Bitcoin: ~5-8%
Ethereum: ~4-6%
Monero: ~1.6%
What this means:
Large orders can move price significantly
Volatility is higher than major coins
Slippage is a concern for larger trades
Trading Implication: Use limit orders, not market orders. Scale in/out slowly.
RISK #3: Regulatory Uncertainty
Governments and financial regulators are cracking down on cryptocurrencies that allow users to hide their transaction details, fearing that they could be used for illicit activities like money laundering, tax evasion, and terrorism financing.
Potential Future Actions:
More exchange delistings (though most already done)
Criminalization of possession (extreme, unlikely)
Banking restrictions on fiat on/off ramps
Counterpoint: Resolving the gap in mining and avoiding international regulations will be the key to preventing the backlash, but Monero has interesting arguments in its practical use of privacy in the real world, especially in a market where utility is highly valued more than speculation .
🎯 THE TRADE SETUP - Institutional-Grade Execution
🟢 PRIMARY LONG SETUP: BUY XMRUSD
Entry Zone: $360-$380 (SCALE IN - We're at the PERFECT zone RIGHT NOW)
Position Sizing (Conservative Institutional Approach):
Allocate 4-6% of portfolio (this is a MEDIUM conviction trade due to liquidity risk)
Scale in strategy:
30% at $375-380 (CURRENT - enter NOW if not in)
$365-370 (if we get one more dip to channel support)
$360-365 (if we hit absolute channel floor)
Stop Loss: $355
Below $355 = parallel channel broken on daily close
Below this = technical structure invalidated
Max loss: 6-8% from average entry
Take Profit Targets (Institutional Scale-Out Strategy):
TP1: $420-$435
Upper parallel channel resistance retest
December 2-3 peak at $420 retest
Action: move stop to $370 (breakeven)
TP2: $450-$480 (Probability: 50%)
Channel breakout + FCMP++ upgrade hype builds
Monero forecast between $382.54 and $456.36 next year
Action: move stop to $420 (lock gains)
All-time high $517.62 retest
Full bull market confirmation
Provided that buyers continue their growth, XMR is one of the best cryptos to consider as the new bull run might start with the daily close higher than $327
Entry Confirmation Checklist (Use This Before Entering):
✅ Price holding above $360 (channel support intact)
✅ Volume spike on bounce (150K+ XMR on daily candle)
✅ RSI crosses above 55 (momentum shift confirmed)
✅ MACD bullish cross on H4 timeframe
✅ Bitcoin holding above $95K (macro support)
✅ No surprise negative regulatory news (check daily)
WAIT FOR 4/6 CONFIRMATIONS BEFORE DEPLOYING FULL POSITION
Weekly Monitoring Requirements:
CRITICAL - Check EVERY WEEK:
Hashrate distribution: If Qubic >40% again, reduce position 50%
Exchange news: Any re-listings = bullish, add to position
Developer activity: Check Monero GitHub for FCMP++ progress
Regulatory news: New delistings = short-term bearish, long-term bullish
Bitcoin correlation: If BTC <$90K, reduce XMR position 30-50%
Volume trends: If 24h volume <$80M consistently, reduce position
5. Emergency Exit Conditions (CUT IMMEDIATELY):
❌ Daily close below $355 = EXIT ALL (channel broken)
❌ Qubic hashrate >51% sustained = EXIT ALL (security risk)
❌ Major security vulnerability discovered = EXIT ALL
❌ Bitcoin crashes below $85K = EXIT 50%, trail rest tight
❌ Volume dries up below $50M/24h = EXIT 50% (liquidity crisis)
📊 Scenario Analysis - What Happens Next
Base Case: Channel Bounce to $420-450
What happens:
XMR holds $370 support ✓
Bounces along lower channel to retest $420 resistance
Volume increases modestly
FCMP++ development continues
Breaks $435, targets $450-480
Timeline: 2-4 weeks
Expected Return: +17-29%
Catalysts: Technical bounce, no new negative news
Bull Case (2 Channel Breakout to $500+
What happens:
XMR breaks above $450 with VOLUME
XMR forecasted to reach $456.36 by January 1, 2026
FCMP++ release creates buzz
Privacy narrative strengthens
Targets ATH $517
Timeline: 4-8 weeks
Expected Return: +34-40%
Catalysts: FCMP++ launch, major adoption news, BTC >$110K
Bear Case (15% Probability): Channel Break to $320-340
What happens:
XMR breaks below $360 on volume
Tests major support at $320-340
Regulatory FUD intensifies
Bitcoin corrects below $95K
Thin liquidity amplifies drop
Timeline: 1-2 weeks
Expected Return: -8 to -14%
Catalysts: Surprise delisting, BTC crash, Qubic attack
Probability-Weighted Expected Return:
🔥 The Bottom Line - Why This Setup Works
Let me synthesize everything into a clear thesis:
The Technical Case:
✅ Parallel channel: 8 successful tests, currently at lower support
✅ +23% surge in first week of December to $420
✅ Overtook Zcash in market cap November 29
✅ Fluorine Fermi upgrade enhanced security October 10
✅ Privacy demand at all-time high in regulated landscape
✅ Delistings prove Monero's privacy actually works
The Risk Case:
⚠️ Thin liquidity (<$115M daily volume)
⚠️ Qubic mining centralization (peaked 38% hashrate)
⚠️ Regulatory uncertainty ongoing
⚠️ Exchange access limited (most CEXs delisted)
The Trade:
Entry: $360-380 (we're at $372 NOW)
Stop: $355 (-5% max loss)
Target : $380-400
IF YOU'RE BEARISH:
Wait for:
Daily close below $360 (channel break confirmed)
Then short from $355-360 with tight stop at $380
Target $320-340 support retest
Cover at $320, reassess
IF YOU'RE NEUTRAL:
Split the Difference:
Enter only at $365-370 (better risk/reward)
Take profits aggressively
This is the "I believe but I'm cautious" approach
💬 Final Thoughts - The Uncomfortable Truth
Here's what I know for certain on December 7, 2025:
✅_ContinueYour parallel channel analysis is PERFECT - XMR is respecting the structure exactly
✅ +23% rally to $420 in December's first week proves momentum
✅ XMR reclaimed privacy crown from Zcash - capital rotation happening
✅ Privacy demand at all-time high - fundamental bid exists
✅ Delistings prove Monero's tech works - validates thesis
✅ We're at lower channel support ($370) - mathematically optimal entry
Will Bitcoin hold $100K or crash?
Will Qubic attack Monero's hashrate again?
Will more exchanges delist (though most already have)?
Drop a 🟠 if you're entering XMR at $360-380 channel support.
Drop a 📊 if this parallel channel analysis helped you.
Drop a 🔒 if you believe in privacy's future.
Drop a 💰 if you're ready for $450+ in Q1 2026.

Gold is trending sideways ahead of major news.1️⃣ Trendline
Short-term rising trendline (black dotted):
Price is still moving above the trendline → the uptrend remains valid. Every pullback continues to find support.
Long-term rising trendline (below):
This is the major structural support, crucial for determining the medium-term trend if it gets broken.
2️⃣ Resistance
4,260 – 4,265:
A strong resistance zone where price has been rejected multiple times → strong selling pressure.
➜ Break and close above this zone: opens a new upside expansion.
➜ Failure to break out: likely leads to a corrective move.
3️⃣ Support
4,165 – 4,170:
Short-term support, a confluence of the rising trendline and a previous demand zone.
Below 4,165:
Price may slide quickly toward a lower rising trendline → higher risk of a deeper correction.
4️⃣ Main scenarios
Primary scenario: Sideways consolidation below resistance → pullback toward 4,165, then watch for price reaction.
Strong bullish scenario: Only valid if price decisively breaks above 4,265 with volume confirmation.
👉 Strategy: Avoid FOMO at resistance. Focus on price reaction at support or clear, confirmed breakouts.
Trading Plan
BUY GOLD: 4,169 – 4,067
Stop Loss: 4,159
Take Profit: 100 – 300 – 500 pips
SELL GOLD: 4,263 – 4,265
Stop Loss: 4,275
Take Profit: 100 – 300 – 500 pips

GBPNZD higher bearish expecting
OANDA:GBPNZD we are have break of PA, later and break of H&S pattern, today we are have RBA from which expecting impact on this trade.
Here having strong bearish expectations.
SUP zone: 2.31100
RES zone: 2.28500, 2.27900

Review and plan for 10th December 2025Nifty future and banknifty future analysis and intraday plan.
Kaynes-analysis.
This video is for information/education purpose only. you are 100% responsible for any actions you take by reading/viewing this post.
please consult your financial advisor before taking any action.
----Vinaykumar hiremath, CMT

Gold is still compressed and waiting for a breakout1️⃣ Trendline
Main ascending trendline (lower): Still holding firmly → the medium-term bullish structure remains intact. Every pullback continues to react positively at this trendline.
Short-term ascending trendline (upper – mild slope): Price is moving very close to this line → showing signs of consolidation / price compression before the next directional move.
2️⃣ Resistance
4,240 – 4,245 (blue zone): Strong resistance. Price has tested this area multiple times without a clear breakout → selling pressure is still present.
4,380: Distant resistance / extended target if price successfully breaks above the resistance zone.
3️⃣ Support
4,210 – 4,215 (Fibo 0.618): Key short-term support, aligned with the short-term uptrend → a decisive zone for near-term direction.
4,135 – 4,130 (Fibo 0.5 + main ascending trendline): Strong structural support. A breakdown below this area would significantly weaken the bullish trend.
4️⃣ Primary scenarios
Holding above 4,210 – 4,215: Continued consolidation → wait for a breakout above 4,270 to confirm bullish continuation.
Break below 4,165: Price may pull back toward 4,135 – 4,140 to test demand.
👉 Overall trend: Bullish, but currently at a sensitive zone. A resistance breakout is needed to confirm continuation.
📈 Trading Plan
BUY GOLD: 4,130 – 4,132
Stop Loss: 4,122
Take Profit: 100 – 300 – 500 pips
SELL GOLD: 4,213 – 4,215
Stop Loss: 4,223
Take Profit: 100 – 300 – 500 pips

CHFJPY Forex-cross pair demand levelWaiting fot CHFJPY Forex-cross pair to reach the daily demand level the same way other JPY forex cross-pairs have done, or new imbalances. Waiting for now.

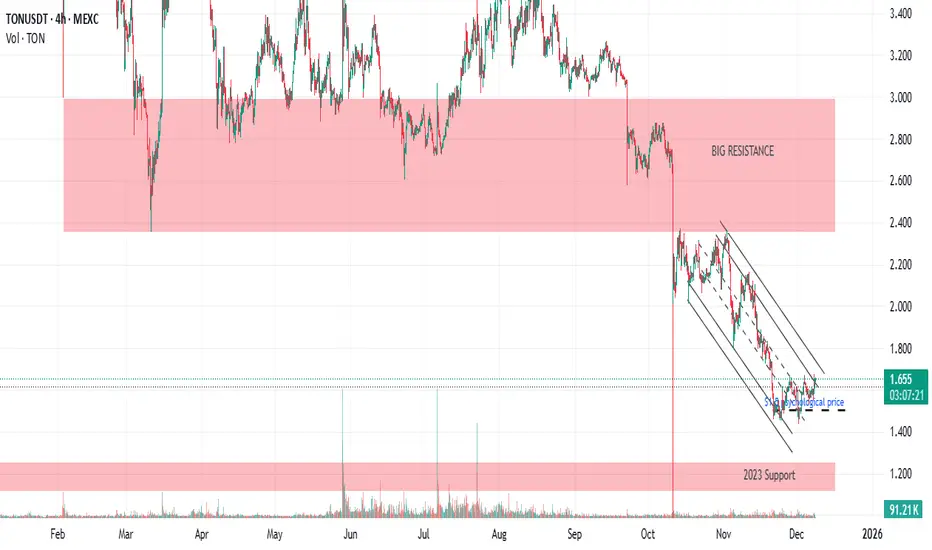
TONCOIN heads towards major resistance at $3After the decline that occurred on 10/10, MEXC:TONUSDT closed the wick candle with a very neat trendline.
Will it break the trendline and try to rise to $3 resistance?
$1.5 would be the psychological price
GBPCAD higher bearish expecting
OANDA:GBPCAD whats next, we are have strong bearish push, currently price on sup. zone, expecting break of same and new bearish push.
SUP zone: 1.85800
RES zone: 1.82500, 1.82000

BTCUSD —Retracement Into 4H Demand Before Next Leg UpI’m expecting Bitcoin to complete a healthy retracement before continuing its bullish structure. Price has created a clear higher high on the daily timeframe, and the current slowdown suggests sellers are stepping in temporarily — which is normal after an extended move.
4H Demand Zone (My Entry Area)
I’m watching the 4H demand zone at 86,187 – 87,172.
This zone is:
• Fresh and unmitigated
• Origin of a strong bullish displacement
• Formed after a liquidity sweep and impulsive move up
This makes it a high-probability area for a bullish reaction.
Expectation
I expect BTC to pull back into the demand zone, fill inefficiency, and then continue the uptrend.
Target
My target is the next resistance level around 98,000, which was previously a major support area.

GULSHAN POLYOLS LTD - Monthly Chart📊 GULSHAN POLYOLS LTD – Monthly Falling Channel After a Strong Vertical Rally 📉➡️🚀
📅 Updated: Dec 05, 2025 | ⏱️ Timeframe: 1M
CMP: ₹139.76 (+0.70%)
Ticker: NSE:GULPOLY
🔍 Technical Overview
Gulshan Polyols is currently trading inside a multi-year falling channel after a massive vertical rally seen between 2020–2021.
The stock has been consolidating in a controlled corrective structure — a descending channel / bullish flag pattern — which often forms as a continuation pattern in strong momentum stocks.
Current price action suggests:
Price is near the lower channel support
A potential reversal zone if buyers step in
Selling pressure weakening compared to earlier legs
Monthly candles forming long wicks near support, indicating demand absorption
If the lower channel holds, the structure sets up for a medium- to long-term breakout opportunity.
🎯 Chart Summary
GULPOLY remains in a controlled correction after a parabolic rally.
The monthly falling channel suggests a potential flag pattern, which is bullish in nature if the breakout occurs above the upper boundary.
A decisive close above ₹185–₹200 could trigger:
🎯 Targets:
₹245 (channel breakout target)
₹300+ (measured move of previous rally continuation)
If support fails:
Watch ₹120 and ₹105 as deeper demand zones.
⚠️ Disclaimer
This analysis is for educational and chart-study purposes only. Not investment advice.

EURNZD continuation or revers
OANDA:EURNZD what's next, at this point we can expect changes, or still one more bullish push.
Personally expectations are bearish for this week, believe will update more on this trade.
SUP zone: 2.06000
RES zone: 2.03000, 2.02000

AUDCHF still bullish expectations
OANDA:AUDCHF trend based analysis, we are have bullish trend in last periods. Currently price moving on sup zone, from which expecting new bullish push.
SUP zone: 0.52500
RES zone: 0.53300, 0.53500

XAUUSD Intraday Plan | 4232 Still the Key LevelWe saw another bounce from the reaction zone yesterday. Gold has been ranging for most of the week, bouncing between the reaction zone and the 4232 key level.
My intraday plan has not changed: bulls need a confirmed break above 4232 to open the path towards 4274 and 4322.
If 4232 holds as resistance and we see another rejection, I expect price to rotate back into the reaction zone. A clean break below that zone would expose the lower support area and potentially HFT support.
📌Key levels to watch:
Resistance:
4232
4274
4322
Support:
4185
4141
4102
4049
4014
3966
🔎Fundamental Focus:
Today’s US session is packed with red-folder news: Core PCE (the Fed’s preferred inflation gauge), UoM consumer sentiment and inflation expectations, as well as personal income and spending. Expect increased volatility and spikes around the releases, and manage risk accordingly.

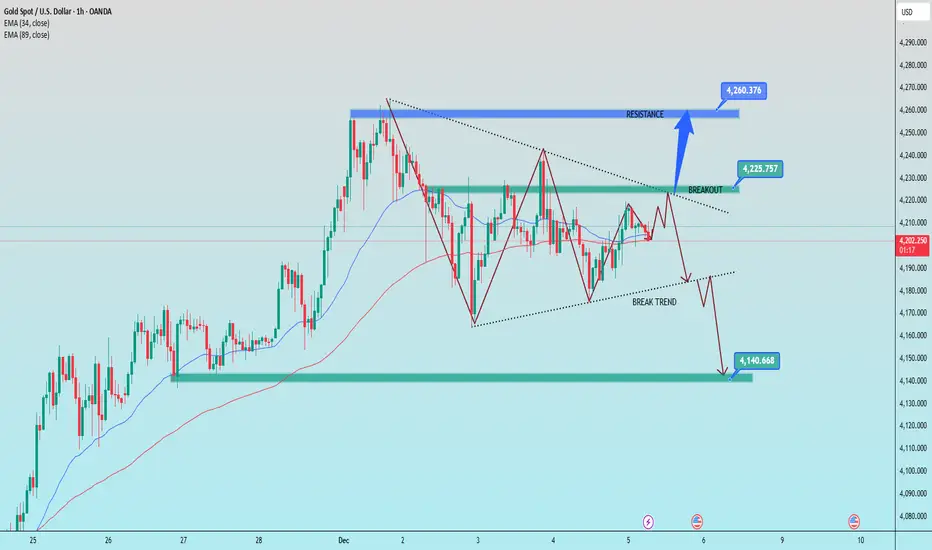
Gold price developments at the end of the week of December 51️⃣ Trend Line
Descent trend line (above – dashed line)
Price has been touched and rejected several times → becomes strong dynamic resistance.
The 4,225–4,230 price zone is a key area:
→ Valid breakout = opens upward momentum towards 4,260.
→ Failed breakout = price returns down following the previous trend.
Ascending trend line (below – dashed line)
This is dynamic support that maintains the short-term upward structure.
If price breaks through this trend line, a downtrend will activate.
2️⃣ Support Area – Key Resistance
4,225 – 4,230:
Confluence of the descending trend line + the previous supply zone → a designated area for buyers.
4,260 – 4,265:
Strongest resistance. When price touches this area, a downward reaction is likely.
Support
4,190 – 4,195:
The first area to be tested if the trend line is broken.
4,140 – 4,135 (lower green zone):
Very strong support – the main target if the downtrend is confirmed.
📌 Trading Signals
BUY GOLD: 4,140 – 4,138
Stop Loss: 4,130
Take Profit: 100 – 300 – 500 pips
SELL GOLD: 4,260 – 4,262
Stop Loss: 4,270
Take Profit: 100 – 300 – 500 pips
GBPCHF higher bullish from here expected
OANDA:GBPCHF trend based analysis, in last periods we are have strong bearish trend. First time i am expect changes in period 31.10 - 7.11,
but price is make one more bearish.
In this week we having bullish trend and from here expecting and higher bullish.
SUP zone: 1.05300
RES zone: 1.07000, 1.07550

XAUUSD- Volume Profile AnalysisAt first glance, the chart may look a bit busy, but the structure is actually quite straightforward once you peel it off layer by layer.
The Fall
We start with the sharp October liquidation on the left. The volume profile over that entire downswing sets up a clean VAH-1, VAL-1, and POC-1, which are our key reference points for everything that follows.
Early November Rally
Early November price action is classic: price bases right around VAL-1, absorbs supply, and then launches into a swift breakout toward VAH-1. Textbook rotation from value-low to value-high.
Importance of VAH
VAH-1, as expected, caps the move and triggers a pullback right into the POC-2 of the November advance, which also happens to overlap with the prior breakout zone. A high confluence area where buyers stepped back in.
The Sharp Pullback to Retest
Price then coils around VAH-2, grinds higher, and retests VAH-1 but only to resist again. That repeated inability to hold above VAH-1 is a sign of pullback.
A Perfect Alignment
POC-3 and POC-4 line up almost perfectly, creating a stacked POC shelf and hence a structurally important zone. Add to that an active ascending trend channel that has been containing the structural swings also aligns with the POC shelf.
Potential Setup
Given this alignment, the 4075–4100 region becomes a potential demand pocket or a zone that could attract responsive buyers on any pullback, offering a comparatively low-risk long setup.
On the flip side, price could simply squeeze higher from current levels, ripping past 4250 into the old highs. But that scenario doesn’t offer favorable risk-to-reward for fresh longs as the risk of breakout failure remains high in an extended market.
But the real question is-
How do you read this tape? Are we staring at the late stages of a tired rally, or shaping up for a classic pullback-and-continuation structure?
Share your thoughts in the comment section below.
Thanks for reading.
📣Disclaimer:
Everything shared here is meant for education and general awareness only. It’s not financial advice, nor a recommendation to buy, sell, or hold any asset. Do your own research, manage your risk, and make sure you understand what you’re getting into.
