SXP/USDTSXP is now retesting the resistance of 3.9 - 4.1 area. So far SXP unable to close a candle above the resistance area and the long wicks showing selling pressure. Wait for a candle close above this resistance level. The support is 3.45 - 3.55 and this is good buy zone for SXP. Wait for a breakout or a retest of support zone.
SXP


SXP IS WILLING TO TAKE A SWIPE AT 6SXP is visibly climbing a trend line. It has been respected a few times. MACD is showing divergence in the positive zone. In fact, SXP has stood its ground although the market is shaky right now. We might see a retracement, but it will be a step backwards to leap upwards. RSI is cruising around in the overbought zone, so a minor retracement is not out of the ordinary. Volume is not sufficient, TBH, as it is with most altcoins. Tread cautiously!

SXP/USDT BULLISH PATTERNSXP / USDT created us bullish pattren "FALLING WEDGE" I expect movement to the fibonation level 0.618

SXP >$50 IMMINENTAnyone see this beautiful ascending triangle playing out? Taking the measured move of the base of the triangle to the resistance, we see a huge power move crushing to my new target. Tokenomics, infrastructure, and fundamentals of this coin support this move.
Any thoughts? would love the discussion.

szp to moon use fib as stoploss . buy more from the support red support zone . if it pass the yellow resistance zone . then change the stoploss to that yellow box .

SXP 1D Pattern "Cup with handle" and growth target $60On the fall in May, SXPUSDT buyers showed once again that they are not planning to let the price go below $1.30. By the end of July, the price of SXPUSD once again dropped to a strong mirror level of $1.30 , from which buyers began to drive the price up. SXPUSDT price growth at the moment shows more than +100%
If we look at the SXPUSD chart globally, we can assume that the "Cup with a handle" pattern is being forming now.
For the full completion of the formation of the "Cup with a handle" pattern, the SXP price needs to rise to the area of $5.50.
Well, when the pattern will be formed , and a positive attitude prevails on the crypto market itself, then we will need to fasten your seat belts)
Since the path will open for growth first to $10-11.
Further correction and continued growth to $25 .
And the icing on the cake can be " $60 for the SXP ", as the final global TP of working out the "Cup with a handle" pattern.
Eh, dreams — dreams :)
What do you think about such a scenario? Write in the comments!
_______________________________
Since 2016 , we have been analyzing and trading the cryptocurrency market.
We transform our knowledge, trading moods and experience into ideas. Each "like under the idea" boosts the level of our happiness by 0.05% . If we help you to be calmer and richer — help us to be happier :)

🆓Swipe (SXP) Aug-26 #SXP $SXPThe buying power of SXP is very strong and it can continue to rise to the $5 and $6 zones this September. But if it loses the $3.5 zone, it will correct to the $3 or even $2.5 zone
📈BUY
🔴Buy : 3.42-3.58$. SL if B
📉SELL
🔴Sell : 4.88-5.12$. SL if A
🔴Sell : 5.85-6.15$. SL if A
♻️BACK-UP
🔵Sell : 3.42-3.58$ if B. SL if A
🔵Buy : 2.93-3.07$. SL if B
🔵Buy : 2.44-2.56$. SL if B
❓Details
🕯Timeframe : 1 Day
📈Red Arrow : Main Direction as BUY and SELL section
📉Blue Arrow : Back-Up Direction as BACK-UP section
🟩Green zone : Support zone as BUY section
🟥Red zone : Resistance zone as SELL section
🅰️A : The Close price of candlestick is Above the zone
🅱️B : The Close price of candlestick is Below the zone

SXP wil be 4,8001111111111111111111111111111111111111111111111111111111111111111111111111111111111111111111111111111111111111111111111111111111

Swipe (SXP) formed bullish Cypher for upto 23% moveHi dear friends, hope you are well and welcome to the new trade setup of Swipe ( SXP ).
On a 4-hour chart, the price action of SXP has formed a bullish Cypher pattern:

fundamental is do well in SXPfundamental is do well in sxp and we can expect a Price correction. actually if fundamental good news is continuous then SXP goes to moon :D.

SXP looks also strongYOUR LIKE OR COMMENT IS MY FUEL FOR NEXT ANALYSIS :) IF U HAVE ANY QUESTION REACH ME HERE
This is not a financial advice. Always do your own research and always put stoploss in your trade (SL) :) If you want more detailed info how to study and read charts or just need help with some coin, just write to me here a comment, i will try to answer to everybody... i can help you :) all for free, don't worry, BE HAPPY!

$SXPSXP looking good MA's wise, but also patterns-wise.
Personally targeting 20$ according to fibs.
Below some examples of why I'm bullish on SXP, besides the fact that it has an actual use case and CZ has a stake in it.

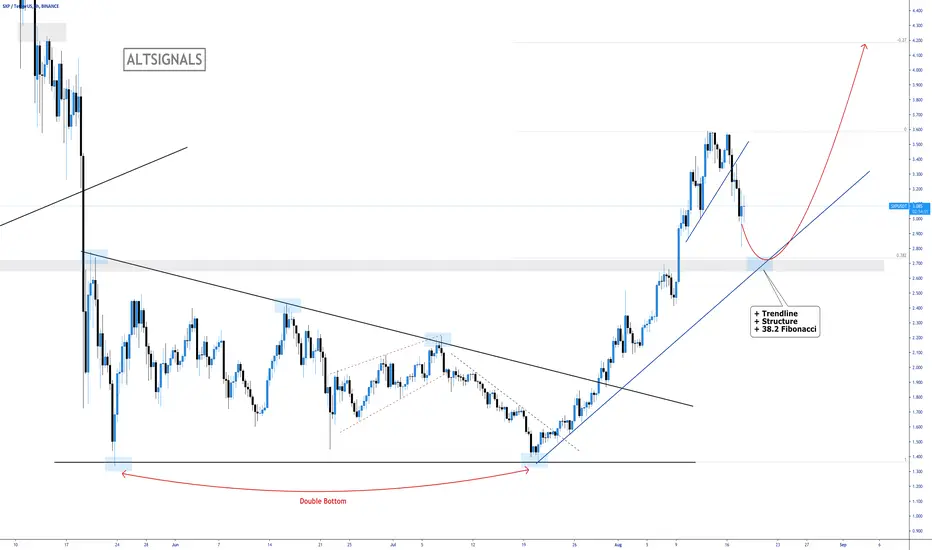
SXP - Retest Bounce! 🏀SXP was in an ascending correction and broke down nicely. We are approaching a very high probability area where we can look to buy $2.70.
We have the ascending trendline, structure and fibonacci support at that price. Watch for a bounce and then enter with stops below the trendline and structure. Targeting the -27 fibonacci.
SXP ab=cd#SXPUSDT
$SXP closed above support zone which is between 0.382 and 0.5 fib level of BC.
it is possible to continue its uptrend to $4 and $4.5 from here.
and if follow AB=CD pattern price can touch $7

SXPUSDTHello to you all. Mars Signals team wishes you high profits at all times.
We are in a 4-hour time frame. As you can see, the price is fluctuating above the support line. We have identified a support line for you, and if the price fluctuates above the line, it can continue to climb. And in case of breaking the resistance line and stabilizing above the line, we can enter the trade for the above goal, but if it penetrates and stabilizes below the support line, we consider falling to the next support line.
Warning: This is just a suggestion to you and we do not guarantee profits.
Wish you luck!

sxp usdtsxp usdt forming ascending triangle. breaout point is 3.588 and the 1st tp will be 3.95. if it break down the patrren then its invalid

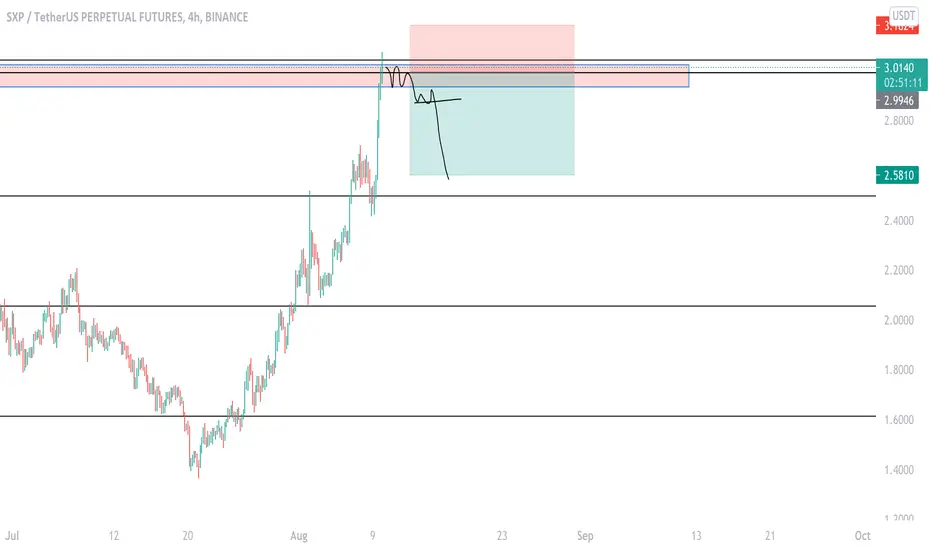
$SXPSXP has gained massively lately and see where it has landed. Right into the monthly, weekly and daily resistance area. I don't rule it out squeezing higher but the risk-reward is good enough for me to enter a trade. Ofcourse the problem with buying wicks is that you don't get a confirmation on a breakdown but it's more suited to my risk profile. Therefore if you wanna play it safe wait for a break below and retest of the red resistance area and then short. Inversely a break above this red area would be a long into the green box.
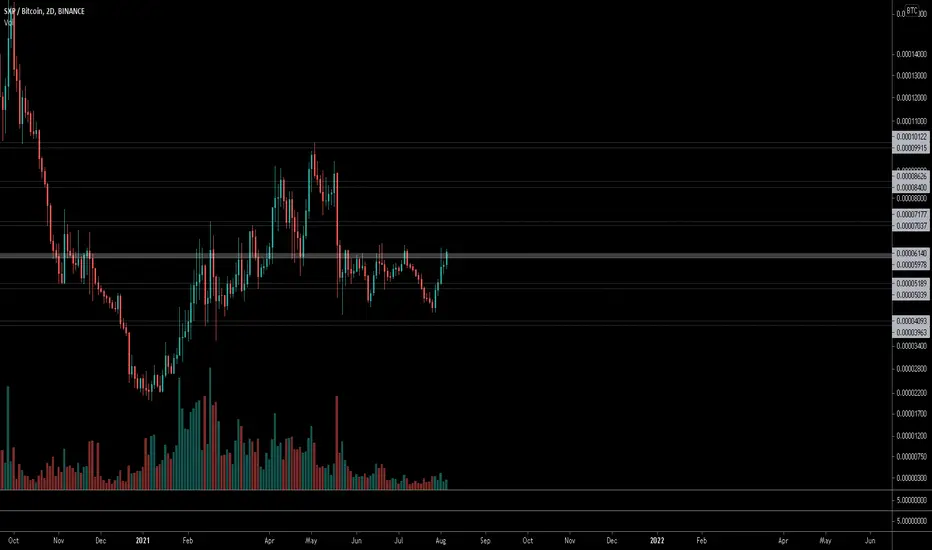
$SXP, trying to break range-highs...$SXP
Similar to BTC, trying to break range-highs where it has been bouncing since May..
UCTS indicator turning bullish across multiple timeframes 1D/2D (and lower)
From here, looking for a breakout/volume above ~6200 sats as signal of continuation
#SXP
SXP/USDT moved toward our prediction and target. what's Next?Hi every one
SXP / TETHERUS
(UPDATE)
this is an update on the recent analysis of SXP/USDT which now you can see that the price has moved in the direction we predicted! the price has 3 bearish signs right now:
1-the price has touched the top of the broadening wedge pattern and Decreased from that point!
2- a shark pattern is pretty visible on the chart which has just been completed and now it's time for correction.the correction can be up to 0.618 or 0.78 line of Fibonacci retracement (strong support zone)
3- there is a regular bearish Divergence on MACD as well (-RD)
so these signs makes us think that the price must start to decrease from this point. the correction can be up to 1.6 or even the bottom of the broadening wedge. there is a slight chance that SXP would break the broadening wedge if it happens the price can increase to 3$ which is a Pretty strong resistance as well.
summery:
-SXP/USDT has moved in the direction of our prediction and touched our target!
-Multiple bearish pattern and signs!
strong support at 1.60$
-slight bullish chance to 3$
Previous Analysis:
💎Traders, if you liked this idea or have your opinion on it, write in the comments, We will be glad.
Thank you for seeing idea .
Have a nice day and Good luck

SXP with strong bullish trend on 4h“The trend is your friend” is one of the best known sayings, although it’s message is incomplete. The full version should be, “The trend is your friend, until the end when it bends.”
SXP is moving bullish above trendline, my first target is $3.4 and after that $4.48. SL if it falls under trendline.

SXP Possible move's in midtermSXP breaks a long downtrend and if the price stabilizes can move upwards towards the targets.
Currently, due to the increase in the bitcoin range and its movements, all altcoins will be affected by it. The analysis is just a series of probabilities.
I hope you find this analysis useful🌹
Follow for more...
#DYOR
