BNB / USDT 4H INTERVAL, STOPLOSS AND TARGETSHello everyone, let's take a look at the 4H BNB to USDT chart as you can see the price is moving above the local downtrend line.
Let's start by setting goals for the near future that we can consider:
T1 - $ 309
T2 - $ 317
T3 - $ 323
T4 - $ 329
and
T5 - $ 338
Now let's move on to the stop loss in case of further market declines:
SL1 - $ 289
SL2 - $ 274
SL3 - $ 262
and
SL4 - $ 250
Looking at the CHOP indicator, we can see that in the 4H interval, most of the energy was used, and the MACD indicator shows a local upward trend.
Targets

CRO / USDT 4H Interval- Targets and StoplossHello everyone, let's take a look at the 4H CRO to USDT chart as you can see the price has returned to our downtrend channel.
Let's start by setting goals for the near future that we can consider:
T1 - $ 0.106
T2 - $ 0.115
T3 - $ 0.123
T4 - $ 0.129
and
T5 - $ 0.139
Now let's move on to the stop loss in case of further market declines:
SL1 - $ 0.087
SL2 - $ 0.075
and
SL3 - $ 0.061
Looking at the CHOP indicator, we can see that in the 4H range the energy has been exhausted, while the MACD indicator shows a local downward trend.

UNIUSDT 1D Interval- Targets and StoplossPlease take a brief overview of the UNI versus USDT chart for 1 day.
All information is included in the chart.

AVAXUSDT 1D TARGETS and STOPLOSSHello everyone, let's take a look at the 1D AVAX to USDT chart as you can see the price is moving above the local uptrend line.
Let's start by setting goals for the near future that we can consider:
T1 - $ 18.74
T2 - $ 21.01
T3 - $ 23.32
T4 - 25.35
and
T5 - $ 28.14
Now let's move on to the stop loss in case of further market declines:
SL1 - $ 16.53
SL2 - $ 14.14
SL3 - $ 12.22
SL4 - $ 10.16
and
SL5 - $ 7.43
Looking at the CHOP indicator, we can see that in the 1D range the energy has increased significantly, and the MACD indicator shows a downward trend.

SOL - USDT 4HChart, targets and stoplossHello everyone, let's take a look at the 4H SOL to USDT chart as you can see the price is moving above the local uptrend line.
Let's start by setting goals for the near future that we can consider:
T1 - $ 34.91
T2 - $ 35.64
T3 - $ 36.26
T4 - $ 36.83
and
T5 - $ 37.69
Now let's move on to the stop loss in case of further market declines:
SL1 - $ 33.78
SL2 - $ 32.38
and
SL3 - $ 30.66
Looking at the CHOP indicator, we can see that in the 4H range the energy slowly starts to rise, while the MACD indicator shows a local downward trend.

LTCUSDT 1D Interval - Targets and StoplossHello everyone, let's take a look at the 1D LTC vs. USDT chart as you can see we managed to come out of the first trend and we are currently moving above the local uptrend line.
Let's start by setting goals for the near future that we can consider:
T1- $ 76
T2- $ 87
T3- $ 98
T4-114 $
and
T5-134 $
Now let's move on to the stop loss in case of further market declines:
SL1- $ 65
SL2- $ 60
SL3-56 $
SL4-52 $
and
SL5- $ 47
Looking at the CHOP indicator, we can see that in the 1D range the energy has been used, while the MACD indicator shows an upward trend.

UNIUSDT 4H Interval- Targets and StoplossHello everyone, let's take a look at the 4H UNI to USDT chart as you can see the price is moving in the uptrend channel.
Let's start by setting goals for the near future that we can consider:
T1 = $ 7.20
T2 = $ 7.28
T3 = $ 7.35
T4 = $ 7.42
and
T5 = $ 7.52
Now let's move on to the stop loss in case of further market declines:
SL1 = $ 7.10
SL2 = $ 7.03
SL3 = $ 6.92
and
SL4 = $ 6.78
Looking at the CHOP indicator, we can see that in the 4H range we have a lot of energy, while the MACD indicator shows a local upward trend.

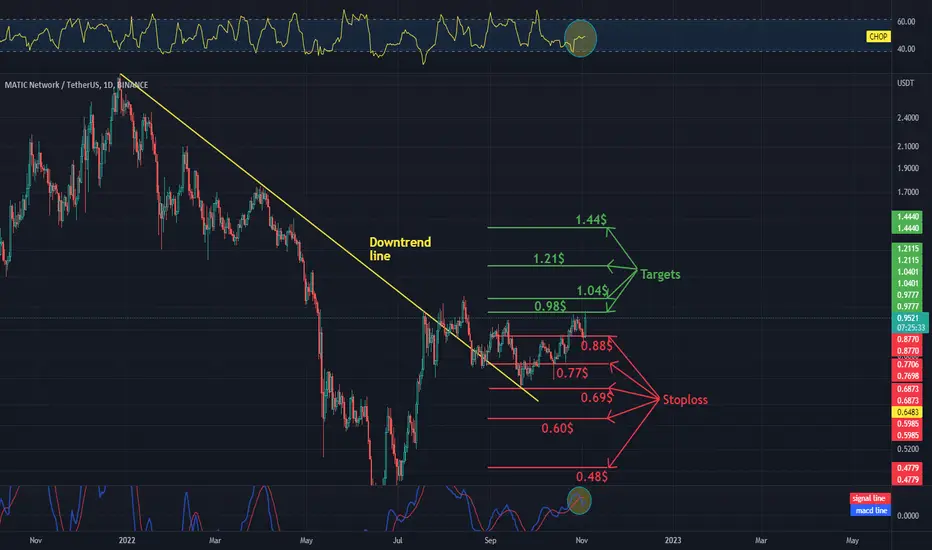
MATIC / USDT 1D chart Targets and StoplossHello everyone, let's take a look at the 1D MATIC to USDT chart as you can see the price is moving above the downtrend line.
Let's start by setting goals for the near future that we can consider:
T1 = $ 0.98
T2 = $ 1.04
T3 = $ 1.21
and
T4 = $ 1.44
Now let's move on to the stop loss in case of further market declines:
SL1 = $ 0.88
SL2 = $ 0.77
SL3 = $ 0.69
SL4 = $ 0.60
and
SL5 = $ 0.48
Looking at the CHOP indicator, we can see that in the 1D range we have more and more energy, and the MACD indicator shows a downward trend, but it turned sharply up when it crosses the red line from the bottom, confirming the upward trend change.
Will DOGE switch to the CARDANO network?Hello everyone, let's take a look at the 1D DOGE to USDT chart as we can see the price broke the trend marked with the white line.
Let's start by setting goals for the near future that we can consider:
T1 = $ 0.151
T2 = $ 0.180
and
T4 = 0.260
Now let's move on to the stop loss in case of further market declines:
SL1 = $ 0.134
SL2 = $ 0.117
SL3 = $ 0.105
and
SL5 = $ 0.092
Looking at the CHOP indicator, we can see that in the 1D range, the energy slowly starts to rebound, and the MACD indicator shows a local upward trend.

ADA/USDT TARGETS AND STOPLOSS 1DHello everyone, let's take a look at the 1D ADA to USDT chart as you can see the price is moving in the downtrend channel, however locally above the uptrend line.
Let's start by setting goals for the near future that we can consider:
T1 - $ 0.4047
T2 - $ 0.4267
T3 - $ 0.4499
and
T4 - $ 0.4829
Now let's move on to the stop loss in case of further market declines:
SL1 - $ 0.3986
SL2 - $ 0.3853
SL3 - $ 0.3719
and
SL4 - $ 0.3531
Looking at the CHOP indicator, we can see that in the 1D range the energy has been depleted and is slowly starting to rise, while the MACD indicator shows an upward trend.

SOL - USDT 4HChart, targets and stoplossHello everyone, let's take a look at the 4H SOL to USDT chart as you can see the price is moving below the local downtrend line.
Let's start by setting goals for the near future that we can consider:
T1 - $ 32.87
T2 - $ 33.43
T3 - $ 33.89
T4 - $ 34.29
and
T5 - $ 34.93
Now let's move on to the stop loss in case of further market declines:
SL1 - $ 32.06
SL2 - $ 31.56
and
SL3 - $ 30.17
Looking at the CHOP indicator, we can see that in the 4H range, energy has been used, while the MACD indicator shows a local downward trend.

ETH - USDT, 1D Interval Targets and Stoploss Hello everyone, let's take a look at the 1D ETH to USDT chart as you can see the price is moving above the downtrend line.
Let's start by setting goals for the near future that we can consider:
T1 - $ 1,632
T2 - $ 1766
T3 - $ 1,904
T4 - $ 2099
and
T5 - $ 2,342
Now let's move on to the stop loss in case of further market declines:
SL1 - $ 1463
SL2 - $ 1,340
SL3 - $ 1,241
SL4 - $ 1142
and
SL5 - $ 997
Looking at the CHOP indicator, we can see that in the 1D range the energy has been used, while the MACD indicator shows a local upward trend.

XRP - USDT on 4H interval Targets and StoplossHello everyone, let's take a look at the 4H XRP to USDT chart as you can see the price is moving above the local downtrend line.
Let's start by setting goals for the near future that we can consider:
T1 - $ 0.4731
T2 - $ 0.4880
T3 - $ 0.5038
T4 - $ 0.5258
and
T5 - $ 0.5534
Now let's move on to the stop loss in case of further market declines:
SL1 - $ 0.4536
SL2 - $ 0.4346
SL3 - $ 0.4203
SL4 - $ 0.4051
and
SL5 - $ 0.3842
Looking at the CHOP indicator, we can see that in the 4H range most of the energy was used, and the MACD indicator shows a local upward trend.

TOMOUSDT - 1hchart - Targets and StoplossHello everyone, let's take a look at the 1H TOMO to USDT chart as you can see the price is moving above the local uptrend line.
Let's start by setting goals for the near future that we can consider:
T1 - $ 0.4382
T2 - $ 0.4555
and
T3 - $ 0.4782
Now let's move on to the stop loss in case of further market declines:
SL1 - $ 0.4244
SL2 - $ 0.4143
SL3 - $ 0.4065
SL4 - $ 0.3988
and
SL5 - $ 0.3877
Looking at the CHOP indicator, we can see that in the 1H range we have more and more energy, and the MACD indicator shows a local downward trend.

US30 TA Overall Bearish this is what I see on US30. It's in a zone from which it needs to break out from. If we get a break and close on the upside, I am expecting a further retracement to the upside in which we have the sell zone. If US30 breaks and closes below this zone, I am expecting a further retracement to the downside in which lower lows will be made. That is all.

BNB / USDT 4H INTERVAL, STOPLOSS AND TARGETSHello everyone, let's take a look at the 4H BNB to USDT chart as you can see the price is moving above the local uptrend line.
Let's start by setting goals for the near future that we can consider:
T1 - $ 272
T2 - $ 277
T3 - $ 282
T4 - $ 289
and
T5 - $ 298
Now let's move on to the stop loss in case of further market declines:
SL1 - $ 269
SL2 - $ 267
SL3 - $ 264
SL4 - $ 260
and
SL5 - $ 256
Looking at the CHOP indicator, we can see that in the 4H interval most of the energy was used, and the MACD indicator shows a local upward trend.

DOT / USDT 4H CHART - Targets and Stoploss!Hello everyone, let's take a look at the 4 hour DOT to USDT chart as you can see the price is moving just above the downtrend line.
Let's start by setting goals for the near future that we can consider:
T1 = $ 6.21
T2 = $ 6.36
and
T3 = $ 6.54
Now let's move on to the stop loss in case of further market declines:
SL1 = $ 6.13
SL2 = $ 6.05
SL3 = $ 6.98
and
SL4 = $ 5.90
Looking at the CHOP indicator, we can see that we have a lot of energy in the 4H range, while the MACD indicator shows a local upward trend.

MDX - Fair Value Gap TakenI covered this in my recent YT video that we had a fair value gap in the yellow box area.
Price (especially short squeezes) tend to fill this gaps sooner or later.
I had also marked out those key levels to look out for as targets (dotted lines).
Mdex smashed both of them with hast, filling the FVG now.
Is this the start to a real trend? (I wouldn't be longing here).

LUNAUSD - Targets and Stoploss 4HHello everyone, let's take a look at the 4H LUNAUSD chart as you can see the price is moving above the local uptrend line.
Let's start by setting goals for the near future that we can consider:
T1 = $ 2.88
T2 = $ 3.02
T3 = $ 3.13
T4 = $ 3.25
and
T5 = $ 3.41
Now let's move on to the stop loss in case of further market declines:
SL1 = $ 2.65
SL2 = $ 2.57
SL3 = $ 2.52
SL4 = $ 2.46
and
SL5 = $ 2.38
Looking at the CHOP indicator, we can see that in the 4H range the energy has been used, while the MACD indicator shows a local upward trend.

XRP - USDT on 4H interval Targets and StoplossHello everyone, let's take a look at the 4H XRP to USDT chart as you can see the price is moving below the uptrend line.
Let's start by setting goals for the near future that we can consider:
T1 = $ 0.4933
T2 = $ 0.5035
T3 = $ 0.5116
T4 = $ 0.5199
and
T5 = $ 0.5316
Now let's move on to the stop loss in case of further market declines:
SL1 = $ 0.4843
SL2 = $ 0.4732
SL3 = $ 0.4648
SL4 = $ 0.4561
and
SL5 = $ 0.4433
Looking at the CHOP indicator, we can see that in the 4H range we have very little energy, and the MACD indicator shows a local downward trend.

Daily review of ETH interval 4HHello everyone, let's take a look at the 4H ETH to USDT chart as you can see the price is moving below the local downtrend line.
Let's start by setting goals for the near future that we can consider:
T1 - $ 1,294
T2 - $ 1,302
T3 - $ 1,324
and
T4 - $ 1,359
Now let's move on to the stop loss in case of further market declines:
SL1 - $ 1282
SL2 - $ 1271
SL3 - $ 1263
SL4 - $ 1,255
and
SL5 - $ 1,243
Looking at the CHOP indicator, we can see that in the 4H range we have very little energy, while the MACD indicator shows a local downward trend.

Looking for Bullish continuation in USDJPYThere has been a move higher into Fridays close, and I am now expecting to see the continuation patterns push the price higher.

Daily review of ETH interval 4HHello everyone, let's take a look at the 4H eth to USDT chart as you can see the price is moving in the local downtrend channel.
Let's start by setting goals for the near future that we can consider:
T1 - $ 1,329
T2 - $ 1,337
T3 - $ 1,346
T4 - $ 1,357
and
T5 - $ 1,371
Now let's move on to the stop loss in case of further market declines:
SL1 - $ 1,308
SL2 - $ 1296
SL3 - $ 1,286
SL4 - $ 1278
and
SL5 - $ 1264
Looking at the CHOP indicator, we can see that in the 4H range the energy has been used, while the MACD indicator shows that the blue line is close to the red line crossing from below, which could confirm the upward trend change.
