What are Tariffs? How They Work and Why They Matter to You?For centuries, tariffs have played a crucial role in global trade, safeguarding domestic industries, shaping international relations, and influencing economic policies. While they often dominate headlines during trade wars and economic policy debates, many people still don’t fully understand what tariffs are, why they are used, and how they impact the economy.
This comprehensive guide covers:
⦿ What tariffs are and how they work
⦿ Different types of tariffs
⦿ Why governments impose tariffs
⦿ The economic, political, and social effects of tariffs.
⦿ Historical and modern examples
⦿ The debate between protectionism and free trade
⦿ Tariffs in different economic systems
⦿ The future of tariffs in a globalized world
By the end of this article, you’ll have a decent understanding of tariffs and their role in the global economy.
🤔 What Are Tariffs?
A tariff is a tax imposed by a government on imported goods and services. The primary purpose of tariffs is to increase the cost of foreign products, making domestically produced goods more attractive to consumers. This serves several economic and political functions, such as protecting domestic industries, generating government revenue, and addressing trade imbalances.
👍 How Do Tariffs Work?
A government sets a tariff rate on imported goods (e.g., 25% on foreign cars).
Importers must pay this tax when bringing goods into the country.
This increases the cost of imported goods, enhancing the competitiveness of domestic alternatives.
Domestic industries benefit from reduced foreign competition.
The government collects revenue from the tariff.
🦸♂ Who Pays the Tariff?
Importers: These businesses or individuals directly pay the tariff when they bring goods into the country. This increases their costs.
Businesses: Since importers face higher costs, businesses that rely on imported goods often pass these costs onto consumers by increasing prices.
Consumers: Ultimately, the general public bears the cost as they pay higher prices for goods affected by tariffs.
🔎 Types of Tariffs
Governments employ various tariffs depending on their economic goals and trade policies. Some of these are:
1️⃣ Ad Valorem Tariffs
An ad valorem tariff is a percentage-based tariff calculated on the value of the imported goods. The tax amount increases or decreases with the price of the product.
Example: A 10% tariff on imported TVs means a $1,000 TV incurs a $100 tariff.
Usage: Commonly used for luxury goods, automobiles, and consumer electronics.
2️⃣ Specific Tariffs
A specific tariff is a fixed fee charged per unit of imported goods, regardless of price.
Example: $3 per barrel of imported oil.
Usage: Often used for commodities like oil, wheat, and alcohol.
3️⃣ Compound Tariffs
A compound tariff includes both a percentage-based tax (Ad valorem) and a fixed fee on imports (Specific). This means importers pay a fixed fee per unit as well as a percentage of the item’s value.
Example: A 5% tax plus $2 per imported cheese wheel.
Usage: Applied to goods where both quantity and value affect the market, such as food products and industrial materials.
4️⃣ Tariff-Rate Quotas (TRQs)
A TRQ allows a limited quantity of an imported good to enter at a lower tariff rate. After the quota is reached, extra imports are taxed at a higher rate.
Example: One of the most well-known examples of a TRQ is the U.S. Sugar Tariff-Rate Quota. The United States allows a certain quantity of sugar to be imported each year at a lower tariff rate. Any sugar imports within the quota limit are subject to a low tariff (e.g., 5%).
However, once the quota is exceeded, any additional sugar imports face a much higher tariff (e.g., 20%). This system ensures that domestic sugar producers remain competitive while still allowing controlled imports to meet demand.
Another example is the European Union's TRQ on Beef Imports. The EU permits a specific amount of high-quality beef imports (e.g., from the U.S. and Canada) at a lower tariff. Once this quota is filled, any additional beef imports are taxed at a significantly higher rate. This policy helps protect EU cattle farmers while maintaining trade agreements with international suppliers.
5️⃣ Protective Tariffs
A protective tariff helps local industries by making imported goods more costly, reducing foreign competition.
Example: The U.S. imposed a 25% tariff on Chinese steel to protect domestic steel manufacturers.
Usage: Commonly used in industries facing strong foreign competition, such as steel, automotive, and textiles.
6️⃣ Revenue Tariffs
A revenue tariff is mainly designed to raise money for the government, not to shield local industries.
Example: In the 19th century, tariffs were the main source of revenue for the U.S. government before income taxes were introduced.
Usage: Often applied to goods that do not have strong domestic competition but are widely consumed, such as alcohol and tobacco.
❓ Why Do Governments Impose Tariffs?
1️⃣ Protecting Domestic Industries
Tariffs shield local businesses from cheaper foreign competitors, helping domestic industries grow.
Example: U.S. steel tariffs in 2018 benefited domestic steel manufacturers.
2️⃣ Generating Government Revenue
Before modern taxation systems, tariffs were a key source of revenue for governments.
Example: In the 1800s, tariffs accounted for 90% of U.S. federal revenue.
3️⃣ National Security Concerns
Some industries, like defense and technology, are crucial for national security, and governments impose tariffs to reduce reliance on foreign suppliers.
Example: The U.S. limits imports of rare earth minerals to ensure a domestic supply chain for defense technologies.
4️⃣ Retaliation in Trade Wars
Countries impose tariffs to address unfair trade practices or economic conflicts.
For instance, during the trade war between the United States and China, both countries imposed taxes on each other's goods
5️⃣ Preventing Dumping
Dumping occurs when a country exports goods at below-market prices to eliminate competition.
Example: The U.S. imposed tariffs on Chinese solar panels due to concerns about dumping.
⚖️ Pros and Cons of Tariffs
Pros
✅ Protects local jobs and industries
✅ Encourages domestic production
✅ Generates government revenue
✅ Enhances national security by reducing reliance on foreign goods
Cons
❌ Increases prices for consumers
❌ Can lead to trade wars and economic retaliation
❌ Encourages inefficiency in domestic industries
❌ Disrupts global supply chains
📕 Historical and Modern Examples of Tariffs
1. The Smoot-Hawley Tariff Act (1930)
The U.S. imposed tariffs on over 20k imported goods.
Result: Other countries retaliated, global trade dropped by 66%, and the Great Depression worsened.
2. Trump’s Tariffs on China (2018-2020)
The United States levied tariffs on $360 billion worth of Chinese goods.
China retaliated, affecting U.S. agriculture exports.
Result: Some U.S. industries benefited, but consumers faced higher prices.
3. The European Union’s Tariffs on U.S. Goods (2021)
The EU imposed tariffs on American whiskey, motorcycles, and jeans in response to U.S. steel tariffs.
Result: Brands like Harley-Davidson saw reduced sales in Europe.
⚙️ Tariffs vs. Free Trade: The Big Debate
The debate between tariffs and free trade is a fundamental discussion in global economics and trade policy. This debate revolves around whether governments should impose tariffs (taxes on imported goods) or embrace free trade (minimal to no restrictions on imports and exports).
◉ Free Trade (No Tariffs)
Free trade is the unrestricted movement of goods and services across borders without tariffs or other trade barriers. Advocates argue that it fosters economic efficiency and global cooperation.
✅✅ Advantages of Free Trade
Lower Prices for Consumers – Without tariffs, imported goods are cheaper, leading to more affordable products.
Increased Economic Growth – When countries trade freely, they specialize in what they do best, leading to higher productivity and economic expansion.
More Competition = Better Products – Companies must compete on quality and innovation rather than relying on government protection.
Stronger Global Relations – Open markets encourage cooperation between nations, reducing the risk of economic conflicts.
Access to More Goods and Services – Consumers enjoy a greater variety of products at lower costs.
❌❌ Disadvantages of Free Trade
Job Losses in Unprotected Industries – Domestic industries that can't compete with cheaper imports may shrink or shut down.
Dependence on Foreign Suppliers – A country may become overly reliant on other nations for essential goods (e.g., medical supplies, electronics).
Potential Trade Deficits – Countries that import more than they export may struggle with imbalances in trade.
◉ Protectionism (Using Tariffs)
Protectionism refers to economic policies that restrict imports through tariffs, quotas, or other barriers to shield domestic industries from foreign competition.
✅✅ Advantages of Tariffs
Protects Local Jobs and Industries – Domestic businesses have a better chance to compete without being undercut by cheaper imports.
Reduces Dependence on Foreign Competitors – A country can maintain its own manufacturing and production capabilities, especially in critical industries like steel, energy, and food.
Generates Government Revenue – Tariffs provide a source of income for governments, which can be reinvested in public services.
Prevents Dumping – Tariffs discourage foreign companies from flooding the market with artificially cheap goods to destroy domestic competition.
❌❌ Disadvantages of Tariffs
Higher Prices for Consumers – Since imported goods are taxed, businesses pass the extra costs to customers.
Risk of Trade Wars – When one country imposes tariffs, others retaliate, leading to economic conflicts that hurt all parties involved.
Encourages Inefficiency – Without foreign competition, domestic companies may become complacent and innovate less.
Disrupts Global Supply Chains – Many industries rely on international suppliers; tariffs can increase production costs and delays.
❇️ The Future of Tariffs in a Globalized World
As economies become more interconnected, tariffs are often seen as barriers to global trade.
Emerging industries, such as digital services, face new trade policy challenges that traditional tariffs do not cover.
With globalization, many nations favor free trade agreements (FTAs) like USMCA and the EU single market to reduce trade barriers.
Climate-related tariffs, such as carbon border taxes, may become more common as nations try to incentivize environmentally friendly trade practices.
📌 Closing Thoughts
Tariffs remain one of the most powerful - and controversial - tools in economic policy. Like a thermostat for trade, they can be adjusted to protect domestic industries, but risk overheating the economy with unintended consequences.
History shows that while tariffs can provide temporary relief for specific sectors, they often create ripple effects across the entire economy. The steel tariffs of 2018 helped some American mills reopen, but made cars and appliances more expensive for everyone.
Neither free trade nor tariffs are perfect solutions. A balanced approach, where tariffs are selectively used for strategic industries while promoting open markets in others, is often the best path.
Each country must decide based on its economic strengths and priorities. For example, developed nations might push for free trade, while developing nations use tariffs to protect growing industries.
As trade policies continue evolving, understanding tariffs gives citizens and businesses crucial insight into how globalization affects prices, jobs, and economic security. The debate isn't about whether tariffs are "good" or "bad," but rather when and how they should be used strategically.
What are your thoughts on the ongoing U.S. tariff war? Share your opinions in the comments! 📩
Tariffs

SP500 Plunges 8% in a day!! Oversold or more pain ahead?The SP500 has suffered a massive 8% drop, currently trading around 5158 at the moment, after market turmoil triggered by Trump's new tariff war. Panic selling has pushed the 30-minute RSIto an extreme oversold level of around 28, signaling potential short-term exhaustion.
Possible Scenarios:
🔹 Short-Term Bounce? The RSI suggests a possible technical rebound, with key resistance around 5200-5250 if buyers step in. Watch for volume confirmation.
🔹 Further Downside? If panic continues, the next major support lies at 5100, followed by 5000 psychological level, where institutional buyers might defend price.
⚠️ Caution: Markets remain highly volatile! A dead-cat bounce is possible, but uncertainty surrounding tariffs could fuel more downside pressure. Stay sharp!
📊 What’s Your Take? Will SP500 recover or break lower? Drop your thoughts below! 🚀🔥
#SP500 #StockMarketCrash #Tariffs #Trading #TechnicalAnalysis #RSI

S&P 500 Faces Increased Bearish Pressure as Trade War BeginsThe S&P 500 has formed a downtrend channel following the break below the 5700 support level. Trump's new aggressive tariff policy raised the minimum tariff on China to 54%, while China responded with equally aggressive 34% tariffs. The trade war has now officially begun.
This escalation is clearly negative for the stock market. Recession risks have risen significantly, and it remains uncertain how much the Fed can cut rates while tariff-driven inflationary pressures persist. Rapid rate cuts could help soften the slowdown but may also risk fueling another inflation surge. That would be the more optimistic case for equities. However, the Fed is likely to proceed cautiously, suggesting that bearish pressure could continue for several quarters.
In the short term, the downward trend remains intact. If the S&P 500 breaks the 38.2% Fibonacci retracement level, it may decline further toward the lower boundary of the new trend channel, where a potential bounce could occur. As long as the trend holds, bears remain in control.
Note: Powell is expected to speak today. His remarks carry even more weight following the tariff moves by both the U.S. and China.

Markets eye US, Canada job reports, US dollar steadiesThe Canadian dollar has taken a break after an impressive three-day rally, in which the currency climbed about 2%. In the European session, USD/CAD is trading at 1.4148, up 0.39%. On Thursday, the Canadian dollar touched 140.26, its strongest level since December.
The hottest financial news is understandably the wave of selling in the equity markets, but there are some key economic releases today as well. The US and Canada will both release the March employment report later today.
The US releases nonfarm payrolls, with the markets projecting a gain of 135 thousand, after a gain of 151 thousand in February. This would point to the US labor market cooling at a gradual pace, which suits the Federal Reserve just fine. The Fed will also be keeping a watchful eye on wage growth, which is expected to tick lower to 3.9% y/y from 4.0%. The unemployment rate is expected to hold at 4.1%.
The employment landscape is uncertain, with the DOGE layoffs and newly-announced tariffs expected to dampen wage growth in the coming months. Canada's employment is expected to improve slightly to 12 thousand, after a negligible gain of 1.1 thousand in February. Unemployment has been stubbornly high and is expected to inch up to 6.7% from 6.6%.
US President Donald Trump's tariff bombshell on Wednesday did not impose new tariffs on Canada, but trade tensions continue to escalate between the two allies. Canada said it would mirror the US stance and impose a 25% tariff on all vehicles imported from the US that do not comply with the US-Canada-Mexico-Canada free trade deal. The US has promised to respond to any new tariffs against the US, which could mean a tit-for-tat exchange of tariffs between Canada and the US.
USD/CAD has pushed above resistance at 1.4088 and 141.26. The next resistance line is 1.4170
1.4044 and 1.4006 are the next support levels

Markets eye US, Canada job reports, US dollar steadiesThe Canadian dollar has taken a break after an impressive three-day rally, in which the currency climbed about 2%. In the European session, USD/CAD is trading at 1.4148, up 0.39%. On Thursday, the Canadian dollar touched 140.26, its strongest level since December.
The hottest financial news is understandably the wave of selling in the equity markets, but there are some key economic releases today as well. The US and Canada will both release the March employment report later today.
The US releases nonfarm payrolls, with the markets projecting a gain of 135 thousand, after a gain of 151 thousand in February. This would point to the US labor market cooling at a gradual pace, which suits the Federal Reserve just fine. The Fed will also be keeping a watchful eye on wage growth, which is expected to tick lower to 3.9% y/y from 4.0%. The unemployment rate is expected to hold at 4.1%.
The employment landscape is uncertain, with the DOGE layoffs and newly-announced tariffs expected to dampen wage growth in the coming months.
Canada's employment is expected to improve slightly to 12 thousand, after a negligible gain of 1.1 thousand in February. Unemployment has been stubbornly high and is expected to inch up to 6.7% from 6.6%.
US President Donald Trump's tariff bombshell on Wednesday did not impose new tariffs on Canada, but trade tensions continue to escalate between the two allies. Canada said it would mirror the US stance and impose a 25% tariff on all vehicles imported from the US that do not comply with the US-Canada-Mexico-Canada free trade deal. The US has promised to respond to any new tariffs against the US, which could mean a tit-for-tat exchange of tariffs between Canada and the US.
USD/CAD has pushed above resistance at 1.4088 and 141.26. The next resistance line is 1.4170
1.4044 and 1.4006 are the next support levels

GBPUSD Discretionary Analysis: Going Up Like TariffsI’m not entirely sure, but something(or some news) tells me GBPUSD is heading up like tariffs – quick and sharp. If not, guess it got delayed at the border. Profit if I’m right, lesson if I’m wrong!
Just my opinion, not financial advice.

AUDUSD Bears "Flag Down" Potential OpportunitiesOn the Technical Analysis stand-point, FX:AUDUSD has been Consolidating in an Ascending Channel since the beginning of this year after having a sharp decline which started in October last year. Now the past 6 Months, Price Action seems to be forming a strong Continuation Pattern, the Bear Flag!
Based on the Retracement from the Swing High @ .6942 to the Swing Low @ .60872, Price has made a 38.2% Retracement to .64081, resulting in a False Break, pushing Price back into Pattern!
Price has been trading Under the 200 EMA since the start of the "Flagpole" and with the separation between it and the 34 EMA Band, feeds the Bearish Bias after we see Price heavily rejected after touching the 34 EMA Band!
*Once Price makes a Breakout of the Rising Support of the Channel -> Bear Flag Confirmed
*Increase in Volume after Break -> Breakout Validated
If we get a True Breakout that is Validated by the checklist of factors, we could be looking at great opportunities to take FX:AUDUSD down to the current 5 Year Low of .55063 set back in March 16th 2020 (Initial Outbreak of Covid) based on the Flagpole and Potential Extension of a Valid Break and Retest of the Bear Flag!
Now, Fundamentally what is driving the Weaker Aussie Dollar is the fear of the impact of what the US Tariffs will do to Australia's "Key Trading Partners" being China, Japan and South Korea all being high on the Reciprocal Tariff List. Because of this, the RBA has now priced in 100 Basis Points worth of Rate Cuts to come with the expectations of a "dampened broader outlook for global trade and economic growth."
www.tradingview.com
Stay Tuned!

IHSG AFTER BREAKMarket globally is crashed because of the new tariff that US applied. IHSG might as well crashed after this break, approaching 58xx. But i believe after this correction IHSG Will back in action and reach 67xx.

Is it time for a relief for the Yen?After a severe beating by the USD especially the tumultous rise inflation, Japans currency is gonna look for some relief as Tariifs will clearly lead to an economic slowdown of U.S economy, as more cheap stuff from China and the emerging market will clearly look to rise and that may weigh on consumer sentiment.
🟨 - Head abd Shoulders
🟥🔘 - Price/RSI Deviation

Ford (NYSE:F) Drop 5%+ as Tariffs Threaten Auto Industry marginsFord Motor Company (NYSE: F) is facing a challenging market environment as its stock price fell 5.27% to $9.61 as of 3:24 PM EDT. This drop comes amid declining sales and the looming threat of new tariffs from the Trump administration. In the last 52 weeks, Ford's stock has traded within a range of $9.06 to $14.85.
On Tuesday 1st April, Ford reported a 1.3% decline in total vehicle sales year-over-year, delivering 501,291 vehicles in Q1 2025. Despite this decline, retail sales rose by 5%, with a strong 19% surge in March, signaling that buyers may be accelerating purchases ahead of the impending tariffs.
General Motors (GM) posted strong results with a 17% increase in sales, delivering 693,353 vehicles in Q1 2025. The company achieved double-digit growth across all its brands, marking its best first-quarter performance since 2018. While GM shares remained stable, Ford shares saw further declines.
Tariffs Add Uncertainty for Automakers
The auto industry is preparing for the impact of a 25% tariff on foreign cars and parts. The Trump administration confirmed on Wednesday that his 25% global car and truck tariffs would take effect as scheduled on Thursday and that duties on automotive parts imports will be launched on May 3rd.
Although Ford manufactures most of its vehicles in the U.S, many essential parts are imported. Higher production costs could push car prices higher, affecting demand.
Ford executives have stated they are assessing the impact of these tariffs on their business operations. Chairman William Clay Ford Jr. assured shareholders that the company is prepared to handle geopolitical uncertainties. Despite this, investor sentiment remains cautious, contributing to the recent stock price decline.
Technical Analysis
Ford’s stock has been trading within a narrow range of $9 to $10 in the last three months. A strong resistance level at $11, tested several times from August to November 2024, remains unbroken. Since failing to break the resistance level, the stock has since then declined.
Currently, the price is testing a double support level at $9 comprising of a horizontal key support and a descending trendline. If this support holds, Ford’s stock may attempt another bull phase toward the $11 resistance level. On the other hand, a break below $9 could push the price lower, with the next potential support level at $8.45.
The 50-day, 100-day and 200-day moving averages are positioned above the current Market price, at $9.74, $10.08 and $10.70 respectively. This indicates strong bearish pressure, limiting bullish momentum in the near term.
Thoughts Moving Forward
With tariffs and the auto industry facing supply chain disruptions, Ford’s stock is likely to remain under pressure. The bearish sentiment could persist in the short term, especially if the price breaks below the key $9 support level.
If support holds, Ford could see a short-term bounce toward $11. However, sustained bullish momentum would require strong demand and improved market sentiment. This would be witnessed if its earnings report, set to be released between April 22nd and April 28th, 2025, is favorable. Until then, geopolitical and economic uncertainties weigh on the stock.

Amazon (NASDAQ: $AMZN) Drops 8% as Trump Tariffs Shake Markets. Amazon (NASDAQ: NASDAQ:AMZN ) is facing huge downward pressure following President Donald Trump's announcement of sweeping tariffs. The stock dropped 9.26% in early trading, reaching $176.92 as of 11:01 AM EDT.
These tariffs impact over 100 countries, including China, a key supplier for third-party merchants on Amazon’s platform. Rising import costs could push prices higher, affecting consumer spending and Amazon’s profit margins.
Looking at the broader market, it is also struggling from the tariffs. The Magnificent Seven stocks, including Apple, Nvidia, Meta, Tesla, Alphabet, Microsoft, and Amazon, have all seen huge drops.
Amazon’s 8% drop is among the largest, further highlighting its vulnerability to trade disruptions. If these tariffs persist, they could reignite inflation, weigh on economic growth and further impact stock prices. Amazon has faced major market shifts in the past. In 2022, its stock lost over 50% of its value within a few quarters.
The question now is, can the current decline lead to similar losses?
With Amazon trading at $242 in February, some fear it could drop below $120 if the economic outlook worsens.
Adding to concerns, geopolitical risks remain high. The ongoing war in Ukraine, coupled with uncertainty over future U.S policies, creates a volatile environment for stocks. Amazon’s reliance on global supply chains and consumer spending makes it highly sensitive to market shocks.
Technical Analysis
Looking at Amazon technically, there has been a downtrend since early February when it reached an all-time high and a 52-week high of $242. This peak came shortly after the presidential inauguration, but since then, the market conditions have not been favorable. The introduction of new tariffs has fueled bearish momentum, pushing Amazon lower toward key support levels.
Currently, the stock is testing a double support level, an ascending trendline and a horizontal support around $180. If buyers step in at this level, a rebound could occur, targeting the previous $252 all-time high. However, given the economic uncertainty, there is a strong chance the stock may break below this current support.
If the weekly candle closes strongly below the $180 level, the next critical point where the stock might find support is around $144. This area has historically provided strong buying interest and it may serve as a potential bottom if the decline continues.
Looking at momentum indicators, the weekly RSI currently sits at 33, indicating strong bearish momentum. Despite the reading approaching the oversold reading, macroeconomic data shows the downtrend remains dominant and further losses could be ahead.
What's the Outlook? Can Amazon Recover Soon?
The coming weeks will be crucial for Amazon’s stock. With earnings expected between April 28th and May 2nd, market sentiment may shift based on revenue growth and profit margins. However, ongoing trade uncertainties and rising costs remain key risks.
For now, monitor price action around the current market price of $180. A strong bullish move could confirm a short-term recovery. On the other side, a break below this double support level may signal a further drop towards $144 support level.

Trump's Tariff Wars : What To Expect And How To Trade Them.I promised all of you I would create a Trump's Tariff Wars video and try to relate that is happening through the global economy into a rational explanation of HOW and WHY you need to be keenly away of the opportunities presented by the new Trump administration.
Like Trump or not. I don't care.
He is going to try to enact policies and efforts to move in a direction to support the US consumer, worker, business, and economy.
He made that very clear while campaigning and while running for office (again).
This video looks at the "free and fair" global tariffs imposed on US manufacturers and exports by global nations over the past 3+ decades.
For more than 30+ years, global nations have imposed extreme tariffs on US goods/exports in order to try to protect and grow their economies. The purpose of these tariffs on US good was to protect THEIR workers/population, to protect THEIR business/economy, to protect THEIR manufacturing/products.
Yes, the tariffs they imposed on US goods was directly responsible for THEIR economic growth over the past 30-50+ years and helped them build new manufacturing, distribution, consumer engagement, banking, wealth, and more.
The entire purpose of their tariffs on US goods was to create an unfair advantage for their population to BUILD, MANUFACTURE, and BUY locally made products - avoiding US products as much as possible.
As I suggested, that is why Apple, and many other US manufacturers moved to Asia and overseas. They could not compete in the US with China charging 67% tariffs on US goods. So they had to move to China to manufacture products because importing Chinese-made products into the US was cheaper than importing US-made products into China.
Get it?
The current foreign Tariffs create an incredibly unfair global marketplace/economy - and that has to STOP (or at least be re-negotiated so it is more fair for everyone).
And I believe THAT is why Trump is raising tariffs on foreign nations.
Ultimately, this will likely be resolved as I suggest in this video (unless many foreign nations continue to raise tariff levels trying to combat US tariffs).
If other foreign nation simply say, "I won't stand for this, I'm raising my tariff levels to combat the new US tariffs", then we end up where we started - a grossly unfair global marketplace.
This is the 21st century, not the 18th century.
Step up to the table and realize we are not in the 1850s or 1950s any longer.
We are in 2025. Many global economies are competing at levels nearly equal to the US economy in terms of population, GDP, manufacturing, and more.
It's time to create a FREE and FAIR global economy, not some tariff-driven false economy on the backs of the US consumers. That has to end.
Get some.
#trading #research #investing #tradingalgos #tradingsignals #cycles #fibonacci #elliotwave #modelingsystems #stocks #bitcoin #btcusd #cryptos #spy #gold #nq #investing #trading #spytrading #spymarket #tradingmarket #stockmarket #silver

EURUSD Surges to 1.10 levels post-Trump Tariffs: BUY or SELL?Current Situation:
EUR/USD spiked to 1.10 levels(up sharply) following Trump’s tariff announcement, defying initial expectations of short-term USD strength. This suggests markets are pricing in long-term risks to the USD (growth fears, retaliatory tariffs) faster than anticipated.
Key Drivers Behind the Move:
1. Tariff Backfire Risk: Investors may fear tariffs will hurt U.S. growth more than Europe’s, weakening the USD.
2. ECB vs. Fed Policy Shift: Bets that the **Fed could cut rates sooner** if tariffs slow U.S. inflation/growth, while the ECB delays cuts.
3. Retaliation Bets: Expectations of aggressive EU countermeasures (e.g., tariffs on U.S. tech/agriculture) boosting EUR sentiment.
---
Technical Analysis (EUR/USD Daily Chart)
- ✅ Breakout Confirmed : Price surged till 2024's resistance, now testing 1.10 levels (psychological levels).
- RSI: Overbought, suggesting short-term pullback risk.
#EURUSD #TrumpTariffs #ForexTrading #Breakout #USDweakness

Driven Brands Holdings: Dominating North America's Auto ServicesKey arguments in support of the idea.
A potential rise in U.S. car prices may positively impact the company’s sales.
DRVN is expanding its footprint in the essential automotive services market, simultaneously reducing its car wash segment with more cyclical sales.
Investment Thesis
Driven Brands Holdings Inc. (DRVN) is the largest automotive services company in North America, operating an increasing network of approximately 5,200 franchise, independently owned businesses operated by the company across 49 U.S. states and 13 other countries. The company has a footprint in all major automotive service areas, catering to both retail and commercial customers. Its main business segments include car maintenance and repair, express car wash, bodywork and paint services.
U.S. car import tariffs, introduced in March, support the trend of an increasing average age of cars on U.S. roads and may lead to higher car prices. These factors may contribute positively to DRVN’s revenue growth. On April 3, a 25% tariff on cars imported to the U.S. will take effect, and by May 3, equivalent tariffs on automotive components will be implemented. These tariffs may disrupt automakers’ production processes due to a reconfiguration of production chains. Only half of the 16 million new cars sold annually in the U.S. are produced domestically, while other autos could be subject to these tariffs. Production disruptions may result in price increases for both new and used cars. Many consumers may delay purchasing new cars, opting instead to spend more on maintaining their current vehicles. The new factors support the general long-term trend to an increasing average age of cars on U.S. roads. In 2000, the average vehicle age in the U.S. was 8.9 years; it has now grown to 12.6 years and continues to rise annually. Despite this, the total number of vehicles on U.S. roads is also steadily increasing at an average annual rate of about 1% over the past two decades. Combined with the new tariffs, the overall growth of the automotive aftermarket is likely to boost DRVN’s revenue in the upcoming years.
Driven Brands continues successfully shifting its focus to essential automotive services. After 2023, the company began reducing its ownership of standalone car washes while expanding its Take 5 Oil Change locations. Take 5 Oil Change provides rapid oil change services within 10 minutes, allowing drivers to remain in their cars. In March, reports have indicated that Driven Brands plans to sell its Take 5 Car Wash chain. We suppose this deal will accelerate the expansion of the Take 5 Oil Change segment and enable the company to allocate some proceeds toward debt reduction, potentially decreasing debt service expenses by up to 20%.
The valuation of DRVN stock, compared to its peers, shows potential for growth. DRVN’s valuation corresponds to 14 projected earnings for 2025, aligning with the average valuation among U.S. car dealers. Nonetheless, DRVN’s potential for revenue growth in the coming years is anticipated to surpass that of its peers. In the last three quarters alone, the Take 5 segment has demonstrated a sequential revenue increase of 10%, accounting for about 60% of the company’s total sales.
We suppose that Driven Brands Holdings Inc. (DRVN) shares may exhibit positive momentum in the near term.
The target price for DRVN shares over a two-month horizon is $19.90, with a “Buy” rating. We suggest setting a stop-loss at $15.50.

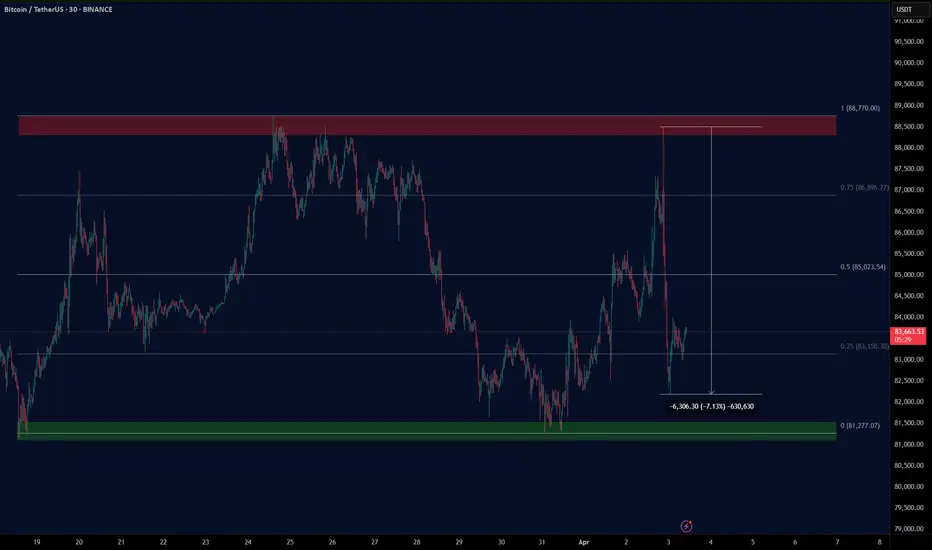
BTC TARIFF TALKAs President Trump steps up on the stage to deliver his tariff plan BTC had a steady price rise going into the talk, a nice HH & HL LTF structure up into range high/ last weeks high, then as the speech began all of the progress made throughout the day wiped in less than 2 hours to reset BTC's price to Tuesdays low.
In the end the news event gave volatility as expected but ultimately the structure remains the same, rangebound. As the Tax year comes to an end it would be a hard ask for this choppy price action to shift bullish when institutions are going to be window dressing their portfolios for the next financial year.
In essence A continued LTF range with an overall HTF bearish trend looks to continue, this is compounded by yet another failed attempt at the 4H 200 EMA which had temporarily been broken but sent back below by the tariff announcements.
The SPX, DJI & NASDAQ Futures pre-market is looks dreadful so a revisit on the range low is probable on the cards at some stage today.
My Retrace and Bull Run For EUR/USD After Tariff Announcements!The chart is pretty clear, I wouldn't advise you trade this however this is my idea of where price could move so leave a comment with any ideas you might have, Happy Trading!!!

USD/JPY Stands Firm, But Volatility ExpectedVolatility has receded with less than 20-hours to go until Trump's tariffs are officially implemented, with traders now clearly in watch-and-wait mode. So while headline risks around tariffs remain in place, moves could remain limited unless traders are treated to any last-minute negotiations.
Typically, risk has benefitted when it has been expected that tariffs have been watered down. If that turns out to be the case by Trump's speech at 4pm ET Wednesday, indices could rise alongside the US dollar and the yen weaken.
Bit of course, the opposite is true. And that could weigh on USD/JPY. Rightly or wrongly, I'm feeling optimistic and now seeing a bounce on USD/JPY.
Two bullish pinbars found support and close above the 20-day SMA and monthly pivot point. The bias remains bullish while prices remain above Monday's low, and a break above 150 brings the 200-day SMA, February VPOPC and 152 handle into focus.
Matt Simpson, Market Analyst at City Index and Forex.com

Liberation Day: Fear or greed in the air? We are less than hour out from the Liberation Day tariff announcements. The U.S. is preparing to roll out reciprocal tariffs on all countries, with rates set at 10%, 15%, and 20%, according to Sky News.
Investors hoping for certainty may be disappointed—this could mark the start of a longer phase of trade battles.
Mexico, once again, is reading the room. President Sheinbaum has confirmed Mexico won’t respond with tit-for-tat tariffs. They understand that the way to deal with Trump is to treat him with kid gloves.
Meanwhile, gold hit another record high, reaching $3,149.04 on Tuesday before pulling back a little. Buyers might have a better setup around the parallel pivot line to position for further upside.

Australian dollar rally continues, Trump tariffs loomThe Australian dollar has posted strong gains for a second straight day. In the European session, AUD/USD is trading at 0.6306, up 0.47% on the day.
The Reserve Bank of Australia maintained the cash rate at 4.10% on Tuesday, in a move that was widely expected by markets. Still, the Australian dollar reacted positively, gaining 0.48% on Tuesday.
The RBA statement noted that underlying inflation continued to ease in line with the Bank's forecast, but the Board "needs to be confident that this progress will continue" so that inflation remains sustainable at the midpoint of the 2%-3% target band. The statement said there was "significant" uncertainty over global trade developments, pointing to the threat of further US tariffs and possible counter-tariffs from targeted countries.
The central bank's decision was made in the midst of a hotly contested election campaign, and a rate cut would likely have been attacked by the opposition parties as political interference.
In a press conference after the meeting, Governor Michele Bullock acknowledged the uncertainty over the global outlook due to US trade policy but sought to assure the markets by saying that Australia was "well placed" to weather the potential storm of a global trade war.
US President Trump has not specifically targeted Australia with any tariffs but China is Australia's number one trading partner and a US-China trade war would inflict damage on Australia's economy.
The new US tariffs are expected to be announced later today and take effect on Thursday. The financial markets remain volatile as investors look for some clarity from Washington about the tariffs, as it remains unclear which countries will be targeted and the extent of the tariff rates.

Review and plan for 3rd April 2025 Nifty future and banknifty future analysis and intraday plan in kannada.
This video is for information/education purpose only. you are 100% responsible for any actions you take by reading/viewing this post.
please consult your financial advisor before taking any action.
----Vinaykumar hiremath, CMT

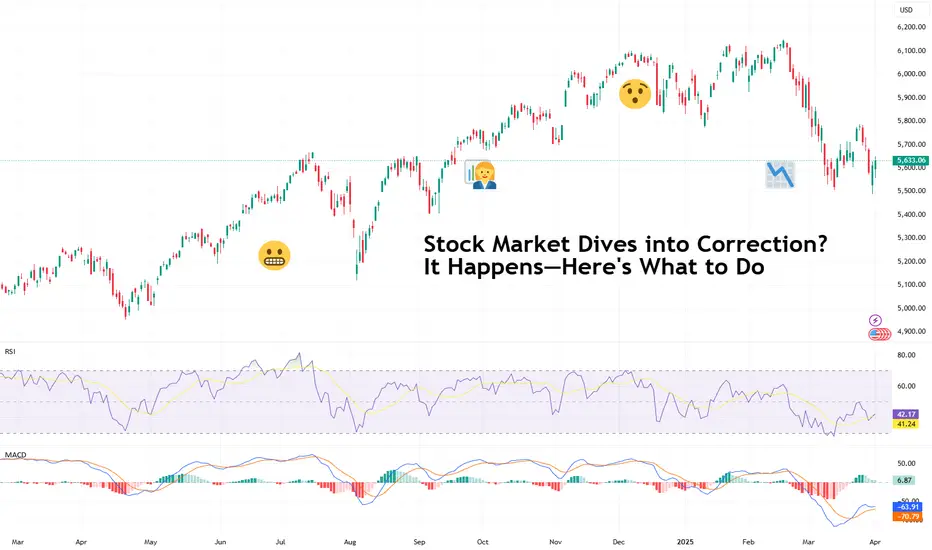
Stock Market Dives into Correction? It Happens—Here's What to DoYou wake up, check your portfolio, and see a sea of red. The market’s down, your stocks are taking a nosedive, and CNBC is running apocalyptic headlines about an impending crash. Sounds familiar?
It’s maybe because we’re in (or super close to) a correction right now — the S&P 500 SP:SPX was down 10% from its record high two weeks ago and a lot of people are unsure what to do.
The truth of the matter is, stock market corrections are routine—not as often as the meeting that should’ve been an email, but also not as rare as a winning trade in the Japanese yen ( widow maker is real, yo ).
And, most importantly, they’re usually not as catastrophic as they feel in the moment.
So, before you hit the panic button (or worse, start revenge trading to “win it all back”), let’s talk about what’s shaking the market right now and how to navigate corrections like a pro.
🤔 First Things First: What’s a Correction?
A stock market correction is a drop of 10% or more from a recent high. It’s not a crash, it’s not the end of capitalism, and it’s definitely not a sign that you should liquidate your entire portfolio and move to a remote cabin in the woods.
Corrections happen regularly, typically once every year or two. They’re a natural part of market cycles, shaking out excessive speculation and resetting valuations to more reasonable levels.
For the record, a drop of 20% is considered a bear market.
🤝 Why the Market’s Getting Jittery
Markets don’t move in straight lines, and sometimes they hit turbulence. Lately, two big themes have been dominating headlines:
Trump’s Hard-Line Tariffs Hit Hard (And Markets Are Nervous About It)
If there’s anything Trump knows how to do is say things online or on-site and move markets. And his hostile and straight up combatant approach to handling international relations has sent traders scrambling to offload risk.
With hiked tariffs on China, Europe, and Mexico and Canada, businesses are bracing for severe supply chain disruptions, higher costs, and tighter margins. When tariffs go up, corporate earnings tend to go down—and the market doesn’t like that math.
Inflation Just Won’t Quit
The Federal Reserve spent most of the last two years trying to tame inflation, and just when it seemed like things were cooling off, it’s creeping back up. The latest readout of the personal consumption expenditures (PCE) report showed prices ticked up more than expected at 2.8% in February.
Higher inflation means the Fed might keep interest rates elevated for longer than expected, making borrowing more expensive and slowing down growth. Every new inflation release has investors guessing: Will the Fed cut rates, hold steady, or—worst case—hike again?
Between trade wars and stubborn inflation, uncertainty is running high, and that dynamics breeds volatility. But a correction doesn’t mean the market is broken—it just means sentiment has shifted.
⚠️ How NOT to React (aka: Rookie Mistakes to Avoid)
When corrections hit, bad decision-making is at an all-time high. Here’s what not to do:
Panic selling – Selling at the bottom is a classic rookie move. If you weren’t planning to sell at the highs, why dump everything when it’s down?
Trying to time the exact bottom – Good luck. Nobody, not even Warren Buffett, can catch the bottom (not that he’s trying). If you’re waiting for the “perfect” dip, you’ll likely miss the rebound.
Going all-in on one asset – Thinking of putting everything into one stock or crypto because it’s “cheap” now? Please don’t. Diversification exists for a reason .
Getting glued to financial news – Watching every market update during a correction is like doom-scrolling Google after a mild headache—you’ll only freak yourself out more.
Now that we’ve covered what not to do, let’s focus on the smart plays.
💪 So, What Should You Do?
If you want to come out of a correction with your sanity (and portfolio) intact, here’s your game plan:
1️⃣ Zoom Out—Corrections Are Temporary
The market moves in cycles, and corrections are just part of the game. Historically, corrections last a few months, while bull markets last years. If you’re investing for the long term, a correction is a blip on the chart, not an extinction event.
2️⃣ Review Your Portfolio Like a Hedge Fund Manager
Corrections are a great excuse to audit your holdings. Ask yourself:
Is this stock/ETF/index still worth holding?
Has anything fundamentally changed, or is this just temporary market noise?
Do I have too much exposure to one sector?
Think of it as spring cleaning for your investments. It's also an opportunity to make some good use of the handy Stock Screener or Stock Heatmap to spot the best (and worst) performers. If something was a FOMO buy and doesn’t belong in your portfolio, consider trimming it.
3️⃣ Buy Selectively, Not Blindly
Corrections create opportunities, but that doesn’t mean you should just throw money at every stock that’s down. Some companies deserve their declines ( looking at you, Nikola )—others are just collateral damage in a broader selloff.
Look for quality companies with strong earnings, manageable debt, and real growth potential. If they were solid before the correction, they’ll likely recover faster than the overhyped names.
Example: Remember when Amazon stock NASDAQ:AMZN tanked 90% in 2000, the dot-com bubble? No, because you were too busy being 2 years old instead of loading up on Jeff Bezos’s dream. And look where the guy’s now.
4️⃣ Do Some Good Old DCA
Instead of dumping all your cash into the market at once, use dollar-cost averaging (DCA). Buying in small increments at regular intervals helps you avoid the stress of trying to time the bottom. If prices drop further, you can buy more at an even better price.
5️⃣ Keep Emotions in Check
Corrections test your patience and discipline. The best investors don’t let fear dictate their strategy. If you’re getting emotional about your trades, step away from the screen and take a breath. The market will be there when you come back.
👍 The Market Always Bounces Back—Eventually
Every correction feels like the worst one while it’s happening. But let’s look at history:
The S&P 500 has faced 30+ corrections since 1950. It survived them all.
The average correction lasts four months before a recovery begins.
After a correction, markets typically rally higher within a year.
Unless you believe the global economy is permanently broken (hint: not yet, at least), every major downturn has eventually turned into a new bull run.
🦸♂ Final Thought: Be the Hero, Not the Victim
Market corrections separate the professionals from the wannabes. The people who panic and sell at the bottom? They usually regret it. The ones who keep a level head, stick to their strategy, and take advantage of good opportunities? They come out stronger.
And finally, if you need to take away one thing it’s this: Corrections aren’t the enemy. They’re the price of admission for long-term gains.
👉 Let’s hear it from you!
How do you handle corrections, what’s your strategy when the market is in a downturn and what’s in your portfolio then? Share your experience in the comment section!
Trading GER30 on Tariff DayToday will be a big day for the stock market in 2025. The tariffs to be implemented promises to either make or break the market.
Last week we saw a massive sell off and on Monday and Tuesday we have seen the markets gain a decent amount. However here is what needs to be noted for all indexes:
1) The Daily downtrend is intact
2) The H4 MA is pointing down
3) On GER30,we see a bat pattern to sell
4) H1, M30, M15 is OB and has a double top
We should not follow the news, but instead focus on the charts. Based on this, we will enter a short position and expect the market to resume the downtrend.
Stop loss will be 200 pips around 25700. Good luck!

NFP + tariffs = market chaos? In addition to tariff rumors, reports, and retaliations, this week’s Nonfarm Payrolls (NFP) could add even more volatility to markets.
Gold continues to hit record-high after record-high (best quarterly performance since 1986), could be the most important asset to watch.
The market consensus expects the US economy to have added 128,000 jobs in March, down from February’s 151,000.
Danske Bank is more cautious, perhaps responding to Consumer confidence deteriorating to its lowest level since 2013, projecting just 110,000.
Trading Economics is even more bearish, forecasting an increase of only 80,000 jobs. What do they know that others don’t? If they're right, markets may not be priced for it.
