Reciprocal tariffs teased, markets react President Donald Trump has just signed a sweeping reciprocal tariff plan. The directive instructs the U.S. to develop new levies on a country-by-country basis but stopped short of implementing any immediate levies.
The Dow reached an intraday high after the market realized the reciprocal tariff process could take weeks or months. In forex, the biggest gainers have been the Japanese yen and the Swiss franc, although the British pound is performing well too.
Wells Fargo predict that the tariffs could slow economic growth this year, describing them as a “modest stagflationary shock”. A study from the Peterson Institute estimates that existing import tariffs on Chinese, Mexican, and Canadian goods already cost the average American household over $1,200 annually, with reciprocal tariffs likely adding to that burden.
Tariffs

$GOLD EASES FROM RECORD HIGHS AHEAD OF U.S. INFLATION DATAGOLD EASES FROM RECORD HIGHS AHEAD OF U.S. INFLATION DATA
1/7
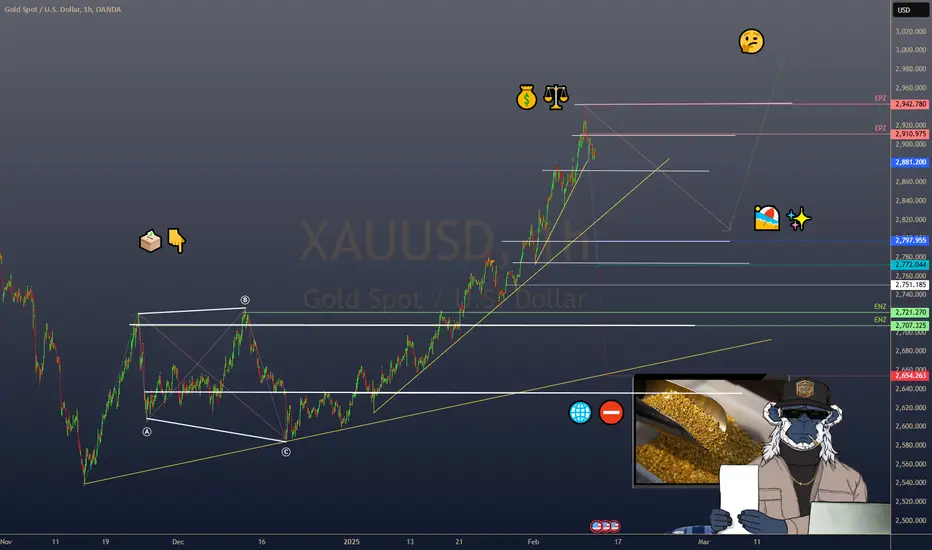
Gold hit a record high of $2,942.70/oz on Feb 11, fueled by safe-haven demand amid fresh U.S. tariffs. Today, it’s dipped 0.2% to $2,892.50 as investors take profits and watch U.S. inflation data. Let’s dig in! 💰⚖️
2/7 – RECENT PRICE ACTION
• All-time high at $2,942.70/oz—sparked by President Trump’s 25% tariffs on steel & aluminum
• Spot gold now at $2,892.50 (↓0.2%), with futures at $2,931.40 (↓0.1%)
• The rally’s paused—are we in for a short breather or a bigger correction? 🤔
3/7 – TARIFF TENSIONS
• 25% tariffs raise global trade war fears, boosting gold’s safe-haven appeal
• Markets worried about inflation, as import costs could climb
• Gold remains a hedge against economic uncertainty and currency devaluation 🌐⛔️
4/7 – MACROECONOMIC DRIVERS
• Fed Chair Powell’s hawkish comments on rate policy sent gold lower—higher rates often weigh on non-yielding assets
• U.S. inflation data (due soon) could shape the Fed’s next move—any upside surprise might strengthen the dollar, pressuring gold further
5/7 – INVESTOR SENTIMENT
• Profit-taking: After a massive run-up, traders might lock in gains
• Safe Haven: Still an underlying bullish sentiment if tariffs escalate
• The $2,900–$2,950 range is in focus—will gold consolidate or stage another breakout?
6/7 Where’s gold heading next?
1️⃣ Above $3,000—safe haven demand remains strong ✨
2️⃣ Sideways around $2,900—pausing for data 🏖️
3️⃣ Back under $2,850—hawkish Fed sinks gold ⬇️
Vote below! 🗳️👇
7/7 – STRATEGY WATCH
• Short-Term: Watch U.S. inflation data & dollar moves—gold typically moves opposite the greenback
• Long-Term: If tariffs stoke inflationary pressure, gold may shine even brighter. Keep an eye on geopolitical developments! 🌎
Gold Wave 5 Bull Complete?! (UPDATE)Gold has been absolutely crazy since market open last night! With a huge 350 PIPS move up on market open, price crashed back down 600 PIPS overnight. This impulse move down is a strong indication the top for Wave 5 could be in.
Time for market structure to form its corrective phase now📉

DeepSeek Is Not What the Market FearsWith the emergence of DeepSeek, tech stocks have generally dropped by 6% over these few short days across all US indices, but from the peak in late November to December, we saw a much more massive drop among all of them.
The Russell 2000, representing small and medium-sized enterprises in the U.S., declined by 12%,
What triggered this sell-off in the tech giants (Nasdaq), the old guards (Dow Jones), the suite of blue-chip stocks (S&P 500), and the medium-sized firms (Russell 2000)?
Markets are inter-connected. What should we be looking out for, and how should we navigate if the market break below this recent all-time low?
E-mini S&P 500 Futures & Options
Ticker: ES
Minimum fluctuation:
0.25 index points = $12.50
Micro E-mini S&P 500 Futures & Options
Ticker: MES
Minimum fluctuation:
0.25 index points = $1.25
Disclaimer:
• What presented here is not a recommendation, please consult your licensed broker.
• Our mission is to create lateral thinking skills for every investor and trader, knowing when to take a calculated risk with market uncertainty and a bolder risk when opportunity arises.
Trading competition: www.tradingview.com
Trading the Micro: www.cmegroup.com
CME Real-time Market Data help identify trading set-ups in real-time and express my market views. If you have futures in your trading portfolio, you can check out on CME Group data plans available that suit your trading needs www.tradingview.com

Gold's Parabolic Momentum After the FOMC CrashGold has entered full acceleration mode, displaying a textbook parabolic move following the recent FOMC-induced volatility. After an initial shakeout that saw weak hands liquidated, price has rebounded with unrelenting bullish momentum, carving out higher highs with surgical precision.
This parabolic curve reflects strong institutional demand, as each shallow dip is aggressively bought up, confirming that buyers remain firmly in control. The angle of ascent is steepening, signaling that we may be entering the euphoric phase of this trend.
Key levels to watch:
📈 If momentum sustains, the next logical targets could be previous key resistance zones or Fibonacci extension levels.
📉 A break of the parabolic curve could signal exhaustion and bring a deeper correction before the next leg up.
Is gold setting up for a blow-off top, or does this rally have more fuel left? Drop your thoughts below! 👇🔥 #Gold #Momentum #FOMC #Trading

Dollar Index Bullish to $111.350 (UPDATE)The Dollar bulls have started this week bullish, alongside Gold. Both markets currently are moving with a positive correlation, which don't happen very often.
We are still within our 'Wave 5' bullish move & we expect this move to carry on towards $111.350✈️

Australia dollar eyes confidence dataThe Australian dollar has started the week with gains. In the North American session, AUD/USD is trading at 0.6275, up 0.60% on the day.
Australia releases business and consumer confidence on Tuesday, with the markets expecting some improvement. Westpac Consumer Sentiment is expected to rebound and gain 0.4% in February after a 0.7% decline in January. The National Australian Bank business confidence index is projected to improve to zero in January, after a -2 reading in December.
China's inflation was a mix, as consumer inflation rose to a five-month high while producer inflation continued to decline. CPI jumped 0.5% y/y in January, up from 0.1% in December and above the market estimate of 0.4%. This was the highest level since August. Monthly CPI rose 0.7%, up sharply from zero in December and an 11-month high, but shy of the market estimate of 0.8%
The producer price index fell 2.3% y/y in January unchanged from December and deeper than the market estimate of 2.1%. This points to deflation which is likely to worsen if the trade war between the US and China continues. On Monday, China's retaliatory tariffs kicked in after the US hit China with tariffs last week.
US nonfarm payrolls decelerate, unemployment falls
US nonfarm payrolls eased to 143 thousand in January, shy of the market estimate of 175 thousand. Still, there weres signs of strength in the labor market - nonfarm payrolls were revised by 100 thousand in the previous two months and the unemployment rate ticked lower to 4% from 4.1%, below the market estimate of 4.1%.
Average hourly earnings rose 0.5%, up from 0.3% in December and above the market estimate of 0.5%. Annually, average hourly earnings rose 4.1%, unchanged from the revised December reading and above the market estimate of 3.8%. The generally positive employment report supports the case for the Federal Reserve continuing to hold rates, possibly until the third quarter. Just a few months ago, it appeared that the Fed would stay aggressive and continue lowering rates into 2025, but with the economy purring along we might see only one or two rate cuts this year.
There is resistance at 0.6351 and 0.6430
There is support at 0.6220 and 0.6141

Gold NEW ATH to $2,912?! (1H UPDATE)ABSOLUTELY BEAUTIFUL move on Gold overnight! Price has pumped up from our supply zone & so far running 370 PIPS in profit. Close to hitting ATH of $2,900🔥
Called this live, so you should all be in this trade & in profit!

$SPY: Three timeframe analysis, One Chart Pattern, Sentiment📢!Hey there!
#Tariffs negative news drives bearish sentiment. Is it just mass media noise? And Mr. Market will continue up?
WHY?
Let's have a look at the charts:
1. 📈We are in a bullish trend on a weekly and monthly basis, meaning long-term and mid-term, yet in a bearish on a daily one, a ka short-term
2. 🤓The bullish Flag pattern has formed. Yeah, I know; how do you qualify it? For this theoretical exercise only visually, but for anything more serious, Bukowski starts, or you may want to run your own tests.
3. 🍒And the cherry on top: Bearish sentiment is significantly higher than the historical average, standing at 42.9% (2/5/2025) compared to 31.0%. On my side, it means that we might be in for a heavy short squeeze for a couple of days.👋Just observations, not advice
For now, enjoy Super Bowl Sunday! 🏈
S ource of the screenshot: AAII Investor Sentiment Survey, www.aaii.com

China - U.S. Tariff Trade War!🩸China has slapped the U.S. with 10% tariffs on Energy products & automobiles as a retaliation🩸
China’s tariffs on U.S. energy & cars will hurt American exporters by reducing demand & pushing down prices, affecting profitability. Energy producers may struggle with oversupply, while automakers like Tesla and Ford face declining sales in China.
The move escalates U.S.-China trade tensions, discouraging investment and increasing market volatility. While lower energy prices could help inflation, job losses in key industries may offset any benefits.
U.S. policymakers might respond with countermeasures. If tensions rise further, a broader trade conflict could emerge, increasing risks for the global economy.

EURUSD 10-14 Feb 2025 W7 - Weekly Analysis - US CPI/PPI/PowellThis is my Weekly analysis on EURUSD for 10-14 Feb 2025 W7 based on Smart Money Concept (SMC) which includes the following:
Market Sentiment
Weekly Chart Analysis
Daily Chart Analysis
4H Chart Analysis
Economic Events for the Week
Market Sentiment
Mixed Labor Market Signals
The February 7 NFP report showed 143K new jobs (below expectations of 170K), signaling potential cooling in the labor market. However, strong wage growth (0.5% MoM, 4.1% YoY) and a 4% unemployment rate (down from 4.1%) suggest lingering inflationary pressures.
Markets may interpret this as a "Goldilocks" scenario: cooling job growth could delay Fed rate hikes, but elevated wage inflation keeps stagflation risks alive.
Tariff Volatility and Trade Uncertainty
Trump’s tariffs (10% on China, delayed 25% on Canada/Mexico) dominate market psychology. While tariffs are a negotiation tool, their sudden implementation and reversal create uncertainty. For example:
Automotive and energy sectors face direct risks due to integrated North American supply chains.
Consumer goods (e.g., electronics, produce) may see price hikes, amplifying inflation fears.
Retaliatory measures from China add to global trade tensions.
Week major news events
Fed’s Powell testifies
ECB Lagarde Speech
US CPI, PPI and Retail Sales
EU GDP
Given the forecasts and the recent NFP report showing slower job growth, market sentiment could be cautious. If the CPI and PPI readings come in higher than expected, it could reinforce concerns about inflation and lead to USD Strength. Investors might seek safe-haven assets.
Conversely, if the CPI and PPI readings are in line with or lower than expectations, it could provide some relief to the markets and support a more positive sentiment which will lead to Weaker USD.
Weekly Chart Analysis
1️⃣
🔹Swing Bearish
🔹Internal Bearish
🔹In Swing Discount
🔹Swing Continuation Phase (Pro Swing + Pro Internal)
2️⃣
🔹INT structure continuing bearish with iBOS following the Bearish Swing. (End of 2023 till end of 2024 was a pullback phase after the first bearish iBOS)
3️⃣
🔹After the bearish iBOS we expect a pullback, price tapped into Monthly Demand and the liquidity below Nov 2022 which is above the weekly demand formed with the initiation of the bearish iBOS pullback phase.
🔹Price made a bullish CHoCH which indicated that the liquidity was enough as per previous week analysis to initiate a pullback phase for the bearish iBOS.
🔹Price pulled back after the Bullish CHoCH to the Weekly Demand formed and showed reaction after a volatile week.
🔹Price still looking bearish to target the Weak INT low to target the Weekly unmitigated demand. Ultimately targeting the Swing Weak Low.
🔹Noticing that the Bearish INT Low didn’t pullback to at least the INT Structure EQ (50%) so there is a chance that price could hold the current Weekly Demand to fulfil the i-BOS pullback phase which will require MTF to confirm this scenario.
🔹Expectation is set to Bearish continuation targeting the Weak INT Low and the unmitigated Weekly Demand.
Daily Chart Analysis
1️⃣
🔹Swing Bearish
🔹INT Bearish
🔹Swing Continuation Phase (Pro Swing + Pro Internal)
2️⃣
🔹Following the Bearish Swing BOS, INT Structure continuing bearish tapping the weekly demand zone.
3️⃣
🔹After the failure to close below the Weak INT Low, price continued bullish sweeping the liquidity above Dec 30 and mitigating a Daily supply zone within the INT Structure Premium Zone.
🔹With the mitigation of the Daily supply, price created a Bearish CHoCH signaling the end of the Pullback Phase of the INT structure and the start of the Bearish move targeting the Weak INT Low.
🔹Price failed for the 2nd time to close below the Weak INT Low after mitigating the Daily Demand formed from the failure to close below the Weak INT Low which triggered aggressive Bullish reaction and mitigating the Daily Supply Zone formed from the recent Bearish CHoCH.
🔹After Supply mitigation, price continued Bearish following the Bearish INT Structure continuation phase.
🔹Expectations is price to continue Bearish to target the Weak INT Low and hopefully we get a confirmed close which is fulfilling the Weekly target of continuing Bearish.
🔹Notice that if the Daily formed a Bullish CHoCH (Currently above the recent mitigated Supply) this will shift my outlook to the Weekly Scenario of a deep pullback of the Weekly INT Structure to at least the Structure EQ (50%). MTF required to shift Bullish to confirm.
4H Chart Analysis
1️⃣
🔹Swing Bullish
🔹INT Bearish
🔹Reached Swing Extreme Demand
🔹Swing Continuation
2️⃣
🔹With the deep pullback to the Bullish Swing extreme discount and mitigating the 4H/Daily demand zones, price turned Bullish forming a Bullish CHoCH.
🔹The current Bullish move from Swing extreme discount to current price level having 2 scenarios:
Scenario 1: Pullback for Bearish INT Structure and with the recent Bearish CHoCK and Minor Demand zones are failing, I expect Bearish continuation to target the Weak INT Low which aligns with the Daily/Weekly Bearish Structure/Move. (Counter Swing – Pro Internal)
Scenario 2: Bullish Swing continuation to target the Weak Swing High. Which requires to have Demand holding and Supply failing. The first sign required to confirm this scenario will be the current Demand which price is currently at to hold and we form a Bullish CHoCH. (Pro Swing – Counter Internal)
3️⃣
🔹Expectations is set to Bearish to target the Weak INT Low as long LTFs are staying Bearish.
Economic Events for the Week

USoil is at right spot to go long !!!Level 70.50 going to be crucial
70-71 being the area which was long before a resistance on higher time frame now could be acting as support which has good probabililty along the way price also tapped into unmitigated demand zone which might be clearing the leftover supply that came from top
on the long side we can aim at the target of 74.50 which is almost 5%
and 77.50 which is 10%
so USOIL could be good bet for swing trade

EURUSD 5 Feb 2025 W6 - Intraday Analysis - EU PPI - US ADP/PMIThis is my Intraday analysis on EURUSD for 5 Feb 2025 W6 based on Smart Money Concept (SMC) which includes the following:
Market Sentiment
4H Chart Analysis
15m Chart Analysis
Market Sentiment
Investors remain cautious but are gradually finding footing after recent bouts of volatility linked to aggressive trade measures and policy uncertainty. The sentiment can best be described as a mix of risk aversion amid global trade tensions and a tentative willingness to engage as economic data remains broadly resilient.
The U.S. dollar has experienced modest strength but remains under pressure due to the broader uncertainty in trade dynamics and the potential for escalating tariffs, particularly from ongoing actions against major trade partners even with pause of tariffs on Canada and Mexico. The target is Europe.
Federal Reserve Outlook:
While the recent policy stance has been one of a pause, the Fed is expected to continue monitoring inflationary trends closely. Any future adjustments to monetary policy are likely to be data-dependent, with the current sentiment suggesting that policymakers will remain cautious amid trade-induced uncertainties.
4H Chart Analysis
1️⃣
🔹Swing Bullish
🔹INT Bearish
🔹Reached Swing Extreme Demand
🔹Swing Continuation
2️⃣
🔹With the Bearish iBOS, price confirmed the Swing pullback phase.
🔹We reached the Swing extreme demand which triggered a V-shape reaction indicating the bullish continuation.
🔹Price is currently targeting the liquidity (CHoCH) at 1.04342 (15m Swing High).
3️⃣
🔹Expectations is set to continue Bullish for the Bullish 4H Swing Continuation after reaching the Swing Extreme Demand.
15m Chart Analysis
1️⃣
🔹Swing Bearish
🔹INT Bullish
🔹Swing Pullback
2️⃣
🔹Swing turned bearish signaling the 4H/Daily bearish continuation.
🔹After a BOS we expect a Pullback, price pulled back with series of Bullish INT structures reaching the 4H Supply and the 15m Swing extreme.
🔹While the 4H Swing Structure is Bullish, 15m Swing still Bearish.
3️⃣
🔹Expectations is set to continue bullish to sweep the 4H liquidity (Forming a Bullish

Tariffs and Their Influence on GoldWe observed how gold has pivoted upward so precisely each time tariffs were applied since the start of the trade war in 2018.
Before the trade war, gold remained stagnant within this range. However, with the onset of the trade war, everything changed for gold.
We will conduct a case study since 2018, analyzing how gold has reacted to each significant tariff imposed.
With the latest proposed tariffs on Canada and Mexico, what could be the potential trend for gold, and how should it be managed above the current level?
Gold Futures & Options
Ticker: GC
Minimum fluctuation:
0.10 per troy ounce = $10.00
Micro Gold Futures & Options
Ticker: MGC
Minimum fluctuation:
0.10 er troy ounce = $1.00
1Ounce Gold Futures
Ticker: 1OZ
Minimum fluctuation:
0.25 per troy ounce = $0.25
Disclaimer:
• What presented here is not a recommendation, please consult your licensed broker.
• Our mission is to create lateral thinking skills for every investor and trader, knowing when to take a calculated risk with market uncertainty and a bolder risk when opportunity arises.
CME Real-time Market Data help identify trading set-ups in real-time and express my market views. If you have futures in your trading portfolio, you can check out on CME Group data plans available that suit your trading needs www.tradingview.com

$BTC Hit Our Target to Perfection!I dunno bros, maybe I was a fortune teller in my past life 🙇
Still need CRYPTOCAP:BTC price to close a few days above the 9 and 20DMAs and a crossover to happen.
Showing lotsa strength tho.

USD/CAD got absolutely 'hammered' on MondayTrump's trade negotiations provided USD/CAD with its most volatile daily range since the height of the Pandemic. Yet the surprise announcement that Trump is pausing Canada's tariffs for 30 days saw prices reverse sharply lower, to close the day with an elongated bearish hammer.
Does that pave the way for an immediate reversal lower? Not necessarily. Using price action and market position, I explain why.
Matt Simpson, Market Analyst at City Index and Forex.com

EUR/USD slides on tariff turmoil, euro CPI risesThe euro has weakened at the start of the new week. EUR/USD slumped over the weekend and dropped as low as 1.0141, its lowest level since Nov. 2022. The euro has recovered somewhat on Monday and is trading at 1.0277 in the North American session. Still, the euro has dropped 0.76% since Friday's close.
US President Trump hasn't wasted any time and imposed 25% tariffs on Mexico and Canada over the weekend, effective February 4. Mexico and Canada have both announced retaliatory tariffs in response. Earlier today, just one day before the tariffs were to take effect, the US announced that the tariffs against Mexico would be delayed for a month. The breather is good news, but the US could still find itself embroiled in a trade war with its two neighbors, in what is the world's largest trade zone.
Trump hasn't slapped the European Union with any tariffs yet, but said on Friday that he would "absolutely" go after imports from the EU. Global markets have been hit by fears of a global trade war resulting from the US tariffs and the US dollar is up sharply against most of the major currencies, including the euro.
Inflation in the eurozone ticked upwards to 2.5% y/y in January from 2.4% in December, above the market estimate of 2.4%. This was the highest CPI level since July 2024, driven mainly by a sharp jump in energy prices. Core CPI, which excludes food and energy prices, remained unchanged at 2.7% y/y for a fifth straight month, just above the market estimate of 2.6%. This is above the European Central Bank's 2% target but is the lowest level since January 2022. Services inflation, which is closely watched by the ECB, eased to 3.9% in January, down from 4% in December.
Today's inflation report affirms that inflationary risks remain and could complicate the ECB's plans to reduce interest rates and kick-start the weak eurozone economy. The ECB meets next on March 6.
EUR/USD has pushed above resistance at 1.0244 and is testing resistance at 1.0297
There is support at 1.0203 and 1.0175
www.tradingview.com

Trump’s Trade War Risks Throwing Markets into Chaos. TARIFFic?Apparently, Trump has slapped Mexico, Canada and China with hefty tariffs. Now all these three are either already retaliating with their own levies on US goods or getting ready to do so. The complex interplay of back-and-forth tariffs risks turning friends into foes and driving up prices. All the while the end consumer is likely to cover the difference.
President Donald Trump on Saturday actually went ahead and did what he wanted to do. He launched the game of tariffs. He hit Mexico, Canada and China with hefty import duties, threatening to throw the world’s trade into a spiral of ill intentions, retaliations and higher prices for your Stanley cups and iPhones.
The looming destabilization is already coming from both ends — Canada swiftly imposed 25% levies on roughly $20 billion of US goods coming into the country on Tuesday. Another $85 billion worth of goods are getting the same treatment within the next three weeks.
China, where nearly everything you get your hands on is made, said it will “take necessary countermeasures to defend its rights and interests.”
Trump’s new order requires Canada and Mexico to pay 25% tariffs on imports to the US (with a partial carve out for Canada’s energy and oil exports — 10% levies apply there). The US President was gearing up for a 60% tariff rate on China while he was running for office but said he’s imposing a 10% tariff that will likely get higher in time.
These three countries in 2023 collectively accounted for about 40% of all US imports. That year, the US imported about $3.85 trillion worth of goods. In November 2024, the US pulled in about $351 billion worth of stuff and then sold it to Americans.
What are tariffs and who pays them?
At the basic level, tariffs are a way for an economy to protect itself from foreign competition. Through tariffs, domestic businesses are somewhat shielded from outside interference and can snatch up a bigger portion of the local market.
Tariffs are just taxes placed on products that are made overseas and then imported to the country. Here’s the kicker: the foreign companies that make these goods and then import them aren’t on the hook for paying the tariffs — American businesses are.
Tech companies like Apple AAPL , which makes about 95% of its stuff in China, or Tesla TSLA , which makes half of its cars in China, will end up paying more for their products as they come into the US. Who’s collecting that import duty? The US government.
What could happen when these tariffs get cracking?
The US consumer will most likely cover the difference. Nearly every product will be affected — from cars to baby toys to the already expensive eggs (can egg prices get even higher?)
Here’s an example: potash, the product that’s used by US farmers as fertilizer, just got 25% more expensive. That extra cost, paid by the farmers, is likely to trickle down to the end consumer so farmers could keep trucking and produce at the same rates.
What could happen to the stock market?
One thing is certain — the companies that don’t pass on the added cost to the consumer will see their corporate profits dwindle. But if they want to keep generating value for shareholders, they’ll need to pass it forward to the end user. With the first quarter now well under way, the next earnings season will be a sight to see. (Friendly reminder to keep an eye on the economic calendar for all corporate earnings and updates.)
An analysis from Barclays estimates that all S&P 500 companies could see their profits shrink by 2.8% once the tariffs get in full flow.
Perhaps a bigger, scarier fallout is possible. Inflation can perk up again. Inevitably, the higher costs across the border risk undoing what the Federal Reserve was doing to combat inflation.
Goldman Sachs came out with the forecast that the looming tariffs could have an initial knock on effect on inflation to the tune of 0.7% to the upside. Gross domestic product could drop 0.4%.
And most of all, there’s one thing investors fear the most. Rising inflation could bring back interest rate hikes. A revival in consumer prices might prompt the Federal Reserve to walk back its intentions of more interest rate cuts and lean against the economy by raising borrowing costs.
There are early signs of this already. Fed chief Jay Powell last week said the central bank is in a wait-and-see phase as Trump’s policies unfurl.
The scary tariffs already knocked the wind out of stocks and crypto. Monday morning saw one of its worst openings in years, especially for Ethereum ETHUSD . The second-largest coin fell as much as 27% from the get-go as the bullish sentiment was nowhere to be seen.
Bitcoin BTCUSD also got a slap losing 6% in its first deals to settle near $91,000 before paring back some of the drop. And stock futures were looking at steep declines with Dow futures DJI shedding as much as 700 points ahead of the opening bell in New York. The only winner was the US dollar DXY , which stands to gain popularity in a high-tariff environment.
Until now, the market has been overwhelmingly on Trump’s side. He stepped into the White House riding on the promises of a strong economy and booming business. But if he takes aim (even indirectly) at shareholders’ profits, he might end up losing the support of all those billionaire executives who worked hard to get him elected.
What do you think? Is Trump acting in the best interest of America or is he driving markets into a ditch? Share your thoughts below!

DXY Analysis & ConsiderationsOverall Trend & Context:
Long-Term Uptrend: The DXY exhibits a clear uptrend from late 2023, indicating persistent USD strength.
Key Levels:
Resistance Zone (109.50 - 110.00): This zone has proven a challenge for the DXY to break decisively. A sustained break above this level is crucial for further upside.
Support Zone (107.00 - 108.00): This zone has provided support during pullbacks.
EMAs (25, 50, 100, 200 - 4-Hour Chart): The DXY is trading above all EMAs, a bullish sign. The 25 EMA is acting as dynamic support, and a bullish crossover (25 above 50) has occurred.
Potential Scenarios & Probabilities:
Bullish Breakout (High Probability) : The bullish EMA alignment favor an upside breakout above 110.00. Increased volume would confirm this scenario.
Pullback to Support/EMAs (Medium Probability) : A pullback towards the support line or the 25 EMA (around 108.80 - 109.00) is plausible, especially given the overbought RSI. This could offer a good long entry opportunity.
Breakdown Below Support (Low - Medium Probability) : A break below the support line and the EMAs would weaken the bullish outlook and could lead to a deeper correction.
Trading Considerations:
xxxUSD pairs - If the dollar goes up we should look for short positions.
USDxxx pairs - If Dollar goes up we can look for long positions.
A pullback to the support zones or the 25 EMA could offer a lower-risk long entry, provided these levels hold and there is sufficient demand on the USDxxx pair you're trading. (technicals should always be prioritized)
Consider placing stop-loss orders below key support/demand levels to manage risk.
Look for increased volume during breakouts or bounces off support to strengthen signals.
Watch for bearish divergence on the RSI as a potential bearish warning sign on the DXY.
Geopolitical Factors:
De-dollarization Efforts: Some countries are exploring alternatives to the US dollar for trade and reserves. While this is a long-term trend, any significant announcements or actions could impact the dollar's value.
Sanctions and Trade Policies: US sanctions and trade policies can influence the dollar's strength, particularly against the currencies of targeted countries. The US imposed tariffs are creating ripples right now.
Let's quickly look at what 'tariffs' are -
By now you should all know about the US imposed tariffs on several major trading partners including China, Canada and Mexico (and that they've retaliated with their own tariffs on US goods).
What does this all mean?
In the US any goods that are imported from Canada for example, will now cost more to the general public. To put it simply, the US is now charging a "handlers fee" and that will increase the overall price.
These tariffs are intended to encourage these countries to change their trade practices.
The tariffs have disrupted global supply chains, increased costs for businesses, and created uncertainty.
Make no mistake, this is without a doubt, a trade war.
Potential Impacts on the US Dollar:
Positive Impact:
Safe-haven demand: Increased global economic uncertainty due to the trade war could drive investors towards the US dollar as a safe-haven asset, increasing demand and its value. People will flock to the take no s#it protocols implemented by the Trump administration.
Reduced imports: If tariffs lead to a significant decrease in US imports, there could be less demand for foreign currencies to purchase those imports, indirectly increasing demand for USD. This means that trade conducted by the US will increase the overall Dollar output - thus making it seem more valuable. (If we assume the Trump administration is playing petty games, we're badly misinformed, we should assume that these are well calculated risks)
Negative Impact:
Reduced US exports: Tariffs can make US goods less competitive, leading to a decrease in exports. This can reduce foreign demand for USD, as fewer foreign buyers need dollars to purchase US goods.
Economic slowdown: The trade war could negatively impact economic growth in the US and globally. A slowdown in the US economy could make the dollar less attractive to investors.
Retaliatory tariffs: If other countries retaliate with their own tariffs on US goods, it can further dampen US exports and reduce demand for the dollar.
Trade Wars and Uncertainty:
The uncertainty and potential for escalation associated with trade wars can negatively impact investor confidence and lead to a flight to safety. While the USD is often seen as a safe haven, extreme uncertainty could lead investors to seek other safe-haven assets or reduce their overall exposure to USD (Right now Gold is something you should be looking into as a trader and investor).
Final Notes:
The technical picture is strong and does favour a breakout. But the geopolitical risks reduce the probability. Be prepared for fundamentals to override technicals in the short term.
Given the heightened risks, traders should be cautious and wait for clear confirmation signals before taking positions.
Closely follow news related to the debt ceiling, economic data, and geopolitical events.
Disclaimer: This analysis is for informational purposes only and does not constitute financial advice. Trading involves substantial risk and may not be suitable for all investors. Conduct your own research and consult with a financial advisor before making any investment decisions.

Bitcoin Down: Tariffs to Blame?I wake up to read that both equities are Bitcoin are down on Tariffs as the "reason." Is this true? More importantly, is knowing this valuable? I don't think so.
The media needs to write some narrative every day to get read and sell ads. So they take the latest buzz and craft it into a "reason" price moved the way it did. The trouble is that this information is is useless for traders and investors. Once the article is written the move has happened. There is nothing to profit nor more importantly LEARN from having this knowledge. It is a singular event; no long term consistent strategy can be crafted from a single thing happening once.
Bitcoin was already breaking down since January 20th. That day failed a big test of the prior All Time High. INDEX:BTCUSD has actually never closed higher than December 17th.
To emphasize the point more if one looks at the mainstream financial news they are also blaming today's equities route on tariffs. The truth is that stocks only seemed to have a bullish January. The S&P 500 futures never actually made a new high beyond the post-election pump in January.
Traders have to make plays BEFORE the news happens. The only way to do that is by watching charts for opportunities and reading the simple signs. Trade wisely!

EURUSD 3 Feb 2025 W6 - Intraday Analysis - Taste of Trade WAR!This is my Intraday analysis on EURUSD for 3 Feb 2025 W6 based on Smart Money Concept (SMC) which includes the following:
Market Sentiment
4H Chart Analysis
15m Chart Analysis
Market Sentiment
" Strike the bound, and the free will take heed "
Market Volatility and Geopolitical Strategy: Assessing the Implications of a Trump Presidency
Recent market movements underscore a critical narrative: A second Trump administration carries significant potential to reignite the trade policy volatility that defined his first term. Historical precedent offers a clear lens—within weeks of taking office in 2017, President Trump implemented tariffs on imports from Canada, Mexico, and China, upending decades of trade consensus. Investors initially dismissed these measures as negotiation tactics, but markets are now pricing in a more structural shift. As of this week’s open, risk-on sentiment reflects renewed acceptance of Trump’s uncompromising stance, particularly following his social media assertion that “the pain from tariffs will be worth the price.”
A Businessman’s Approach to Geopolitics
Trump’s career as a dealmaker suggests a presidency anchored in transactional realism. His administration’s “America First” doctrine—evident in the rapid escalation of the U.S.-China trade war—demonstrates a willingness to weaponize economic policy to recalibrate global alliances. This strategy aligns with a proverb often cited in Egyptian diplomacy: “Strike the bound, and the free will take heed.” By aggressively targeting key partners (the “bound”), the U.S. signals resolve to broader adversaries (the “free”), including Europe and emerging economies.
Strategic Outlook for Investors
With 205 weeks remaining in a hypothetical term, market participants should prepare for sustained turbulence. The 2018-2019 trade war eroded nearly $1.7 trillion in global equity value; a second iteration could prove more disruptive given today’s fragmented supply chains and inflationary pressures.
In conclusion, while Trump’s policies may inject short-term uncertainty, they also recalibrate the playbook for global engagement. Investors who disentangle rhetoric from actionable strategy will be best positioned to navigate this paradigm.
4H Chart Analysis
1️⃣
🔹Swing Bullish
🔹INT Bearish
🔹At Swing Extreme
🔹Swing Pullback
2️⃣
🔹With Risk-On sentiment, market opened with a gap down reaching the extreme Swing Low.
🔹The expected move is done with the market open. More development is required on LTFs.
3️⃣
🔹Expectations is to continue bearish as long the Risk-On sentiment is still active and no soft tone from Trump in regards to Tariffs.
15m Chart Analysis
1️⃣
🔹Swing Bearish
🔹INT Bearish
🔹Swing Pullback
2️⃣
🔹Swing turned bearish signaling the 4H/Daily bearish continuation.
🔹After a BOS we expect a Pullback, but currently the Risk-On sentiment is the main theme (Technical will follow sentiment) so not currently expecting a valuable pullback phase for the bearish BOS.
3️⃣
🔹Expectations is set for price to continue bearish and fulfill the Daily Bearish continuation.

Short Term Pain for Long Term GainAfter an amazing and wild week last week, I believe tomorrow will be the start of an even crazier one. Trump Tariffs, Oil and Gas up along with the US Dollar, while tech is on the verge of another break down. Will Bitcoin finally break below 89k, while Gold and Silver possibly break to the upside? Exciting times if you're ready for it.

$BTC Remains Bullish Despite Tariff FearsMarket is panicking over Tariff Wars, but ₿itcoin continues to remain in a bullish uptrend.
CRYPTOCAP:BTC got rejected hard at $104k on the Weekly, and has closed below the 9WMA.
Strong possibility of price trading $94-91k. A range for a few weeks might appear painful, but will give the market time to reset and accumulate all that liquidity for the next leg up.
Price is nowhere close to the 20 or 50WMA, so there’s nothing really to worry about structurally at this point.
The Bull Case is price is closing above the .382 Fib, so we could slingshot up if we get some bullish catalysts next week.
WHEN IN DOUBT, ZOOM OUT.
