TradeCityPro | Bitcoin Daily Analysis #31Welcome to TradeCity Pro!
Let's move on to Bitcoin analysis and important crypto indicators. In this analysis, as usual, I want to review the triggers of the New York Futures Session for you.
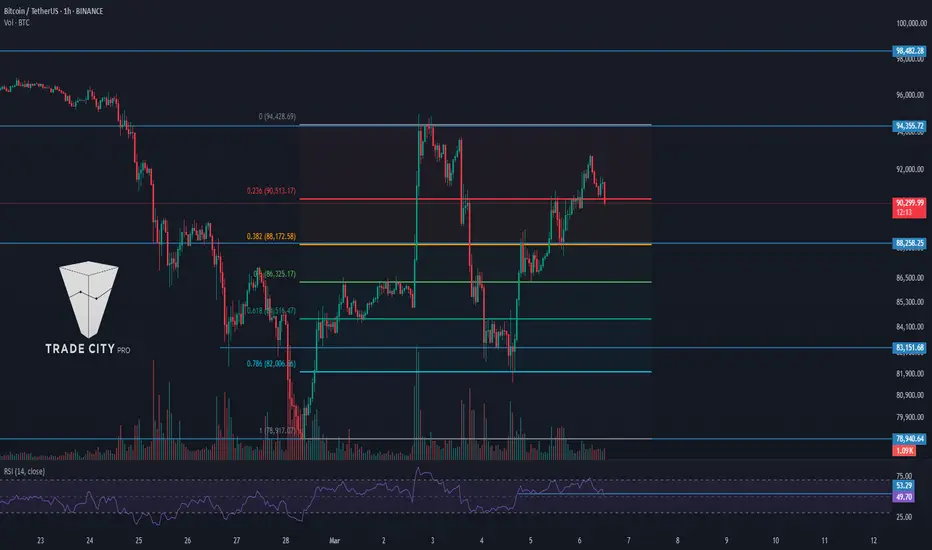
1-hour time frame
In the 1-hour time frame, after the price reached 77598, the fall ended and we witnessed an upward correction to the 83281 area.
The 83281 area has become a very important resistance and the price is reacting well to it. A reverse head & shoulder pattern is visible on the chart that has not yet been activated, and with the failure of the 77598 area, we will confirm the activation of this pattern.
If 77598 is broken, the price can move at least to the 83281 area. The next resistances are also within reach of the price, and if strong momentum enters the market, the price can register higher targets.
The buying volume in the market is much less than the selling volume, and the sellers' power is still greater than the buyers'. However, if the 83281 area is broken, this volume can be more in favor of the buyers and the price can move up.
For a short position, if the price rejects the 83281 area or if the failure of this resistance is faked, you can enter a short position with the trigger 81466 to the target 77598.
I have no more talk about Bitcoin, let's move on to the analysis of the indicators so that we can also check the conditions of the altcoins.
BTC.D Analysis
Let's move on to the analysis of Bitcoin Dominance, Dominance has finally stabilized above the 61.61 area and reached the 62.19 area. If this area is broken, Dominance can start its new upward leg.
If Dominance rejects this important ceiling, Dominance's downward leg can continue to 61.61. Dominance's main support is currently 61.08.
Total2 Analysis
Let's move on to Total2 analysis, as you can see, this indicator is at a lower level and has not yet reached the ceiling in the 1.04 area and has recorded its new resistance in the 1.01 area.
The reason for this is Bitcoin's dominance, which has become bullish and more money has entered Bitcoin than altcoins. However, if Dominance breaks 1.01, you can enter a position if Dominance falls.
For short, the first trigger is 984 and the main trigger is 953.
USDT.D Analysis
Let's move on to the Tether Dominance analysis, as you can see, Dominance has broken the trend line it had and is now ready to fall. If it breaks 5.30, you can get confirmation of Tether's Dominance falling.
To confirm Dominance's bullishness, we can get confirmation if it breaks 5.49, which means the market can fall and if these triggers overlap with the Total2 trigger, you can find an altcoin and open a position.
📝 Final Thoughts
Stay calm, trade wisely, and let's capture the market's best opportunities!
This analysis reflects our opinions and is not financial advice.
Share your thoughts in the comments, and don’t forget to share this analysis with your friends! ❤️
TCP

TradeCityPro | HBARUSDT Better Condition Than the Market!👋 Welcome to the TradeCityPro channel!
Let's go together and examine one of the popular coins in the market that has experienced less correction recently and is in better condition than other altcoins!
🌐 Overview Bitcoin
Before starting the analysis, I want to remind you again that we moved the Bitcoin analysis section from the analysis section to a separate analysis at your request, so that we can discuss the status of Bitcoin in more detail every day and analyze its charts and dominances together.
This is the general analysis of Bitcoin dominance, which we promised you in the analysis to analyze separately and analyze it for you in longer time frames.
📊 Weekly Timeframe
We go to the weekly time frame and see that hbar's condition is much better than other altcoins, and this is precisely due to the entry of momentum and Bitcoin's bullishness!
After we broke through the support at 0.04339 and engulfed the previous weekly candle, it was a bullish sign, and after the trigger at 0.06219 was activated, we broke this resistance and momentum entered this coin!
If you made your purchase in the spot section from this level, the situation is okay for now, but you can save profit or withdraw the principal capital. If you want to re-enter, you can make your purchase after the 0.33056 break.
📈 Daily Timeframe
In the daily time frame, we have higher levels and a better situation than the rest of the coins, and in a situation where most altcoins are forming lower bottoms, this has not even lost its main level.
After the 0.06470 and daily box break, we experienced a movement of about 500%, and if we draw a Fibonacci, we are currently at the 0.382 level, and this in itself increases the importance of this level! If the 0.37350 ceiling is broken, it shows us that we are going to experience a new movement!
This daily candle can be a good trigger to buy again, and the reason is that we are rising from a good support level and it is also a good Fibonacci level, but this trigger is risky and after the break of 0.26486 it will be a better trigger to welcome, and for a temporary exit, you can also temporarily exit with a break of 0.18653.
📝 Final Thoughts
Stay calm, trade wisely, and let's capture the market's best opportunities!
This analysis reflects our opinions and is not financial advice.
Share your thoughts in the comments, and don’t forget to share this analysis with your friends! ❤️

TradeCityPro | Bitcoin Daily Analysis #30👋 Welcome to TradeCityPro!
Let's dive into the analysis of Bitcoin and key crypto indices. As usual, today I will review the futures triggers for the New York session.
✨ Yesterday, our short trigger was activated, and we were able to open a good position. We also have a trigger today, so let's go through the analysis to check these triggers.
⏳ 1-Hour Timeframe
As I mentioned yesterday, if the break of the 83151 area was fake, you could have entered a position at the trigger of 821288, which indeed happened. This trigger was activated, and the price moved down to the area of 77598. Currently, the price has moved up again and has made a correction up to the 821288 area again.
💥 This trigger was for one-time use, and we opened a position with it yesterday, so I have removed it from the chart since we no longer need to use it and the price has not reacted to it anymore.
✅ Currently, I am waiting to see what new structure the price will form, from which area it will reject, and what structure it will create. For now, to consider a long position, we must first wait for this new structure to form. If this structure does not emerge, you can enter a long position if 83151 breaks again.
🔽 For short positions, the situation is quite clear: if the floor of 727598 breaks, you can enter a short position targeting 72753. An important note about the recent upward movement is that market volume is decreasing, indicating a weakness in the trend, and it seems that the power still lies with the sellers.
💫 The RSI has risen above the area of 50. If it goes back below 50, you can take that as a confirmation of momentum for a short position.
👑 BTC.D Analysis
Let's move on to the analysis of Bitcoin dominance. Finally, dominance has exited the small range box that was formed between the areas of 61.07 and 61.61, and it broke this box upwards as the market fell.
🎲 This situation caused the altcoins and indices like Total2 to fall more than Bitcoin itself. As you can see, dominance has approached the very important resistance area of 62.19. If dominance can stabilize above this area, the next resistance for dominance will be 62.66.
🧩 The trigger for Bitcoin dominance turning bearish is still the area of 61.61 for now.
📅 Total2 Analysis
As you can see, our trigger in the area of 1.01 was activated yesterday, and Total fell to $953 billion, finally falling below $1 trillion after a long time.
☘️ Currently, after the breakdown and the price reaching a lower support, we witnessed a reaction from the buyers that caused the price to rise slightly. Now it seems that the price is setting a lower high compared to its previous high. If this event occurs, with the break of the area of 953, we can open a short position.
⭐️ However, for long positions, I am currently waiting for the chart to form a new structure. If there is a sudden upward movement without significant structure formation, the only trigger for a long position remains the break of 1.01.
📅 USDT.D Analysis
Let's move on to the analysis of Tether dominance. As you can see, Tether dominance also experienced a breakout yesterday, breaking the area of 5.49 and moving upwards. The resistance that was above dominance was at 5.86, which dominance did not reach but came close before moving downwards again.
🧲 Currently, it seems that dominance has re-entered below the area of 5.49. If it can consolidate below this and break its ascending trendline, we can say that the increase in Tether dominance will finally halt. In this case, dominance could move lower, and the market might undergo a slight bullish correction.
❌ Disclaimer ❌
Trading futures is highly risky and dangerous. If you're not an expert, these triggers may not be suitable for you. You should first learn risk and capital management. You can also use the educational content from this channel.
Finally, these triggers reflect my personal opinions on price action, and the market may move completely against this analysis. So, do your own research before opening any position.

TradeCityPro | TWT: Navigating Trust Wallet's Market Moves👋 Welcome to TradeCityPro!
In this analysis, I'll be reviewing the TWT coin, a part of the Trust Wallet project, which is currently ranked 126th on CoinMarketCap with a market cap of $358 million.
📅 Daily Timeframe
As you can see in the daily timeframe, we're observing a very large range box from 0.7832 to 1.5725, where the price is currently near the bottom of this box.
✅ The floor of this box is a significant support range from 0.7832 to 0.8321 and is acting as a demand zone for the price.
🔽 Currently, the price has reached the 0.8321 area, tested it once with a shadow, and received support from it. If this area breaks, we'll enter the support zone, and we'll need to see how the price reacts to this zone.
📊 The market volume is very low, and for now, it seems there isn't enough strength and momentum in the market to break this area, but if a selling volume enters the market and the RSI goes into oversell, the likelihood of breaking this area increases. In this case, the next support will be at 0.6215.
🛒 For buying this coin, I recommend waiting until it exits the range box it has created, as this would indicate upward momentum entering the market. Currently, there is no momentum in the market. Thus, the best trigger from my perspective is the breakout at 1.5725.
📈 However, for a long position or a risky spot purchase, you could enter upon the breakout of 1.0556. I mainly consider this trigger for futures, and for spot purchases, I would wait until the main resistance is broken.
⏳ 4-Hour Timeframe
In the 4-hour timeframe, as you see, we had a box between 0.9395 to 1.0556, which has been cleanly broken from below, and you could open a short position with price consolidation below this area.
💥 Currently, the price has reached the next support at 0.8321 and has shown some reaction. The RSI is currently in oversell, and if it receives support from this area, it could return to the normal range.
📉 For short positions, the triggers at 0.8321 and 0.7832 are suitable. The 0.8321 trigger is riskier, and I suggest waiting until the 0.7832 support is lost before opening a more secure position.
🔼 For long positions, there's a very suitable ceiling at 1.0556, and breaking this area could lead to opening a long position.
📝 Final Thoughts
This analysis reflects our opinions and is not financial advice.
Share your thoughts in the comments, and don’t forget to share this analysis with your friends! ❤️

TradeCityPro | APTUSDT Market Drop on Trump News?👋 Welcome to the TradeCityPro channel!
Let's analyze and review one of the popular tier-2 coins together and take a look at this recent Trump news regarding the economic record
🌐 Overview Bitcoin
Before starting the analysis, I want to remind you again that we moved the Bitcoin analysis section from the analysis section to a separate analysis at your request, so that we can discuss the status of Bitcoin in more detail every day and analyze its charts and dominances together.
This is the general analysis of Bitcoin dominance, which we promised you in the analysis to analyze separately and analyze it for you in longer time frames.
📊 Weekly Timeframe
APT remains inside its large, volatile range, frequently bouncing between its highs and lows. However, this time, it has formed a lower high, which is not a positive sign.
Additionally, after breaking $7.78, sellers completely engulfed the weekly candle, and for the past five weeks, all candles have been red with high selling volume, confirming the downtrend.
There is no buy trigger at the moment, and I cannot recommend a buying opportunity until the market forms a new structure.
For selling, if APT drops below $4.97, it makes sense to exit and accept the loss instead of holding onto a losing position.
📈 Daily Timeframe
On the daily timeframe, APT failed to break the $14.61 resistance. Even worse, it couldn't even reach the previous high before getting rejected earlier, signaling weakness.
After breaking below $8.46, the market entered an MWC (Market Weakness Confirmation) downtrend.
Following the breakdown, a pullback retest occurred, and the daily candle engulfed the previous two days' candles, leading to further decline. Currently, APT is at $5.70, with RSI in the oversold zone, suggesting a possible short-term slowdown in selling pressure.
I personally feel that APT’s drop is sufficient for now, and we might enter a range here before a final move toward the $4.95 support. However, this does not mean it’s a buy signal. We need to wait for a new market structure before considering spot entries.
In the current situation, the market is really not very analytical and Bitcoin is likely to hit the $72,000-$74,000 level and then go for a break or bullishness, and you should pay attention to these market times! Don’t be FOMO!
📝 Final Thoughts
Stay calm, trade wisely, and let's capture the market's best opportunities!
This analysis reflects our opinions and is not financial advice.
Share your thoughts in the comments, and don’t forget to share this analysis with your friends! ❤️

TradeCityPro | Bitcoin Daily Analysis #29👋 Welcome to TradeCityPro!
Let's dive into the Bitcoin analysis and the key crypto indicators. In this analysis, as usual on Mondays, I will also review last week's weekly candle for you and examine the long-term scenarios.
📅 Weekly Timeframe
In the weekly timeframe, as you can see, the candle that closed yesterday is a completely bearish candle that registered without a shadow and a large body, and the price has again reached the 0.382 Fibonacci area.
✨ Since this candle was within the previous candle and did not show more volatility, we can say that the market will range in the upcoming candles because the volatility range of the chart has decreased. Therefore, the likelihood that the next candle will be a range is very high.
💫 However, if the market wants to fluctuate, the 0.5 and 0.618 Fibonacci areas, which overlap with the 75000 and 71000 areas, can act as supports in case of a decline. For a market upturn, the significant areas are 90000 and 104000.
📊 The market volume has also been bearish in the last two candles and in favor of the sellers, but an important point is in the RSI. The area at 44.20 is a very important support that has started the next upward leg each time the RSI has reached this area during this uptrend.
✅ Breaking this area in the RSI would mean the loss of market upward momentum and we would receive the first sign of a trend change.
📅 Daily Timeframe
In the daily timeframe, after breaking 92354 and the price pulling back to this area, the price has moved downward and has again reached the support range between the 0.5 and 0.618 Fibonacci.
🔽 If this range is lost, the price will move towards further support areas like 72753.
🎲 Market volume has also increased last week, which is because the price has finally exited the box between 92354 and 106283, and more volume has entered the market.
☘️ If the price is supported by the Fibonacci range and moves upwards, the main trigger for confirming a trend change will be 92354.
⭐️ The current main resistance area in Bitcoin is at 106283, and breaking this area could potentially lead to further movements and the recording of new ATHs.
⏳ 4-Hour Timeframe
In the 4-hour timeframe, as you can see, after breaking the trend line, the trigger was activated, and the price moved downward yesterday.
📉 I told you yesterday that the price could drop to the 83151 area. As you can see, this has happened, and the price has even fallen more than 83151 and now seems to be pulling back to this area.
Let's move to the one-hour timeframe to check today's triggers.
⏳ 1-Hour Timeframe
In the one-hour timeframe, as you see, after breaking 85552, the price made a downward move and dropped to around the 80000 area.
🔽 Currently, the price has moved towards the 83151 area and, after a fake break, has returned below this area.
🧩 If the price reacts to the 83550 area again, I will move the 83151 line, but if this break is a fake, a downward momentum could enter the market, and in this case, with the break of 81288, we can open a short position.
👀 The current main support that the price has is at 78940, and breaking this area would also register another corrective leg.
👑 BTC.D Analysis
Let's move to the analysis of BTC.D. As you see, yesterday dominance faked above its range box and after breaking 61.61 moved downward again, and now it can move downward with more momentum.
💥 The main trigger for the dominance to turn bearish is at 61.08; the next support in this case will be 60.40. For the dominance to turn bullish, our trigger remains the break of 61.61.
📅 Total2 Analysis
Let's move to the analysis of Total2. As you observe, after the support at 1.07 was broken yesterday, Total2 made another downward leg and reached its main support at 1.01. As you see, Total2 is at a lower level than Bitcoin because yesterday, as the market fell, Bitcoin dominance increased, causing altcoins to drop more than Bitcoin.
🧲 The trigger for opening a short position today is the break of 1.01, and for now, we have no trigger for a long position and must wait until the price creates a suitable structure for a long.
📅 USDT.D Analysis
Moving on to the analysis of Tether dominance, as you see, after breaking 5.14, we witnessed an upward leg that continued up to the ceiling of 5.50, and currently, a box has formed between 5.30 and 5.50.
🔑 If the 5.50 area is broken, we will see an upside expansion, and dominance might move towards higher targets. However, if dominance again falls below 5.30, it will move
❌ Disclaimer ❌
Trading futures is highly risky and dangerous. If you're not an expert, these triggers may not be suitable for you. You should first learn risk and capital management. You can also use the educational content from this channel.
Finally, these triggers reflect my personal opinions on price action, and the market may move completely against this analysis. So, do your own research before opening any position.

TradeCityPro | NOT: Tracing the Decline of a Telegram Titan👋 Welcome to TradeCity Pro!
In this analysis, I will review NOT, one of the Tap-to-Earn projects on Telegram, currently ranked 171 on CoinMarketCap with a market cap of $213 million.
📅 Daily Timeframe
In the daily timeframe, after this coin was listed in May last year, it initially had a strong bullish movement starting from 0.004733, reaching 0.022602, providing significant profits to its early investors.
🎲 However, after this rally, a downtrend started, and in the first bearish leg, the price dropped to 0.010029. In the next leg, the decline continued to 0.005699, where the price consolidated for a long time within a range box between 0.005699 and 0.010029.
✅ With the break of the 0.005699 support, the next bearish leg started. Since there were no further historical supports on the chart, I used the Fibonacci Expansion tool to determine potential support zones. As shown, the key support levels identified were 0.002516 and 0.003382, where the price formed another range box and consolidated for some time.
⚡️ After the break of the 0.002516 low, the price initiated another bearish leg, and the next potential support zones where the price may react are 0.001728 and 0.001071.
🔽 If you already have a short position on this coin, you can wait to see which level the price reacts to before taking profits.
🛒 For those considering buying this coin, I want to make it clear that I personally do not buy this coin in the spot market, and I also do not trade it in futures with my main capital. The reason is that this project lacks strong fundamentals—it was hyped within Telegram, which temporarily attracted liquidity. However, as you can see, this liquidity exited the market, leading to its current decline.
🔼 Nevertheless, if you still want to buy this coin, the first condition is to wait for a trend reversal.For now, the trend reversal confirmation level is the breakout of 0.003382. However, if the price forms higher highs and higher lows and we get Dow Theory confirmation, then a buy entry can be considered.
📝 Final Thoughts
This analysis reflects our opinions and is not financial advice.
Share your thoughts in the comments, and don’t forget to share this analysis with your friends! ❤️

TradeCityPro | Deep Search: In-Depth Of Uniswap👋 Welcome to TradeCity Pro
Today, we have a Deep Research on the Uniswap project. In this analysis, I will fully review this project. First, let's go over the project's details, and then I'll analyze UNI technically.
🔍 What is Uniswap?
Uniswap is a decentralized exchange (DEX) operating on the Ethereum blockchain that allows users to swap ERC-20 tokens without relying on traditional order books. Instead, it uses an Automated Market Maker (AMM) model, where liquidity providers add funds to pools and earn trading fees.
Uniswap was founded by Hayden Adams and launched in 2018. Since then, it has gone through multiple upgrades, with Uniswap V3 being the most recent version, offering improved capital efficiency.
🗝 Key Features:
Decentralized & Permissionless: No central authority controls trading.
Liquidity Pools: Users provide liquidity and earn a share of trading fees.
AMM Model: Uses the x*y = k formula to maintain price balance.
Non-Custodial: Users retain control over their assets.
No Listing Fees: Anyone can list tokens, unlike centralized exchanges.
🔍 UNI Token Overview
UNI is the governance token of Uniswap, allowing holders to vote on protocol upgrades and treasury decisions.
🔹Tokenomics
Total Supply: 1 billion UNI
Inflation Rate: After September 2024, a 2% perpetual annual inflation will be introduced.
Circulating Supply: UNI is released gradually over 4 years.
Current Circulating Supply: About 550M UNI
🔹Token Allocation
Governance: 45% - 450M UNI
Team: 21.3% -212.66M UNI
Investors: 18%- 180.44M UNI
Community Token Distribution:15%- 150M UNI
Advisors: 0.69%- 6.9M UNI
Now that we have reviewed the project, let’s move on to the chart to analyze it from a technical perspective.
🔹Uniswap’s Evolution: V1, V2, V3
Uniswap V3 Innovations
-Concentrated Liquidity: LPs can set price ranges for providing liquidity.
-Multiple Fee Tiers: Traders can select different fee levels (0.05%, 0.3%, 1%).
-Capital Efficiency: More precise liquidity allocation for better returns.
—
🔒Token Unlock & Vesting Schedule
Current Unlock Progress
- Unlocked: 55% (549.94M UNI)
- Untracked: 45% (450M UNI)
- Locked: 0% (All tokens are being tracked or unlocked)
—
🔹Vesting Schedule
Group - Vesting Duration - Unlock
Team : 47 months (ended Aug 2024) -2.08% monthly
Investors: 47 months (ended Aug 2024)- 2.08% monthly
Community Distribution:Fully unlocked- 100% at TGE
Advisors: 47 months- 2.08% monthly
⚠️Important: The untracked 450M UNI tokens can be unlocked at any time, making them a potential source of market volatility.
—
Uniswap Governance & DAO
The Uniswap DAO allows token holders to participate in protocol decisions.
Governance Process:
1) Proposal Submission – Requires 25,000 UNI votes to enter deliberation.
2) Consensus Check – Needs 50,000 UNI votes to proceed.
3) Final Governance Vote – 40M yes-votes required for approval.
Uniswap DAO Treasury
$1.6 Billion worth of assets.
Previously largest DAO, now second (behind BitDAO).
—
❗️Security & Risks
🔹Security Measures
1) Smart Contracts Audited – Regular security reviews.
2) Decentralized Governance – Protocol updates are voted on by UNI holders.
3) Non-Custodial – Users always control their own funds.
🔹Risks
1)Ethereum Gas Fees – High network congestion leads to expensive swaps.
2) Impermanent Loss – LPs may lose value if token prices shift.
3) Governance Risks – Power concentrated among whales.
4) Smart Contract Exploits – DeFi platforms remain high-risk targets.
🖼NFT Expansion – Uniswap Acquires Genie
Uniswap acquired Genie, an NFT marketplace aggregator, to integrate NFT trading into its ecosystem.
🔹Genie Features:
-Aggregates NFTs from multiple marketplaces.
-Batch NFT purchases in one transaction (reducing gas fees).
-Plans for USDC airdrops to early Genie users.
Uniswap had previously launched NFT-backed Unisocks (2019), linking real-world assets to NFTs.
—
👛Best UNI Wallets
MetaMask
Trust Wallet
Ledger
Coinbase Wallet
SafePal
Solflare
OKX Wallet
—
💲Uniswap Team & Key Investors
Hayden Adams: Founder & CEO
Mary-Catherine Lader: COO
Marvin Ammori: CLO
💵Major Investors
Coinbase Ventures
Defiance Capital
Paradigm
ParaFi Capital
Delphi Digital
💰Total Funding Raised: $188.80M
🎯Uniswap's 2025 Roadmap and UNI Token Developments
In early 2025, Uniswap introduced Uniswap v4, marking a pivotal evolution in its protocol. This version emphasizes developer flexibility through the integration of "hooks," modular plugins that allow for tailored functionalities such as dynamic fees and automated liquidity management. These enhancements position Uniswap v4 as a versatile platform for DeFi developers, fostering innovation and adaptability within the ecosystem.
Unichain: Uniswap's Layer-2 Scaling Solution
To address scalability and transaction efficiency, Uniswap launched Unichain, its proprietary Layer-2 solution, on January 6, 2025. Built on the OP Stack, Unichain aims to deliver faster transactions and reduced fees, enhancing the overall user experience. The mainnet launch follows a successful testnet phase that processed over 50 million test transactions, underscoring its readiness for broader adoption.
—
🔹Several reputable platforms for creating liquidity pools
Uniswap
Pancakeswap
Raydium
Shibaswap
Biswap
MDEX
Balancer
Thena
Quickswap
Defiswap
Honeyswap
Warden
—
🔹Certik: 94.28
📈On-Chain Analysis of UNI
Analyzing Uniswap’s on-chain data, we observe key trends in profit and loss positioning, whale activity, and network engagement:
Around the $7.40 price level, approximately 39.55 million UNI tokens are in a loss position, indicating a potential resistance zone. Meanwhile, support levels remain weak due to a lower volume of profitable tokens.
Large transactions show slight spikes during price declines, suggesting a lack of strong buying interest from major investors.
Whales hold 51% of the total supply, making their trading activity crucial. Currently, addresses with holdings between 100 million to 1 billion UNI and 10 million to 100 million UNI are engaging in selling, adding downward pressure on price.
Network activity, including active and new addresses, is on a declining trend, signaling reduced user engagement and transaction volume.
Based on on-chain metrics, there is no significant buying pressure or demand at the moment, raising concerns over short-term price recovery.
📊Uniswap TVL Analysis
Since early December, Uniswap's Total Value Locked (TVL) has shown a slight increase, rising from 1.72 million ETH to 1.94 million ETH. However, this growth remains considerably lower compared to the levels observed in 2021, reflecting a slower pace of liquidity accumulation.
Now that we have reviewed the project, let’s move on to the chart to analyze it from a technical perspective.
📅 Weekly Timeframe
In the weekly timeframe, we observe a long-term range-bound trend with a slight upward slope. Currently, the price is experiencing a downward move, with the primary support at 5.841.
💫 If this level breaks, the price may continue declining, and the next key support is at 4.025. On the other hand, if RSI does not drop below 38.74 and the price holds above 5.841, we can have more confidence in a potential price increase.
🎲 In this scenario, the key resistance levels are 11.638 and 18.794. The main trigger for buying is the breakout of 18.794, and the major sharp price movement will occur after breaking the ATH resistance at 42.92.
🔽 The critical support level that should not be lost is 4.025, as breaking below this level could result in a sharp bearish movement, and in that case, we will use Fibonacci tools to determine the bearish targets.
📅 Daily Timeframe
Now, let’s move to the daily timeframe for a more detailed view.
🔍 As seen in this timeframe, after price consolidation below 12.559, the second corrective wave has begun, and the price has currently fully retraced the previous bullish wave, reaching 6.670.
📉 If this level breaks, the next key supports are 5.556 and 4.025, with 4.025 overlapping with the 1.5 Fibonacci extension.
⚡️ If the price finds support at the current level, an appropriate trigger for a long position would be the breakout of 43.54 in RSI, which can serve as a momentum confirmation. Once RSI breaks this level, we can look at lower timeframes to define a precise entry trigger.
🔽 On the other hand, if RSI enters the Oversold zone, the likelihood of breaking 6.670 or even 5.556 increases.
🛒 For a spot buy, the current valid trigger is a breakout of the $10 level, which is the last local high in this timeframe. The exact number for this breakout level will be determined based on price action and its reaction when it approaches the area.
💥 If the price experiences further decline and establishes new highs and lows, the spot buy entry should be based on the breakout of the newly formed high in the downtrend.
📝 Final Thoughts
This analysis reflects our opinions and is not financial advice.
Share your thoughts in the comments, and don’t forget to share this analysis with your friends! ❤️

TradeCityPro | Bitcoin Daily Analysis #28👋 Welcome to TradeCityPro!
Let's dive into Bitcoin analysis and key crypto indices. As usual, I’ll review the futures session triggers for New York.
✨ Market conditions haven’t changed at all compared to yesterday, and Bitcoin has a ranging box that might break today.
⏳ 1-Hour Timeframe
As you can see, in the 1-hour timeframe, after breaking the trendline, the 85552 trigger is crucial. If this level is broken, it confirms the trendline break, which means the price could move toward lower support levels.
✅ Currently, the price has broken this area, and the RSI trigger has also been activated. If you opened a position with this break, I recommend waiting to see from which area the price gets rejected.
🔽 For a short position today, there isn’t really any specific trigger, so if you don’t have a position, you should observe for now. However, if the 85552 break turns out to be fake, bullish momentum could enter the market. In that case, you can enter a position with a break of 86949.
⚡️ I don’t have any other moves for Bitcoin because the short trigger is already activated, and today is Sunday, so there’s no need to focus too much on altcoins. Let’s move on to dominance analysis to assess altcoins' conditions.
👑 BTC.D Analysis
Looking at Bitcoin dominance, you can see that it is still ranging and hasn’t started any particular trend yet.
🧲 If 61.61 breaks, it confirms bullish dominance, while a break of 61.08 would confirm bearish dominance. The main range is between 60.40 and 62.19.
📅 Total2 Analysis
Checking Total2, just like Bitcoin, this index has also activated its entry trigger and is moving downward.
🎲 Currently, after breaking the 1.07 area, the next support level is at 1.01, and the probability of reaching this level is high. If this downward move turns out to be fake, the 1.09 trigger would be suitable for a long position.
📅 USDT.D Analysis
Looking at Tether dominance, you can see that after yesterday’s pullback to 5.08, the 5.14 trigger has been activated, and dominance is moving upward.
💫 The issue I mentioned yesterday was that there was no momentum, but now bullish momentum is visible. The target it can move towards is the 5.30 area.
📊 If the 5.14 break turns out to be fake, the 5.08 trigger would be suitable for confirming the fake break.
🧩 Overall, there aren’t any significant triggers in the charts today. If you didn’t open a position during the London session and want to have one, you should look for altcoins that haven’t activated their triggers yet.
❌ Disclaimer ❌
Trading futures is highly risky and dangerous. If you're not an expert, these triggers may not be suitable for you. You should first learn risk and capital management. You can also use the educational content from this channel.
Finally, these triggers reflect my personal opinions on price action, and the market may move completely against this analysis. So, do your own research before opening any position.

TradeCityPro | FILUSDT Continuing the Analysis of U.S. Coins👋 Welcome to TradeCityPro Channel!
Let’s analyze another coin with a U.S. base, which has the potential to be listed in ETFs in the future, as the U.S. currently has the most influence on the market!
🌐 Overview Bitcoin
Before starting the analysis, I want to remind you again that we moved the Bitcoin analysis section from the analysis section to a separate analysis at your request, so that we can discuss the status of Bitcoin in more detail every day and analyze its charts and dominances together.
This is the general analysis of Bitcoin dominance, which we promised you in the analysis to analyze separately and analyze it for you in longer time frames.
📊 Weekly Timeframe
We are still within the weekly box, and the coin’s situation is not very favorable, as it is currently fluctuating around its most important support level.
After failing to reach the top of the weekly box and facing an early rejection, the market has experienced a decline in recent price corrections. Currently, the price is fluctuating around 3.139, which is the most crucial support level at the moment.
From a price perspective, this is a good buying zone, but since the market is highly bearish, I personally wouldn't buy without confirmation. I'd prefer to let the price range a bit and form a structure, or wait for a strong green candle. Otherwise, my buy trigger would be a breakout above 9.899.
📈 Daily Timeframe
The main trend is still bearish, meaning we continue forming lower highs and lower lows. Currently, the price is ranging between 2.995 and 3.753.
After a rejection from 8.051, the price formed a support level at 4.836. However, after breaking this support and retesting it (which has now turned into resistance), the price engulfed the previous three candles, leading to a drop to 2.995.
If the price breaks above 3.573, the Fibonacci levels that we have drawn will act as strong resistance zones for further upward movement. The most important of these levels is 4.836, which previously caused a significant rejection.
For buying, the more the price ranges within the 2.995 - 3.573 box, the stronger the 3.573 breakout trigger will be. For selling, I recommend exiting below 2.995. If the price moves back above 3.573, you can reinvest with the same USDT amount, but in a smaller quantity of FIL, to manage your risk.
📝 Final Thoughts
Stay calm, trade wisely, and let's capture the market's best opportunities!
This analysis reflects our opinions and is not financial advice.
Share your thoughts in the comments, and don’t forget to share this analysis with your friends!

TradeCityPro | Bitcoin Daily Analysis #27👋 Welcome to TradeCity Pro!
Let's dive into the analysis of Bitcoin and the key crypto indices. Today, as usual, I want to review the important futures triggers for the New York session.
📰 Yesterday, Trump and Powell had speeches, but contrary to expectations, they didn't make any significant statements. As you can see, their remarks had little to no impact on the charts.
⏳ 1-Hour Timeframe
On the 1-hour timeframe, as observed, Bitcoin hasn’t reacted to yesterday’s events, and price action has been normal, with no unusual candles. Therefore, we will ignore the news and focus on our regular trading triggers.
✅ Currently, Bitcoin has broken the trendline formed yesterday and is near its trigger level at 85,552. Market volume is extremely low, which indicates that a big move is approaching. If this level breaks, a position can be opened.
📊 However, keep in mind that one reason for the low volume is that today is Saturday, a market holiday, meaning the price might continue ranging, and volume could drop even further.
📉 Regardless, the break of 85,552 is a crucial trigger, and if this level fails, Bitcoin could drop to lower supports like 83,151 and 78,940. Therefore, I will open a short position if this trigger is activated. The break of 37.93 on RSI will confirm this position.
🔼 For a long position, a major resistance has formed at 86,849, and if this level breaks, the trendline breakdown will be invalidated, and the price could push higher.
👑 BTC.D Analysis
Moving on to Bitcoin dominance, as seen on the chart, nothing has changed—BTC.D is still ranging.
⚡️ If BTC.D breaks below 61.08, it could drop to 60.40.If BTC.D breaks above 61.61, more capital will flow into Bitcoin.
🎲 Overall, BTC dominance has been ranging for a long time, making it hard to analyze. As a result, there aren't many scenarios to discuss.
📅 Total2 Analysis
Now, let’s analyze Total2 and find suitable triggers for this index.
⚡️ The trigger for this index has not yet been activated.For a short position, enter if 1.07 is broken.For a long position, the closest trigger is at 1.13.
📅 USDT.D Analysis
Moving on to Tether dominance, this index has finally confirmed a breakout above 5.08 and even pulled back to retest this level.
💥 However, as seen from the candles above this area, there is no strong momentum in either direction. The price has no clear upward or downward acceleration.
🌿 A strong bullish confirmation for USDT.D would be a powerful green candle closing above this zone.
🔽 A bearish confirmation would be a drop back below 5.08, which would serve as the first sign of weakness in Tether dominance.
❌ Disclaimer ❌
Trading futures is highly risky and dangerous. If you're not an expert, these triggers may not be suitable for you. You should first learn risk and capital management. You can also use the educational content from this channel.
Finally, these triggers reflect my personal opinions on price action, and the market may move completely against this analysis. So, do your own research before opening any position.

TradeCityPro | LDO: Comprehensive Market Analysis and Prediction👋 Welcome to TradeCity Pro!
In this analysis, I want to review LDO for you. It is one of the key DeFi platforms, and its token currently holds a market cap of $945 million, ranking 72nd on CoinMarketCap.
📅 Weekly Timeframe
On the weekly timeframe, we can see a range box between the $0.957 and $3.389 levels, where the price has been fluctuating for almost two years.
🔽 If you already hold this coin, I recommend activating your stop-loss in case the $0.957 level is broken and waiting for bullish momentum to re-enter the market before buying again.
📈 If the price holds above the $0.957 support, it could rally back toward the top of the range at $3.389. The key trigger levels between the current price and the top of the box are $1.447 and $2.488.
🚀 The main buying trigger is at $3.389, as breaking this level could lead to significant capital inflows, potentially initiating a long-term bullish trend.
📅 Daily Timeframe
On the daily timeframe, a range box between $1.447 and $2.387 had formed, which was broken to the downside, leading to a bearish leg. The main support level is $0.957, and if it fails to hold, the price could enter a new bearish cycle.
🛒 For spot buying, there isn’t a clear trigger yet, so we need to wait for a new structure to form. However, if the price rallies sharply, you could consider entering on a break above $1.489.
💫 As seen on the chart, the red candle volume is significantly higher than the green candles, indicating strong seller dominance. Additionally, the RSI is near the 30 level, and if it breaks below this zone, the bearish scenario becomes more likely.
📝 Final Thoughts
This analysis reflects our opinions and is not financial advice.
Share your thoughts in the comments, and don’t forget to share this analysis with your friends! ❤️

TradeCityPro | Bitcoin Daily Analysis #26👋 Welcome to TradeCity Pro!
Let's delve into Bitcoin analysis. Today is a pivotal day for the market with significant news and meetings that could greatly impact the market's future direction.
✨ Today, instead of dominance analysis, I want to explore the potential outcomes of today's sessions.
✅ The first session tonight is the Federal Reserve meeting where Jerome Powell will speak and announce the U.S. central bank's policies.
📈 In this session, if Powell announces a rate cut, we will definitely witness a market pump. This scenario seems plausible as U.S. inflation is currently under control, and there's no reason for an interest rate hike.
📊 If the interest rates are announced to remain steady and Powell indicates that no cuts are planned for a long duration, the market will likely fall. If the rates are raised, it will induce panic in the market, leading to significant drops.
⚡️ The next session is Trump's speech about the Crypto Reserve. Officially, it was decided yesterday that the U.S. will have a Crypto Reserve, but it will not enter the market as a buyer for now. Instead, it will introduce blocked funds, such as those from Silk Road, into this reserve.
🧲 Today's session where Trump speaks is crucial as it's the first time a U.S. president will hold a session specifically about crypto, making every statement he makes significant.
🔼 If he speaks positively about crypto, we will definitely witness a market pump, especially among American altcoins. Considering Trump himself owns a significant amount of crypto, it's highly likely he'll speak positively.
💫 On the other hand, there's no reason for Trump to speak negatively about crypto as it would undermine the enactment of the Crypto Reserve, which is very important to him.
💥 However, given the significant differences between Trump and Powell regarding crypto, these differing views could lead to unusual market volatility.
☘️ For instance, Powell might keep the interest rates steady or even increase them, which would cause the market to drop. On the other hand, to assert his influence, Trump might speak very positively about crypto, causing the prices to pump.
🔍 These manipulations in the short term lead to severe volatility and are not good for the market, but we need to see how these two sessions conclude and the statements made to carry out a long-term analysis.
📄 Here's a list of attendees at Trump's session:
🔹 Senior officials and figures from the crypto industry at the White House.
🔹 A crypto summit held by Trump at the White House on March 7th is one of the most significant events in history. The list of confirmed guests at this summit is as follows:
✅ Confirmed officials from the White House:
Bo Hines - Executive Director of the Presidential Advisory Council on Digital Assets
David Sacks - Special Advisor on AI and Digital Currencies
Mark Uyeda - Interim Chair of the U.S. Securities and Exchange Commission (SEC)
Caroline Pham - Interim Chair of the U.S. Commodity Futures Trading Commission (CFTC)
✅ Confirmed figures from the crypto industry:
Michael Saylor - Founder of Strategy
David Bailey - CEO of Bitcoin Magazine
Matt Huang - Co-founder of Paradigm
JP Richardson - CEO of Exodus
Kyle Samani - Managing Partner at Multicoin Capital
Zach Witkoff - Co-founder of Trump-linked World Liberty Financial
Sergey Nazarov - Co-founder of Chainlink
Brian Armstrong - CEO of Coinbase
Vlad Tenev - CEO of Robinhood
Arjun Sethi - CEO of Kraken
Kris Marszalek - CEO of Crypto.com
Brad Garlinghouse - CEO of Ripple
🎲In the unconfirmed section, notable names such as Vitalik Buterin, Scott Bessent, and Hoskinson are seen, though they have not been officially confirmed yet.
⭐️ Now that we've reviewed these sessions, let's move on to Bitcoin analysis to see what technical events might occur today.
⏳ In the 1-hour timeframe, it's clear that traders are waiting for Trump's and Powell's speeches to decide their actions based on today's meetings.
📈 I can't give you a specific trigger today because any position you open will be influenced by the news, and opening positions today is akin to gambling, entirely dependent on the statements made in the sessions.
🔽 If the news is negative, the important support areas are 86802, 83151, and 78940, which can prevent a price drop if the news is negative but doesn't induce panic.
📉 If the news causes panic, we might even see a 20% red candle, in which case no support levels will be respected, and we'll have to see when the market panic ends.
🔼 If the news is positive for the market, the significant resistance areas are 94355 and 98482, which can act as supply zones.
⚡️ That's all for today's analysis. Be very cautious with the market today, and I recommend that you closely monitor the market during the session to experience this significant event.
❌ Disclaimer ❌
Trading futures is highly risky and dangerous. If you're not an expert, these triggers may not be suitable for you. You should first learn risk and capital management. You can also use the educational content from this channel.
Finally, these triggers reflect my personal opinions on price action, and the market may move completely against this analysis. So, do your own research before opening any position.

TradeCityPro | Bitcoin Daily Analysis #25👋 Welcome to TradeCity Pro!
Let's dive into the analysis of Bitcoin and the key crypto indices. Today, I want to review the important futures triggers for the New York session. Yesterday, the market made an upward leg. Let’s analyze to see what triggers are suitable for today.
⏳ 1-Hour Timeframe
As observed in the 1-hour timeframe, following the activation of the trigger at 88258, the price moved upwards and broke through the 90513 area, and is currently pulling back to this area.
⚡️ An interesting point about the Fibonacci zones is that even now, as the price is projecting after correction, it is respecting the Fibonacci zones as resistance. As seen, breaking through each of these zones results in a short upward leg that can be traded in shorter timeframes.
✅ A negative aspect visible from yesterday till now is the divergence in volume, which is decreasing during upward legs and seems to increase during corrections, indicating a divergence.
📊 Given that the price has not yet reached the 94355 ceiling and is currently forming a lower peak relative to this area, breaking 90513 and 53.29 on the RSI could allow for a risky short position. Be cautious as this position isn't very secure due to the weak trend momentum, potentially preempting a trend change.
🔼 The primary short position can be entered upon the breach of 88258. This area is currently a significant support, and if the price consolidates below this area, it could move towards 83151.
🛒 For long positions, the only trigger we currently have is 94355, and I can't provide an earlier trigger because the price is very close to this area. Taking a long position before this area is breached might lead to a stop-out. However, if you're eager for a long position and a pullback to 90513 is confirmed, you might consider entering a very risky long position.
🔑 If you already have multiple open positions from previous triggers, you might consider securing profits or closing one. If you have a single position open, you need to decide whether to take the risk of Trump’s session and keep it open in hopes of a market pump or play it safe and close it beforehand.
👑 BTC.D Analysis
As observed, dominance continues to oscillate between 60.40 and 61.61, having been rejected from the 61.61 ceiling and returned to the box.
🎲 Given the current downward momentum of dominance, we can expect a continued decline to the bottom of the box, which could potentially propel altcoins upwards. However, if dominance successfully closes above 61.61, more capital will flow into Bitcoin, pushing it higher.
📅 Total2 Analysis
Yesterday, we saw an upward movement in Total2 after it solidified above the 1.13 area, allowing some altcoins to make an upward leap. We don’t have a specific trigger for long positions in Total2 today, but a crucial note about altcoins is that American-origin altcoins like HBAR, AAVE, XRP, ADA could pump significantly if Trump makes positive remarks about crypto, so keep an eye on these if they trigger.
🎲 For short positions, the only trigger in Total2 currently is the fake breaking of the 1.13 breach.
📅 USDT.D Analysis
USDT dominance found support at 4.82 and formed a green candle on this level. Given it had previously faked a break of this area, we might prematurely confirm its bullish turn.
🌿 If the 4.82 level is broken again, we can confirm the downward trend in dominance, which could cause the market to move upward. For a bullish confirmation, a higher low and high above 4.82 would confirm a bearish market direction.
❌ Disclaimer ❌
Trading futures is highly risky and dangerous. If you're not an expert, these triggers may not be suitable for you. You should first learn risk and capital management. You can also use the educational content from this channel.
Finally, these triggers reflect my personal opinions on price action, and the market may move completely against this analysis. So, do your own research before opening any position.
TradeCityPro | PI: Detailed Crypto Analysis and Insights👋 Welcome to TradeCity Pro!
In this analysis, I want to review PI, which has been highly requested in the comments. This project was one of the oldest crypto airdrops, and its coin has finally been launched. Now, I want to analyze it for you.
✨ This coin doesn’t have much chart history, so I will analyze it using the 4-hour and 1-hour timeframes.
⏳ 4-Hour Timeframe
On the 4-hour timeframe, as you can see, after the launch of this coin, we saw a massive bullish leg, moving from $0.6498 to $2.9304. Currently, the price is undergoing a correction phase.
📊 Volume initially surged during the launch, which is expected, but it has been decreasing during the correction. RSI is also near the 56.08 trigger, and if this level is broken, strong momentum could enter the market.
🔼 The correction has continued to the 0.382 Fibonacci level, and it seems that a range has formed between the 0.382 and 0.236 Fibonacci retracement levels. If the top of this range is broken, we can enter a long position.
📉 If the correction continues, the next important levels are 0.5, 0.618, and 0.786 Fibonacci retracement levels, and we have to see which level the price reacts to.
⏳ 1-Hour Timeframe
On the 1-hour timeframe, we can see price movements in more detail.
🧲 As you can see, after the price hit the $1.6342 low, it has been forming a bullish structure and has now reached the $1.9807 level.
📈 If this level is broken, we can enter a long position. The next resistance level is $2.3479.
💥 The RSI oscillator is in a sensitive zone, and as long as it stays above the 50 level, market momentum remains bullish. However, if $1.8770 is broken, we can enter a short position.
📝 Final Thoughts
This analysis reflects our opinions and is not financial advice.
Share your thoughts in the comments, and don’t forget to share this analysis with your friends! ❤️

TradeCityPro Academy | Dow Theory Part 2👋 Welcome to TradeCityPro Channel!
Welcome to the Educational Content Section of Our Channel Technical Analysis Training
We aim to produce educational content in playlist format that will teach you technical analysis from A to Z. We will cover topics such as risk and capital management, Dow Theory, support and resistance, trends, market cycles, and more. These lessons are based on our experiences and the book The Handbook of Technical Analysis.
🎨 What is Technical Analysis?
Technical Analysis (TA) is a method used to predict price movements in financial markets by analyzing past data, especially price and trading volume. This approach is based on the idea that historical price patterns tend to repeat and can help traders identify profitable opportunities.
🔹 Why is Technical Analysis Important?
Technical analysis helps traders and investors predict future price movements based on past price action. Its importance comes from several key benefits:
Faster Decision-Making: No need to analyze financial reports or complex news—just focus on price patterns and trading volume.
Better Risk Management: Tools like support & resistance, indicators, and chart patterns help traders find the best entry and exit points.
Applicable to All Markets: Technical analysis can be used in Forex, stocks, cryptocurrencies, commodities, and even real estate.
📚 Recap of the Previous Session
In the previous session, we explained the first two principles of Dow Theory. Make sure to review and study them, and if you have any questions, feel free to reach out to us in the comments.
📑 Principles of Dow Theory
1 - The Averages Discount Everything (Not applicable to crypto)
2 - The Market Has Three Trends
3 - Trends Have Three Phases
4 - Trend Continues Until a Reversal is Confirmed
5 - The Averages Must Confirm Each Other
6 - Volume Confirms the Trend
🌟 Principle 3: Trends Have Three Phases
In Dow Theory, the primary trend (which can be a Bull Market or Bear Market) is divided into three distinct phases. These phases reflect market behavior and investor psychology over time. Here’s a detailed explanation:
📉 Accumulation Phase
Definition: This phase begins when the market is at its lowest point (in a bull trend after a bear market) or when general pessimism prevails. Smart investors, professionals, and those with a long-term vision (like large funds or experienced traders) start buying.
Characteristics:
Prices are still low, and economic news is typically negative (e.g., recession, high unemployment).
Trading volume is low because the general public lacks confidence and doesn’t participate.
Price changes are small and gradual, making the market seem "lifeless" or directionless.
Psychology: This phase marks a transition from despair to hope. Smart investors recognize that the worst is over and that the real value of assets exceeds their current price.
Example: Imagine after a major crash like 2008, some big companies stabilize their prices, but the media still talks about "collapse." Professionals step in here. Or with Bitcoin at $16K, most people thought it was heading to zero and were hopeless!
📈 Public Participation Phase
Definition: This phase occurs when the primary trend is clearly established, and the market starts moving more strongly. Economic news improves, and the general public (retail investors) enters the market.
Characteristics:
Prices rise quickly (in a bull market) or fall sharply (in a bear market).
Trading volume increases significantly as participation grows.
Analysts and media begin confirming the trend with positive reports.
Psychology: Confidence in the market grows, and greed (in a bull market) or fear (in a bear market) gradually takes over. This is where market momentum accelerates.
Example: In a bull market, you might see indices like the Dow Jones hitting new records weekly, with ordinary people buying tech or industrial stocks.
💰 Distribution Phase
Definition: This is the end of the primary trend. In a bull market, smart investors who bought during accumulation start selling to take profits. In a bear market, panic selling subsides, and some buy in hopes of a recovery.
Characteristics:
Prices may still be high, but volatility increases, and signs of weakness emerge.
Trading volume might remain high, but discrepancies between volume and price (e.g., price drops with high volume) appear.
News is still positive, but professionals know the market is overvalued.
Psychology: In a bull market, excessive optimism (Euphoria) dominates; in a bear market, complete despair sets in. This is where the trend reverses.
Example: At the peak of the dot-com bubble (2000), tech stocks kept rising, but professionals began exiting, and then the crash followed.
Key Note: These three phases occur in sequence, and understanding them helps analysts identify the market’s position in the larger cycle. In a bear market, the phases reverse: panic selling (like distribution), temporary recovery (like participation), and final capitulation (like accumulation).
🔍 Principle 4: The Averages Must Confirm Each Other
Charles Dow believed that for a primary trend to be confirmed, two key market indices—the Dow Jones Industrial Average (DJIA) and the Dow Jones Transportation Average (DJTA)—must move in the same direction. This principle stems from economic and logical significance in Dow’s time and is still considered a key metric. Here’s the full explanation:
📊 Economic Logic:
Industry and Transportation: In Dow’s era (late 19th and early 20th centuries), the U.S. economy relied heavily on industrial production and transportation (e.g., railroads). If industrial companies (producers of goods) were growing, demand for transportation (moving goods) should also rise.
Thus, aligned movement in these indices signaled a healthy economy.
Mutual Confirmation: If only one average rises (e.g., industrials go up but transportation doesn’t), Dow saw it as a sign of weakness or an unsustainable trend.
🤑 Practical Application:
Bullish Trend: In a bull market, both averages should reach new highs (Higher Highs). If the DJIA hits a new record but the DJTA fails to confirm and stays lower, the uptrend is questionable.
Bearish Trend: In a bear market, both should hit new lows (Lower Lows). Lack of confirmation (e.g., industrials fall but transportation doesn’t) might signal the end of the downtrend.
Divergence: If the averages diverge (one rises while the other doesn’t), Dow viewed it as a warning of a potential trend change.
⚖️ Technical Details:
Timing: Confirmation doesn’t need to be simultaneous but should occur within a reasonable timeframe (e.g., weeks or months).
Volume: Though not directly mentioned in this principle, handbooks emphasize that high volume during confirmation adds credibility to the trend.
Classic Example: In 1929, the industrial average began falling, but transportation initially resisted. When transportation also dropped, the bearish trend was confirmed, leading to the Great Depression.
🎉 Conclusion
We’ve reached the end of today’s educational segment! We’ll start by explaining all of Dow Theory’s principles, and in the future, we’ll move on to chart analysis and the strategy I personally use for trading with Dow Theory. So, make sure you fully grasp these concepts first so we can progress together in this learning journey!
💡 Final Thoughts for Today
This is the end of this part, and I must say we have a long journey ahead. We will continually strive to produce better content every day, steering clear of sensationalized content that promises unrealistic profits, and instead, focusing on the proper learning path of technical analysis.
⚠️ Please remember that these lessons represent our personal view of the market and should not be considered financial advice for investment.

TradeCityPro | Bitcoin Daily Analysis #24👋 Welcome to TradeCity Pro!
Let's dive into the analysis of Bitcoin and other key cryptocurrency indicators. In this analysis, I want to review the important futures triggers in today's New York session.
⏳ 1-Hour Timeframe
Before we start the analysis, let's review the positions we could have opened yesterday. I mentioned that if the area of 83151 was breached, you could enter a short position. As you can see, that happened, and the candle stabilized below this area, and I opened a short position which then hit the stop loss.
⚡️ However, after this occurred, we observed a very strong support candle at this level, which caused this break to be a fakeout, and the price started to move upwards. If you recall, I mentioned that if the price could stabilize above the ceiling, a new upward leg could start, which is why I had placed a stop buy above this area. With the fakeout of the lower support, this stop buy was triggered, and the price began its upward movement.
🧲 Currently, as you can see, the price has also passed the 0.382 Fibonacci area, breaking through it and moving upwards. An important resistance that we had previously charted was at 89318, which, as you see, the price is stabilizing above. If this happens, we could see the price potentially reaching back up to 94355. It's challenging to give a trigger for today because our main trigger, the 0.382 Fibonacci area, has unfortunately been activated in recent candles.
📊 We need to wait for the market to form a structure now. If the break of either the 89318 area or the 0.382 Fibonacci turns out to be a fake, you could consider finding a trigger in lower time frames to open a short position. The reason is that the price is making a lower high compared to 94355. But overall, be cautious about opening risky positions on Bitcoin today and tomorrow because Trump's speech on Friday could move the market significantly, and the market might be less volatile in these two days.
👑 BTC.D Analysis
Looking at the Bitcoin dominance, it continues to range between 60.40 and 61.41. As you can see, it's really hard to predict the movements of the dominance as it's mostly ranging between these two levels.
🔼 Currently, it's moving towards the upper limit with a green candle. A higher low has been made compared to the 60.40 area, which increases the chances of breaking out from the top of the box.
🔍 If this occurs, the next resistances are at 62.19 and 62.66. If Bitcoin dominance rises, and the market drops, altcoins will likely fall significantly. If the market rises, Bitcoin might perform better than altcoins.
📅 Total2 Analysis
As observed, we saw an upward movement in Total2 yesterday after consolidating above the 1.07 area, starting a new upward leg. Currently, this index has reached the resistance at 1.13, and we need to wait and see if it can break this area. Currently, the trigger for a long position is precisely this break of the 1.13 area.
🧩 If this area is breached, the price could move to further resistances at 1.18 or even 1.23. However, if Total 2 is rejected from this area, we might expect another drop, potentially reaching back down to 1.01.
📅 USDT.D Analysis
As seen, yesterday after USDT.D pulled back to the 5.30 area and failed to consolidate above it, we witnessed a significant drop. This initial downward leg saw the price even rise above the 5.08 area, and this morning, after pulling back to this area, as you can see, dominance continues to trend downward with the next significant support at 4.82, which I believe could be reached.
🎲 I don't have much else to say about this dominance because I don't have any specific triggers for today.
📌 Overall, I don't have any specific triggers in the market today; we had one yesterday that was activated, but today I can't specify any particular triggers for you, and it's better to be an observer and wait for significant news from the US, especially the meeting that Trump is expected to hold on Friday, which could be very decisive for the market's future.
❌ Disclaimer ❌
Trading futures is highly risky and dangerous. If you're not an expert, these triggers may not be suitable for you. You should first learn risk and capital management. You can also use the educational content from this channel.
Finally, these triggers reflect my personal opinions on price action, and the market may move completely against this analysis. So, do your own research before opening any position.

TradeCityPro | SUIUSDT Is the best time to buy ?👋 Welcome to TradeCityPro Channel!
Let's analyze and review one of the most popular coins in the market, sui, and update our previous analysis and find new triggers
🌐 Bitcoin Overview
Before starting today's altcoin analysis, let's look at Bitcoin on the 1-hour timeframe. Since yesterday, Bitcoin experienced a correction, which was necessary for the market, and it pulled back to the 102135 range. The next trigger for a long position will be a breakout above 104714.
Yesterday's correction, coupled with an increase in Bitcoin dominance, caused noticeable declines in some altcoins. This highlights the importance of monitoring BTC pairs in your checklist these days.
📊 Weekly Timeframe
In the weekly time frame, it is one of the coins that is in good condition, it is really in the market and is still fluctuating on the high support levels.
After hitting 5.24, we made a new ceiling or ATH, and after that, due to recent market news, we experienced some drops, and this has also caused the price correction of this coin.
For re-buying, if we make a good support candle at this level 2.4, it will be a good trigger and the main trend will start again after we break 5.24. Also, after breaking 1.77, we can temporarily exit this coin and cash out!
📈 Daily Timeframe
In the daily time frame, it has been in relatively good conditions compared to other coins in the market and has experienced fewer declines and still has a lot of support to lose!
After breaking the 1.0333 level, which was our trigger spot, we made our purchase and experienced a move after its failure with the entry of momentum and recorded a new ceiling with this event!
Along with this trend, we can draw our Fibonacci levels, which are currently involved in the important level of 0.382, and after it rises and breaks the ceiling of 5.24, we can experience a powerful move!
If this level is broken, we can also hit the support levels of 1.7702 and 1.3859 and we need to form a structure to buy now, but after breaking the trend line and the 3.65 trigger, it can be a good point! For selling, I will continue to hold for now!
📝 Final Thoughts
Stay calm, trade wisely, and let's capture the market's best opportunities!
This analysis reflects our opinions and is not financial advice.
Share your thoughts in the comments, and don’t forget to share this analysis with your friends! ❤️

TradeCityPro | Bitcoin Daily Analysis #23👋 Welcome to TradeCity Pro!
Let's dive into the analysis of Bitcoin and other important crypto indices. In this analysis, I want to review the important futures triggers in today's New York session. Yesterday, the market was rejected from a significant area and experienced a bearish leg.
📰 Before starting the analysis, it's worth noting that today Trump has a very important speech about tariffs, and if he discusses cryptocurrencies, the market may experience significant fluctuations. Therefore, be cautious about opening high-risk positions today.
⏳ 1-Hour Timeframe
In the 1-hour timeframe, as observed yesterday, after the price rose from the 91422 area, I mentioned that if the 94355 resistance were broken, we could enter a long position, and if the 91422 area were broken, we could enter a short position.
🔍 That exact scenario occurred, and after the price created a lower high compared to 94355, we witnessed a significant bearish momentum, resulting in a large bearish candle that engulfed several previous candles, broke the 91422 support, and reached the 89318 area.
⚡️ After this event and several resting and pullback candles that hit the 0.382 Fibonacci area, the price proceeded with its next bearish leg, breaking the 89318 area near the 0.618 Fibonacci zone. With this PRZ break, we can say that all bullish market momentum was wiped out, and the price fully corrected relative to the bullish leg it had previously made, reaching the 85204 area.
✅ This morning, this area was also breached, and the price executed a Downside Extension to the 1.272 Fibonacci Retracement, meaning the market has fully engulfed the bullish leg and even dropped an additional 27% from that leg to date.
📉 Currently, there is support at the 83151 area, which coincides with the 1.272 Fibonacci. If this area is breached, we can expect the Downside Extension to continue, with the next support at the Fibonacci 1.618, a crucial Fibonacci zone. If this area is also breached, there is a static support at 78940.
💥 In the RSI, note the significant bearish momentum in the market. If the RSI can re-enter and stay in the Oversell zone, the likelihood of breaking 83151 or even 78940 will increase.
📊 Regarding volume, as you can see, it mostly shows a ranging structure with a few high-volume candles within this range that can be considered Selloff candles. After these candles, the price had several resting and corrective candles.
✨ Overall, the volume is ranging, and we will see whether buying or selling volume enters the market based on Trump's statements.
🔼 For a risky long position today, you can open a long position with the breakout of 85204. I suggest this trigger because Trump has a speech today, and if this news is favorable for crypto, Bitcoin could move upward again under the news influence, and I think the risk is worth taking if this area breaks.
❌ However, open this position with the minimal risk your strategy allows, and ensure that no more than 0.5% or 0.25% of your capital is at risk if this position hits a stop-loss.
💫 No more to discuss about Bitcoin; let's move on to the analysis of dominances to see what triggers we can find for altcoins.
👑 BTC.D Analysis
Let's look at the Bitcoin dominance analysis. As you can see, yesterday I defined a resistance area at 61.48 for you and mentioned that the price might get rejected from this area and the dominance might turn bearish again, which did happen, albeit slightly off at 61.61.
⭐️ Therefore, I have moved this line and adjusted it to this area. Currently, we are witnessing several bearish candles in a row from Bitcoin's dominance, and it seems likely that the dominance could move back down to the 60.40 floor with the bearish momentum it has, and as I've said in the past few days, I still see Bitcoin's dominance trend as ranging.
🎯 The dominance is not very analyzable at the moment, and we need to wait and see which side the box will break. If the box breaks from the 62.19 area, we can say that a lot of money is likely to enter Bitcoin, and Bitcoin could move more than altcoins. If the dominance breaks from the 60.40 area downwards, we can say that more money will enter altcoins.
📅 Total2 Analysis
Moving on to the Total2 analysis, yesterday I told you that if the 1.14 level is broken, you could enter a short position if Bitcoin's dominance was rising, which indeed occurred, and the dominance of Bitcoin was rising while this break happened, and the dominance had not yet been rejected from the ceiling, which is why the short position you opened on altcoins could have been much more profitable.
🎲 However, as you can see, I have moved this trigger and transferred it to the 1.13 area because I think this area is cleaner, and as you can see, the price has reacted to it once and is likely to react to this area more in the future than to the 1.14 area.
🔑 Overall, the gray areas you see drawn on the chart are not very important supports and resistances, so I easily move them if the price does not show the reaction I want, and it is not very important to me if their position changes.
☘️ However, as you can see, after the price broke the 1.13 area, it executed its main bearish leg downwards, even breaking the 1.07 area and hitting a shadow to the 1.01 area as you can see, and is currently in a corrective phase.
🔽 The 1.07 area could be very important today, and if this area is broken, we can say that the price could make a deeper correction. But if this does not happen and the price is rejected from this area, we can say that altcoins are ready to execute their next bearish leg at least down to the 1.01 area.
✅ Depending on Bitcoin's dominance, you can decide to open a position on Bitcoin itself today or on altcoins. As you can see, the dominance candles being set suggest a bearish dominance, so if the market gives a short position, Bitcoin will be better than altcoins, but while you are reading this analysis, if you want to open a position, it might be that the dominance turns bullish, in which case a short position on altcoins would be better than on Bitcoin.
📅 USDT.D Analysis
Let's look at the Tether dominance analysis. As I told you yesterday, if the 4.82 level was broken, the dominance could start a bullish leg, which did happen, and the market activated its short trigger in Total2 and altcoins, and the dominance moved upwards, even breaking the 5.08 area and with a pullback to this area, reached 5.30.
🧲 This area was previously around 5.21, but as I told you, I easily move lines that are gray if the price does not respect them, and for this reason, I moved this area to 5.30, as you can see, the price has reacted to it and now seems to be correcting.
📊 Unfortunately, I don't have a specific trigger for a bearish turn in Tether dominance, but this 5.30 trigger is a very suitable one for it to turn more bullish, and in my opinion, if the dominance wants to turn more bullish and break this area, it could move again up to the 5.50 area.
🔼 But in case of a correction in dominance, the first very important support exists at 5.08, and the dominance could correct to this area.
📌 Final Words Overall, I think the market today is not very analyzable and can have a lot of sharp and emotional movements, and everything depends on Trump's speech.
❗️ I suggest that if you think the market will go up with Trump's speech, hold a long position, and if you think it will go down, hold a short position if triggers are activated.
🎲 But open this position with the minimum risk you can and are allowed to take because Trump's speech can create a lot of sharp movements in the market, and if you do not risk manage and set a stop-loss, your position can easily be liquidated, so be careful to risk the minimum amount that your strategy allows you to open these positions.
❌ Disclaimer ❌
Trading futures is highly risky and dangerous. If you're not an expert, these triggers may not be suitable for you. You should first learn risk and capital management. You can also use the educational content from this channel.
Finally, these triggers reflect my personal opinions on price action, and the market may move completely against this analysis. So, do your own research before opening any position.

TradeCityPro | XLM: Key Levels and Market Analysis👋 Welcome to TradeCity Pro!
In this analysis, I want to review XLM for you. This coin is one of the U.S.-based crypto projects, and given the recent surge in news regarding crypto and the U.S., it could experience significant volatility, making it suitable for trading.
📅 Daily Timeframe
On the daily timeframe, we can see a strong bullish leg that extended up to $0.5781 before entering a correction phase, forming a descending wedge.
🔍 At the moment, there is a very important support level close to the price. If $0.2827 is broken, we can expect a further correction toward the 0.5 or 0.618 Fibonacci retracement levels. Another key support level is at $0.1566.
⚡️ The $0.2827 zone is highly significant, as it overlaps with the 0.382 Fibonacci retracement, making it a crucial level. If the price finds support at this zone, we could see the next bullish leg begin. However, if this support is lost, the price could experience sharp downward movements.
🔼 For spot buying, the $0.3522 resistance has turned into a solid level, where the price has tested and rejected multiple times. If the wedge pattern and resistance break, you can enter a long position or consider spot buying.
🚀 The next resistance levels are $0.4896 and $0.5781. The ATH at $0.7791 is a major supply zone.
📊 In the next few days, pay close attention to volume. A rise in volume before a breakout could indicate an imminent move.
⏳ 4-Hour Timeframe
On the 4-hour timeframe, we can observe price action in more detail. There is strong resistance at $0.3522, where the price was rejected, leading to significant bearish momentum.
✅ Currently, the price is reacting to the $0.2817 zone, and after seven consecutive red candles, a green candle has formed. Previously, the price faked a breakout at this level, and now it has retested this zone again.
🔽 If $0.2817 is broken, a short position can be opened, with the next support at $0.2368. For long positions, wait until the price forms a structure and the $0.3102 trigger level is confirmed. The main long trigger will be a breakout above $0.3522.
📝 Final Thoughts
This analysis reflects our opinions and is not financial advice.
Share your thoughts in the comments, and don’t forget to share this analysis with your friends! ❤️

TradeCityPro | BIGTIMEUSDT Final Downtrend?👋 Welcome to TradeCityPro Channel!
Let's analyze and review the new gaming coin BIGTIME and see what the market is going to be like. I feel like we're going to see the final downtrend.
🌐 Bitcoin Overview
Before starting today's altcoin analysis, let's look at Bitcoin on the 1-hour timeframe. Since yesterday, Bitcoin experienced a correction, which was necessary for the market, and it pulled back to the 102135 range. The next trigger for a long position will be a breakout above 104714.
Yesterday's correction, coupled with an increase in Bitcoin dominance, caused noticeable declines in some altcoins. This highlights the importance of monitoring BTC pairs in your checklist these days.
📊 Weekly Timeframe
This coin is not in an interesting situation on the weekly time frame and after being rejected from the resistance of 0.22109, it is continuing its downward trend and is recording a lower high and low
If the weekly candle closes like this and we lose the support of 0.06479, the declines will continue and if you are holding this coin, I suggest you exit temporarily and if it enters again, you will simply enter with a smaller number of this coin and your number of Tethers will be preserved
They are not really in good conditions for buying right now, but if the support is faked, we can get a trigger from them, but normally the best trigger is after the failure of 0.22109, but I repeat, the fake of this support can form a new trend!
📈 Daily Timeframe
The situation is the same on the weekly time frame and the probability of a fall is higher than ever, and after the rejection of this important resistance at 0.22785, we have experienced a 75% drop so far!
After this drop, we went into the range box between 0.05801 and 0.07342, and it is natural to suffer a little until our RSI rejected the middle line of 50, which again increased the probability of a fall.
Also, today's daily candle is very important, and if it closes like this, we are engulfing a few of our previous candles and the probability of a support floor breakdown is higher than ever, so you can open a short position and exit the spot, and your second entry for the spot breakdown will be 0.09270!
📝 Final Thoughts
Stay calm, trade wisely, and let's capture the market's best opportunities!
This analysis reflects our opinions and is not financial advice.
Share your thoughts in the comments, and don’t forget to share this analysis with your friends!
TradeCityPro | Bitcoin Daily Analysis #22👋 Welcome to TradeCity Pro!
Let's dive into the analysis of Bitcoin and key crypto indices. In this analysis, as usual on Mondays, I want to review Bitcoin in longer timeframes and explore potential scenarios for Bitcoin in the long term.
📅 Weekly Timeframe
In the weekly timeframe, as you can see, the price has formed a very large candle with a big shadow, finally breaking out of the 90,000 to 104,000 range box, dipping below, and re-entering this box.
🔍 The reason for this Bitcoin fluctuation was initially the news of America's 25% tariffs, which caused all stocks and Bitcoin to drop. Even the Nasdaq saw a significant fall, but after Trump tweeted last night about planning to have a Crypto reserve at the US Treasury,
📰 This news caused the price to engulf all the previous downward movement, resulting in the candle you see, which has pulled back to the Fibonacci range between 0.382 and 0.5 and has also pulled back to the SMA 25. If you're looking to buy Bitcoin, you can place a stop buy above last week's candle to make your purchase in the spot market.
👀 However, be aware that Bitcoin is in a high price area, and make sure to manage your risk. If the 104,000 area is broken, higher targets will be accessible. If this happens, I will update the analysis and inform you of higher targets.
🔽 If the price drops, the Fibonacci areas are clearly defined, and the main support is at 72,000. I have nothing more to say about Bitcoin in this timeframe; let's move to the daily timeframe to see what triggers we can find there.
📅 Daily Timeframe
In the daily timeframe, as you can see, we can observe the movement influenced by the news in more detail. As I mentioned in the analysis, with the break of the 92,433 area, we could have opened a short position for Bitcoin to make a deeper correction to the Fibonacci confluence area between 0.5 and 0.618.
🔑 As you can see, after several candles hit this range last night, with the news announced by Trump, the price returned above the 92,433 area, and it seems that a V pattern is forming on the chart, and the trigger for this V pattern is at 98,482.
✨ If the price can stabilize above this area, I personally expect it to move at least to the 106,243 area, which is the resistance at ATH.
💥 In the RSI, as you see, it is engaged with the 50 resistance. If the RSI goes above this area and can break it, we will have confirmed the bullish momentum. In this case, if the 98,482 area breaks, I personally will try to have a long position because it can continue and move towards a new ATH with the break of 106,282.
📉 But on the other hand, if all this upward movement that has occurred is a pullback, and the price starts to move downward again, I will definitely inform you in future analyses and announce appropriate short triggers.
💫 In the daily timeframe, the important corrective areas are the same range between 0.5 and 0.618 Fibonacci. If this area is lost, the main support will be 72,753.
⏳ 4-Hour Timeframe
Let's go to the four-hour timeframe to slowly review the futures triggers and trades that we can open today and in the coming week.
🔄 As I told you yesterday, with the break of 87,070, we could have entered a long position, but I told you that since it is a holiday, I myself am not opening this position, and I also suggested that you not open this position, which is completely natural, and just because the price has gone up doesn't mean I should say you definitely had to open this position.
📚 We must not trade outside our strategy and always be within the framework of the strategy. In my strategy, on Saturdays and Sundays when the market is closed, I do not open positions for triggers that are not very important, and this trigger was also among those triggers, and I did not open a position.
✅ If you opened it, congratulations, and I hope you have profited and always be profitable. But today, our job is easier for opening long positions because the price has come up one leg, and bullish momentum has entered the market, even the RSI has entered Overbuy once and has reset now, so if the 95,108 area breaks, which I will tell you the exact number in the one-hour timeframe, we can enter a very good long position.
📈 In my opinion, this position will be very logical because, as I said, the price has come up a leg, and now after resting, it is ready to go up the next leg.
🔽 But on the other hand, we can consider all this movement a pullback and a Dead cat bounce. In this case, if the 92,226 area breaks, the price can drop again and move downward. It is better to go to the one-hour timeframe to talk more about this issue and today's positions there.
⏳ 1-Hour Timeframe
In the one-hour timeframe, as you can see, yesterday the 87,070 trigger was activated, which I referred to in the four-hour timeframe, and told you that I personally did not open this position, and yesterday I did not open any specific position.
🧲 But today, as you can see, Bitcoin, after being rejected from the 94,355 area, has made a slight correction downward to the 91,422 area. This area overlapped with the SMA 25, and it seems that the price is being supported from this area and can move upward.
🔍 Keep in mind that if the SMA 25 cannot prepare the necessary and sufficient momentum for the next bullish leg, the price can wait until the SMA 99 reaches it. As we saw in the previous bearish leg, the SMA 25 reached the price several times and caused the bearish momentum to be maintained, but with the breaking of the SMA 25 and reaching the SMA 99, the price could not continue the bearish momentum and with the breaking of the SMA 99 and the cross of this SMA with the SMA 25, it caused the market trend to change, and with the news that came, we had an upward leg upwards.
🔼 So, if with a pullback the price to SMA 25 starts the next bullish leg, in case of breaking 94,355, I will open a long position, and if the SMA 25 cannot enter momentum into the market, with breaking 91,422, you can enter a short position.
🎲 I have nothing else to say about Bitcoin, let's move on to the analysis of dominances to see what the market conditions for altcoins will be like.
👑 BTC.D Analysis
Let's move on to the analysis of Bitcoin dominance, as you can see in the one-hour timeframe, I've made the chart a bit clearer and marked a box between 60.40 and 61.48 for you, where the price yesterday, after the news came, first had a fake from below and performed a fake break in the area of 60.40, and after the effects of the news wore off, the dominance moved upwards again.
💧 Currently, dominance has reached the area of 60.48, and the scenario I mentioned a few days ago, i.e., re-testing the top of the main box, seems very likely, and with the stabilization of Bitcoin dominance above the area of 61.48, we can expect this dominance to move up to the area of 62.19 and even 62.66, which if this movement coincides with the breaking of Bitcoin resistance, opening a Bitcoin position will be very logical, and if the short trigger is always activated, altcoins can have a very sharp and severe drop.
⭐️ On the other hand, if dominance is rejected from this resistance of 61.48 or performs a fake break, dominance can move down again towards the area of 60.40, in which case we can also open long positions on altcoins and short positions on Bitcoin itself.
📅 Total2 Analysis
Let's move on to the analysis of Total2, as you can see, after the area of 1.09 was broken yesterday, Total2 made a more upward move than Bitcoin and moved more upwards than Bitcoin and managed to move up to the area of 1.23, and the reason was that Bitcoin dominance was in an upward falling movement and caused more money to enter altcoins.
☘️ But as you can see, simultaneous with the rise of Bitcoin dominance and the correction of the altcoin market, altcoins made much more corrections than Bitcoin today and have fallen more than Bitcoin today and are supported at 1.14.
🎯 For long positions, you can enter with the break of 1.23, but if the price shows a reaction to the area of 1.18 again, you can enter a long position with the break of this area. I'm keeping this area today and want to see if the price will show a reaction to it in the future or not. If the price does not show a reaction to this area, I will remove it from the chart, and if I see that it shows a reaction and respects this area, I will keep it on the chart.
📉 For short positions, you can also look for altcoins that are on good support floors in case of breaking 1.14, and if Bitcoin dominance rises, and these altcoins can open a short position.
📅 USDT.D Analysis
Let's move on to the analysis of Tether dominance, as you can see, yesterday the 5.08 trigger in dominance was activated, causing the dominance to fall and with the fall of dominance, the market moved upwards.
✅ Currently, dominance is on a very important support that I had previously specified for you, which is 4.60. This area was previously in the range of 4.62, and the price showed a slight reaction to this area, and I moved this area.
✨ In the pullback of Tether dominance, this pullback has hit the area of 4.82, which I had previously specified for you, and it currently seems ready to perform its next downward leg.
⚡️ As you can see, a V pattern had also formed in Tether dominance, which was activated with the break of 5.08, and the first downward leg was performed up to the area of 4.60. Currently, the trigger for confirming the downward dominance of Bitcoin is this area of 4.60, and if the dominance is stabilized below this area, we can confirm the downward dominance, but on the other hand, if the dominance is stabilized above the area of 4.82, we can expect an upward leg to be performed on dominance.
❌ Disclaimer ❌
Trading futures is highly risky and dangerous. If you're not an expert, these triggers may not be suitable for you. You should first learn risk and capital management. You can also use the educational content from this channel.
Finally, these triggers reflect my personal opinions on price action, and the market may move completely against this analysis. So, do your own research before opening any position.

TradeCityPro | XRP: Key Levels After Major Market News👋 Welcome to TradeCity Pro!
In this analysis, I want to review XRP, one of the most significant coins in the market. Yesterday, a major news update was released about XRP, and with a market cap of $156 billion, it currently ranks 3rd on CoinMarketCap.
📰 Important News Update
Before starting the analysis, let’s go over the major news regarding this project. Yesterday, former U.S. President Donald Trump tweeted that he plans to add a crypto reserve to the U.S. Treasury, stating that major cryptocurrencies like BTC, ETH, SOL, ADA, and XRP would be purchased by the U.S. Treasury.
✅ This is extremely bullish news for the market. As we saw yesterday, Bitcoin made a strong, sharp move, and the altcoins listed in the announcement also experienced massive price surges. For example, XRP surged by 30% following the news.
💥 I will discuss Bitcoin and other coins in future analyses, so make sure to check out today’s Bitcoin analysis, where I’ll also cover long-term scenarios.
📅 Weekly Timeframe
On the weekly timeframe, as seen on the chart, after bouncing along the ascending trendline, XRP confirmed its breakout above $0.73056, which initiated the main bullish leg, pushing the price up to $3.06717.
🧩 $3.06717 is the all-time high (ATH) and a major supply zone.If XRP can hold above this level, the next bullish leg could begin.
✨ In the event of a correction, the only key support visible on the weekly timeframe is $1.67220. For further support levels, we need to analyze lower timeframes.
🔍 The RSI oscillator has exited the overbought zone and returned to normal levels.If RSI re-enters overbought conditions, the bullish scenario becomes more likely.
📅 Daily Timeframe
On the daily timeframe, the first key observation is a strong bearish divergence on the RSI, which formed as price moved sideways inside the range between $2.02967 and $3.30467.
⚡️ The trigger for this divergence is a break below $2.02967, which has not yet happened.
Looking at market volume, after the $0.72448 breakout, volume significantly increased. However, volume has been gradually decreasing since the formation of the range.
📊 A drop in volume before a breakout often signals that a breakout is approaching.If volume continues to decline, be prepared for a potential breakout and enter positions accordingly once triggers are confirmed.
📉 If the range breaks downward, and the PRZ at $2.02967 is lost, XRP could enter a deeper correction toward key Fibonacci levels such as 0.382, 0.5, and 0.618.
💫 These three Fibonacci levels are strong support zones, which could prevent a further sell-off.
📈 On the bullish side, if the range breaks to the upside, a new bullish leg will begin, pushing XRP toward higher targets.If this bullish breakout happens, I will update the analysis with potential new targets.
⏳ 4-Hour Timeframe
Let’s now analyze the 4-hour timeframe and identify futures trading triggers.
🔍 After the drop from the $3.36021 peak, the price reached the bottom of the range, and market volume significantly decreased.This signaled that a major move was approaching.
🔑 As seen on the chart, the release of the U.S. Treasury Crypto Reserve news triggered an explosive move, pushing XRP up to $2.95244.
🔽 For futures trading, the closest short trigger is a break below $2.30010.For earlier short entries, we need to wait for a new structure to form.
🛒 For long positions, if $2.95244 is broken, a long entry can be considered.The main resistance for spot buying and the key long position trigger is at $3.36021.
📝 Final Thoughts
This analysis reflects our opinions and is not financial advice.
Share your thoughts in the com
