EUR/GBP Bearish Momentum – Eyes on Support Zone!📊 EUR/GBP Daily Chart Analysis (28th Jan 2025)
🔹 Overview:
Pair: EUR/GBP
Current Price: 0.83855 📉 (-0.10%)
Key Indicators:
200 EMA (Red Line): 0.84129 (Price is below the EMA, indicating bearish sentiment)
Resistance Zone (🟠 Orange Box): ~0.84200 - 0.84400
Support Zone (🟢 Green Box): ~0.83200 - 0.83400
🔻 Bearish Outlook:
Price recently rejected the resistance zone and started declining.
It is now trading below the 200 EMA, suggesting potential further downside.
Next Target: The support zone (~0.83200 - 0.83400) is likely the next major level.
📉 Possible Scenarios:
1️⃣ Bearish Continuation ⬇️
If the price maintains momentum, it may head toward the support zone (~0.83200).
A break below support could trigger further downside.
2️⃣ Bullish Rebound 🔄
If the price finds strong buying interest at support, a rebound toward the resistance (~0.84200) is possible.
A breakout above 200 EMA could shift momentum back to bullish.
🎯 Trading Considerations:
Short Opportunity: Below 0.83800, targeting 0.83400.
Long Opportunity: If support holds around 0.83200, aiming for a move back to resistance.
Breakout Watch: A move above 0.84200 could trigger bullish momentum.
🔥 Conclusion: Currently, the trend is bearish, and price action suggests further downside toward the support zone. Keep an eye on price behavior around 0.83400 for potential reactions.
Technical

AUD/JPY At a Breaking Point – Big Move Loading!AUD/JPY is sitting at a crucial level right now. We're seeing a descending triangle pattern forming, with price getting squeezed between lower highs and key support around the 200 EMA (94.64).
A breakdown below this level could trigger a sharp drop, with targets around 90 and possibly 85-87 in the coming weeks. The bearish momentum is building, and today's red candle isn't looking too promising for bulls.
On the flip side, if buyers step in and push it back above 97.50, we might see a recovery towards the 100 level. But for now, the bias leans bearish unless we get a strong reversal signal.
Keep an eye on that 94 level – a breakdown could mean more downside ahead. 🔻

Gold (XAU/USD) Reverses from Resistance – Is a Sell-Off UnderwayGold (XAU/USD) Hits Resistance and Faces Reversal – Is the Sell-Off Beginning?
Gold surged to test the upper boundary of its ascending channel, touching key resistance. However, bullish momentum seems to be fading as sellers step in, pushing prices lower. This could signal the start of a pullback, potentially targeting mid-channel support or even the 200 EMA.
If buyers fail to reclaim control, we may see a deeper correction. Eyes are now on the next key support levels—will gold find strength, or is a larger sell-off underway?

XAU/USD 4H Analysis: Bullish Momentum Towards $2,780?📊 XAU/USD 4H Chart Analysis – Bullish Momentum 🚀💰
📌 Key Observations:
🔹 Current Price: $2,754.16 (+0.19%)
🔹 Support Zone: $2,740 - $2,750 (Previous resistance turned support ✅)
🔹 Resistance Zone: $2,780 (Next potential target 🎯)
🔹 200 EMA: $2,687.43 (Price is above = Bullish signal 📈)
🔹 Breakout Confirmation: Price has broken past a key level and might retest before moving higher 🔄📊
📉 Potential Scenarios:
✅ Bullish Case: If price holds above $2,750, we could see a rally towards $2,780+ 🚀
❌ Bearish Case: If price drops below $2,740, we might see a correction back to $2,720 ⚠️
🔥 Conclusion:
Gold is showing strong bullish momentum and may continue its uptrend towards $2,780+ if it sustains above the breakout level! Keep an eye on support at $2,750 for confirmation. 👀💎
Would you like further indicators or a different timeframe analysis? ⏳📊

UPS at a Make-or-Break Zone – Will Buyers Step In?Hi you all,
United Parcel Service (UPS) has recently entered a potential buying zone. In its latest earnings report, the company announced a reduction in business with Amazon by more than 50% by the second half of 2026, aiming to focus on more profitable ventures. Despite a slight revenue miss, UPS beat profit expectations for the fourth quarter.
From a technical perspective, several factors suggest a potential buying opportunity, so do your homework. If fundamentals will align then you should be ready...
- Trendline: The stock is approaching a long-term trendline, third touch.
- 50% Retracement: UPS has retraced approximately 50% from its all-time high.
- Previous Yearly Highs as Support: Former resistance levels from previous years are now acting as support, indicating potential liquidity.
- Psychological Support at $100: The round number of $100 serves as a psychological barrier, potentially providing additional support.
Do your homework because this is just half of the story: technical analysis. From my side, this is inside a potential area, but do fundamentals support it?
Good luck,
Vaido

[INTRADAY] #BANKNIFTY PE & CE Levels(30/01/2025)Today will be flat opening expected in banknifty. After opening if banknifty sustain above 49050 level then expected upside movement upto 49450 level in today's session. But in case banknifty starts trading below 48950 level then possible sharp downside move of 400-500+ points possible in index to the negative trend.

XAU/USD: Potential Reaction at Supply Zone*On the 4H timeframe, XAU/USD has shown a clear CHoCH (Change of Character), with the previous Higher Low (HL) being broken, taking out Buy-Side Liquidity near the highs. Price is now trading within a supply zone, aligning with bearish order flow.
On the 30M timeframe (see chart):
• A CHoCH has been identified within the supply area, signaling a potential shift in direction.
• Price looking to clear the inducement (IDM) before tapping into the zone, strengthening the likelihood of a sell-off.
• I’m anticipating a reaction and continuation to the downside, targeting lower liquidity levels around $2,730.500.
Key Points:
• Bearish Bias from the 4H Supply Zone.
• Liquidity grab + CHoCH on the 30M confirms bearish intent.
• Targeting the lows near $2,730.500 for a high-probability trade setup.
Trade Idea:
Wait for confirmation within the 30M supply zone (e.g., a lower timeframe entry such as a CHoCH or breaker structure). Maintain discipline and proper risk management.
What do you think about this setup? Drop your thoughts below!
Bless Trading!

EUR/JPY 4H Chart Analysis – Gap Fill Incoming?EUR/JPY 4H Chart Analysis 🏆📊
🚀 Current Price: 162.308
📍 200 EMA: 162.099 (Dynamic Support)
🔥 Key Levels & Insights:
🟥 Major Support Zone (Red Area - 162.000)
✅ Price recently bounced off this level, showing strong buying pressure.
✅ If price holds above 162.000, a bullish continuation is likely.
📈 Gap Zone (Orange - 163.000 - 163.500)
🔍 There’s a price imbalance above, meaning price could be drawn towards it.
🔼 Gaps act as magnets! A move up to fill the gap is likely.
📊 200 EMA (162.099) - Crucial Level
🚦 Price is hovering above the 200 EMA. If it remains above, we can expect further bullish momentum.
🔮 Price Prediction & Trade Idea
📌 If price breaks and holds above 162.500, expect a 🚀 move towards 163.500.
📌 Rejection from 163.500 could bring a pullback 📉 back to 162.500.
🚨 Risk Alert:
🔻 If price drops below 162.000, bears might take control, pushing it to 161.500 or lower.
💡 Final Thoughts:
👉 Bulls 🐂 need to break 162.500 to push towards 163.500.
👉 Bears 🐻 will gain control if price loses 162.000.
🔥 Verdict:
✅ Bullish Bias if price stays above 162.000.
🚀 Target: 163.500 (Gap Fill).
🔻 Invalidation: Below 162.000.

Bitcoin (BTC/USDT) Symmetrical Triangle Analysis: Next move?Bitcoin (BTC/USDT) 4H Chart Analysis
Key Observations:
1. Symmetrical Triangle Pattern:
The chart shows a symmetrical triangle formation, characterized by converging trendlines.
This pattern typically signals a breakout, but the direction (up or down) depends on market momentum.
2. Current Price Action:
BTC is trading around $102,979.98 at the time of the chart.
It is above the 200 EMA ($100,003.64), indicating bullish strength.
The price recently bounced off support and is moving towards resistance.
3. Support and Resistance Levels:
Support: Around $97,785.55 (blue line).
Resistance: Around $109,636.60 (blue line).
4. Potential Scenarios:
Bullish Breakout:
If BTC breaks above the upper trendline, it may rally towards $109,636.60 or higher.
A confirmed breakout could push BTC to $112,500+.
Bearish Breakdown:
If BTC rejects at resistance and breaks downward, it could retest the $100,000 level or lower.
A breakdown could target $97,785.55 or even $95,000.
Final Thoughts:
Watch for a breakout or breakdown from the triangle pattern.
Volume is crucial—a high-volume breakout confirms strength, while low volume can indicate a fakeout.
If BTC stays above $100,000 (200 EMA support), the bullish bias remains intact.

BoC Rate Decision. Is the path for USDCAD is further up?With the upcoming BoC and Fed rate decisions, we are wondering, what may happen with FX_IDC:USDCAD pair? CAD has been on a sharp decline and continues to devaluate further. Let's dig in and see what might be the near-term outcome.
MARKETSCOM:USDCAD
RISK DISCLAIMER
74.2% of retail investor accounts lose money when trading CFDs with this provider. You should consider whether you understand how CFDs work and whether you can afford to take the high risk of losing your money. Past performance is not necessarily indicative of future results. The value of investments may fall as well as rise and the investor may not get back the amount initially invested. This content is not intended for nor applicable to residents of the UK. Cryptocurrency CFDs and spread bets are restricted in the UK for all retail clients.

AUD/USD Resistance Rejection and Bearish OutlookAUD/USD represents the Australian Dollar against the US Dollar in the forex market. The current price is 0.62300, with a target price of 0.60000, indicating a bearish outlook. The expected price drop suggests a potential gain of 200+ pips if the trade moves as anticipated. The analysis is based on the support and resistance pattern, a key concept in technical trading. The price has reached a strong resistance level and is facing rejection, signaling selling pressure. A rejection at resistance often indicates a shift in momentum, leading to a possible downward move. Traders anticipate the price to decline toward the next support level at 0.60000. This setup suggests bearish dominance as long as resistance holds. If the price fails to break above resistance, further downside movement is likely. Proper risk management is crucial, as market conditions can change.

[INTRADAY] #BANKNIFTY PE & CE Levels(29/01/2025)Today will be slightly gap up opening expected in banknifty. Expected opening near 49000 level. After opening if banknifty starts trading and sustain above 49050 level then expected upside rally of 400-500+ points in index. If reversal from this level then banknifty can move upto the 48550 level in today's session.

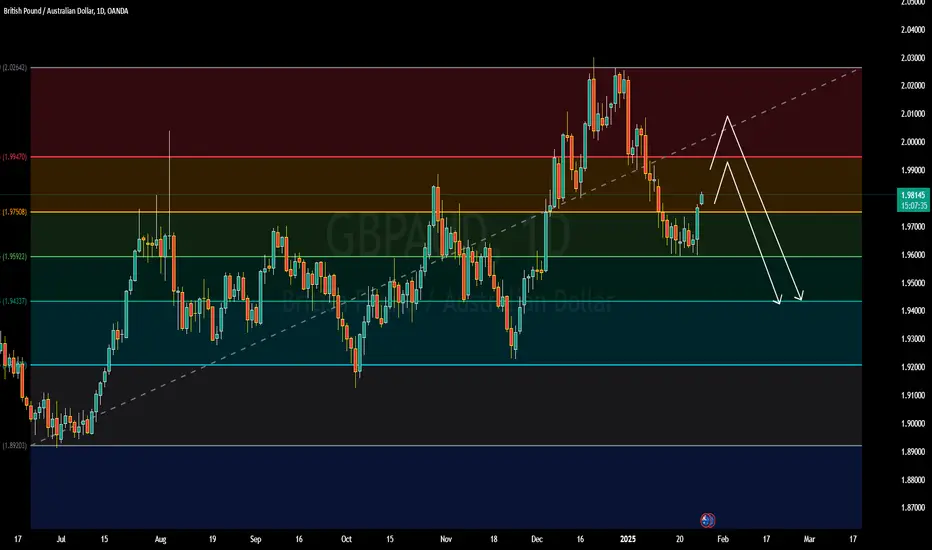
GBPAUD Retesting Resistance with a Potential for Price ReversalGBPAUD is currently trading at 1.981, with a target price set at 2.000, indicating a potential gain of over 200 pips. The market analysis is based on the support and resistance pattern, which suggests key price levels where the pair may react. Currently, the pair is in a retesting phase, meaning it is testing the resistance level after a previous breakout or price movement. This retesting phase helps confirm whether the resistance holds or breaks. If the resistance holds, it signals a potential reversal, leading to a price drop. Traders are advised to closely monitor this retesting period for confirmation before taking positions. A rejection at the resistance level could trigger a bearish move. Patience during this period is critical to avoid premature entries. This setup reflects a potential opportunity for experienced traders following technical analysis strategies.
Technical Analysis on BloomZ Inc. (NASDAQ: BLMZ)The current price of BLMZ stands at 0.500, marking a 3.85% decline for the day. The stock is trading below all key moving averages, including the short-term MA5 (0.509) and MA10 (0.545), as well as the longer-term MA20 (0.562), MA30 (0.561), and MA60 (0.650). This suggests a sustained bearish trend, with selling pressure dominating the market.
Support is evident at 0.450, which aligns with recent lows, while a stronger support level can be identified at 0.392, reflecting a prior low. On the upside, immediate resistance lies at 0.520, which coincides with the previous day’s close. Beyond that, the next significant resistance zone is around 0.560-0.562, where the MA20 and MA30 converge, potentially attracting sellers.
The trading volume is relatively subdued, indicating weak buying interest or a lack of market participation at current levels. Overall, the stock remains bearish but is approaching a critical support level. A breakdown below 0.450 could lead to further downside towards 0.392, whereas a rebound may struggle to overcome resistance at 0.520-0.562. Neutral positioning is advisable until a clear directional move is confirmed.

Technical Analysis of XAUUSD Using Support and Resistance LevelsXAUUSD represents the price of gold (XAU) against the US dollar (USD). Its current price is 2724, and the target price is set at 2800. This suggests a bullish outlook, with an expected price increase of 76 points. The analysis is based on the "support and resistance" pattern, where the current price is rebounding from a strong support level. Support levels act as a price floor, where buying pressure typically overcomes selling pressure, preventing further decline. The strong support indicates high confidence among traders that the price will rise. A move toward the target of 2800 aligns with the historical price behavior near this level. Traders may monitor for confirmation signals, such as higher highs or increased volume, to validate the upward momentum. However, market conditions and external factors like economic data or geopolitical events could influence the pair’s movement. Proper risk management is essential.

Is ASX 200 waiting for a catalyst?Looking at the technical picture of the MARKETSCOM:AUS200 Cash index, we can see that the price remains on an uptrend, while balancing above a medium-term tentative upside support line taken from the lowest point of August 2024. Despite seeing a relatively strong correction lower throughout the whole of December, the index remains resilient to downside pressure. That said, in the short-run, at the time of writing, MARKETSCOM:AUS200 is struggling to break above a key resistance area, around the 8370 barrier.
In order to shift our attention to some higher areas, a break above that key resistance area would be needed. That’s when we may see some more bulls entering the field. If such a move occurs, we might start aiming for the current highest zone, near the 8522 hurdle.
For the downside scenario, we will take a more conservative approach and wait for a break below the previously mentioned upside line. Additionally, a drop below the current lowest point of January, at around 8131 area may invite more bears into the market, potentially opening the door for a move towards the 200-day EMA and the psychological 8000 mark. If that hurdle is unable to withstand the pressure from the sellers, further declines might be possible.
RISK DISCLAIMER
74.2% of retail investor accounts lose money when trading CFDs with this provider. You should consider whether you understand how CFDs work and whether you can afford to take the high risk of losing your money. Past performance is not necessarily indicative of future results. The value of investments may fall as well as rise and the investor may not get back the amount initially invested. This content is not intended for nor applicable to residents of the UK. Cryptocurrency CFDs and spread bets are restricted in the UK for all retail clients.

BTCUSD | 1D SMC Short Setup with Refined SL and TargetsDescription:
This analysis identifies a high-probability short opportunity for BTCUSD on the 1D timeframe using the Smart Money Concepts (SMC) framework. The chart shows clear bearish confluences, including market structure, supply zones, liquidity levels, and Fibonacci retracement zones. I believe the current bullish momentum is merely a manipulation driven by inflation news and the upcoming Trump inauguration. Following these events, I anticipate a significant market correction. Here’s the detailed breakdown and trade plan:
Analysis:
Market Structure:
Break of Structure (BOS): Price has confirmed a bearish trend with BOS to the downside, signaling a continuation of lower highs and lower lows.
Trendline Resistance: A well-defined downward trendline indicates selling pressure, reinforcing the bearish bias.
Key Zones and Liquidity:
Supply Zone: Highlighted in purple at $102,000-$104,000 . This zone represents an area where strong selling previously occurred, creating an imbalance.
Golden Zone (Fibonacci Retracement): Located around $101,000-$103,000 , this area aligns with the 61.8%-78.6% retracement levels and offers a high-probability reversal opportunity.
Weak High: The high near $104,000 represents untapped liquidity, which smart money may target for a liquidity grab before reversing lower.
Equal Lows (EQL): Around $92,000 , these act as a bearish target where liquidity rests, aligning with the continuation of the bearish trend.
Confluences for Short Entry:
Price is approaching the supply zone and Fibonacci Golden Zone , indicating a potential reversal point.
The weak high may trigger a liquidity grab to entice buyers before sellers regain control.
Previous BOS and trendline resistance add further validation to the bearish bias.
Trade Plan:
Short Entry Setup:
Entry Zone: $102,000-$104,000 (inside the supply zone and Golden Zone).
Stop Loss (SL): $105,500 (above the supply zone and imbalance to account for liquidity grabs).
Take Profit Levels:
TP1: $97,000 – Close partial profits at this imbalance mitigation level.
TP2: $92,000 – Target the equal lows and resting liquidity.
TP3: $88,000 – Final target near the blue demand zone for maximum reward.
Risk-Reward Ratio:
With the entry at $103,000 (midpoint of supply), SL at $105,500, and TP at $92,000, the trade offers a 1:4 RR or better, depending on execution and scaling.
Additional Notes:
Monitor the price action closely as BTC approaches the supply zone for confirmation, such as bearish candlestick patterns or lower timeframe CHoCH (Change of Character).
Scaling into the trade in smaller portions across the supply zone can improve overall entry precision.
Adjust stop loss or take profit levels as market conditions evolve

Can a breakthrough to the upside be maintained of S&P500?From the technical side, we are seeing a small push higher, breaking above a short-term downside line. Despite this being a somewhat positive occurrence, we would rather wait to see where we close at the end of Friday. For more information, please see the video.
MARKETSCOM:US500
RISK DISCLAIMER
74.2% of retail investor accounts lose money when trading CFDs with this provider. You should consider whether you understand how CFDs work and whether you can afford to take the high risk of losing your money. Past performance is not necessarily indicative of future results. The value of investments may fall as well as rise and the investor may not get back the amount initially invested. This content is not intended for nor applicable to residents of the UK. Cryptocurrency CFDs and spread bets are restricted in the UK for all retail clients.

RAY ANALYSIS📊 #RAY Analysis : Update
✅As we said earlier, #RAY performed same. Resistance1 done in #RAY. There is a formation of Flag and Pole Pattern on daily chart.🧐
Current we can see a little retest and then we could target for next resistance
👀Current Price: $5.520
🚀 Target Price: $6.390
⚡️What to do ?
👀Keep an eye on #RAY price action and volume. We can trade according to the chart and make some profits⚡️⚡️
#RAY #Cryptocurrency #TechnicalAnalysis #DYOR

GOLD approaching key short-term resistance. What's next?Gold is moving in the upwards direction, despite the higher US CPI reading, which benefits the US dollar. However, there is a possibility that the higher inflation reading was already priced in and maybe this could lead to slower upside pace for the US dollar. Let's dig in...
TVC:GOLD TVC:DXY MARKETSCOM:GOLD MARKETSCOM:DOLLARINDEX
RISK DISCLAIMER
74.2% of retail investor accounts lose money when trading CFDs with this provider. You should consider whether you understand how CFDs work and whether you can afford to take the high risk of losing your money. Past performance is not necessarily indicative of future results. The value of investments may fall as well as rise and the investor may not get back the amount initially invested. This content is not intended for nor applicable to residents of the UK. Cryptocurrency CFDs and spread bets are restricted in the UK for all retail clients.

CADJPY Rising Wedge Breakout and Targeting Support LevelCADJPY is currently trading at 108.300, with a target price set at 106.000, offering a potential gain of 200+ pips. The analysis is based on a support and resistance pattern, indicating the pair’s key price levels. A rising wedge breakout has already occurred, a bearish signal pointing to further downside potential. The price is now positioned below a major resistance level, confirming sellers' dominance in the market. With this setup, the pair is likely to continue its downward movement toward the main support level, which aligns with the target price. The bearish momentum is expected to persist as long as the resistance level holds strong. Traders should watch for any confirmation of increased selling pressure to solidify this trend. This setup highlights a favorable opportunity for bearish trades with a defined risk-reward ratio. The focus remains on the target support level as the next key price point.

[INTRADAY] #BANKNIFTY PE & CE Levels(16/01/2025)Today will be gap up opening in banknifty. Expected opening near 49000 level. After opening possible reversal from this level to continue bearish trend. If reversal confirmation at this level can gives 400-500 points downside rally in banknifty. This rally can be extend for another 400-500 points if its starts trading below 48450 level. Any upside rally only expected if banknifty sustain and starts trading above 49050 level.

Bouncing Back: EUR/USD Poised for a Bullish WaveEUR/USD is trading at 1.0257, showing signs of bullish momentum with a target price of 1.0800. The price action is based on the support and resistance pattern, with the pair currently bouncing off a strong support level. This bounce indicates a potential reversal and the start of an upward trend. The support level serves as a foundation for buyers to regain control, pushing the price higher. A steady climb toward the resistance level at 1.0800 is expected if the support holds firm. Traders should monitor this bounce closely for confirmation of bullish momentum. The setup presents a favorable opportunity for long positions, supported by technical analysis. However, risk management remains crucial to navigate market volatility. This move emphasizes the role of key levels in predicting price movements. Patience and strategy are essential to capitalize on this trade setup.
