Ethereum Trades Sideways Testing Critical Support FenzoFx—Ethereum trades sideways, unable to surpass $1,690 resistance. Currently, it hovers at $1,565, testing this level as support.
The bearish trend persists below $1,755. Stabilization under $1,565 may lead to dips toward $1,470 and potentially $1,370 if selling pressure increases.
>>> No Deposit Bonus
>>> %100 Deposit Bonus
>>> Forex Analysis Contest
All at F enzo F x Decentralized Forex Broker
Technical Analysis

Crude Oil AnalysisFenzoFx—Crude Oil started a bullish wave from $55.15, trading at around $62.20. Momentum slowed near $63.90 resistance.
The Stochastic Oscillator indicates short-term overpricing as Crude Oil remains below $63.90, keeping the bearish trend intact. Price may dip toward $58.90 support, with further pressure potentially driving it to $55.15.
If Crude Oil surpasses $63.90, the bearish outlook invalidates, targeting $65.10 resistance.
>>> No Deposit Bonus
>>> %100 Deposit Bonus
>>> Forex Analysis Contest
All at F enzo F x Decentralized Forex Broker

GBPUSD: Intraday Bullish Move Ahead! 🇬🇧🇺🇸
I see 2 strong intraday price action signals
on GBPUSD on an hourly time frame.
The price formed a double bottom pattern after a test of the underlined support.
Its neckline and a resistance line of a falling channel were broken
with London session opening.
We can expect a bullish continuation now.
Goal - 1.3271
❤️Please, support my work with like, thank you!❤️

#PARTIUSDT is showing signs of a reversal🚀 The price BYBIT:PARTIUSDT.P is showing signs of a reversal after a prolonged downtrend.
🚀 The scenario becomes more likely if the price holds above $0.1520 with increasing volume.
🚀 Watch for a breakout and confirmation above the $0.1500–$0.1520 zone — this would strengthen the bullish setup.
🚀 If volume picks up during the continuation of the move, a quick push toward $0.18 is possible.
📈 LONG BYBIT:PARTIUSDT.P from $0.1533
🛡 Stop loss: $0.1492
🕒 Timeframe: 1H
✅ Overview:
➡️ The price has broken out above the Bearish Flag, confirming a break in the downtrend structure.
➡️ The Double Bottom formation increases the likelihood of an upward move.
➡️ Entry at $0.1533 is just above the resistance zone and confirms the breakout.
➡️ The upward potential remains toward $0.1600 and beyond, aiming for the POC volume area.
🎯 TP Targets:
💎 TP 1: $0.1555
💎 TP 2: $0.1575
💎 TP 3: $0.1600
📢 Support zone: $0.1500–$0.1510 — must hold to maintain the bullish structure.
📢 If price consolidates above $0.1555, expect a potential acceleration toward $0.1600.
📢 A drop below $0.1492 invalidates the scenario — stop is mandatory.
🚀 BYBIT:PARTIUSDT.P breaks key level — bullish signal confirmed! Watch for continuation!

Sanathan Textiles | Breakout After Rounded Bottom Setup Overview:
The stock has formed a rounded bottom pattern, indicating accumulation and a potential breakout.
Strong bullish weekly candle with a 10% gain and breakout above resistance box.
RSI showing an upward breakout from oversold zone = bullish momentum building.
Recommendation
Buy Zone: ₹410–₹420 (current market price ₹417.60)
Stoploss: ₹378 (below last higher low and box bottom)
Target 1: ₹480
Target 2: ₹525
Target 3 (swing): ₹600+
⏳ Ideal for swing to medium-term traders (1–8 weeks holding time).
for educational purposes only

#NIFTY Intraday Support and Resistance Levels - 17/04/2025Slightly gap down expected in nifty. After opening if nifty sustain above 23300 level then expected nifty will consolidated between 23300 to 23500 level in today's session. Any strong rally in index only expected breakout of this level. Strong upside rally expected if nifty starts trading above 23500 level in today's session.

Nightly $SPY / $SPX Scenarios for April 17, 2025🔮 🔮
🌍 Market-Moving News 🌍:
🇪🇺 ECB Expected to Cut Rates Amid Trade Pressures: The European Central Bank is anticipated to reduce its deposit rate by 25 basis points to 2.25% during its meeting on April 17. This expected move aims to counteract the economic impact of recent U.S. tariffs and a strengthening euro, which have contributed to disinflationary pressures in the eurozone.
📉 German Inflation Decline Supports Easing: Germany's inflation rate fell more than expected in March, dropping to 2.3% from 2.6% in February. This decline, driven by falling oil prices and a sluggish economy, bolsters the case for further interest rate cuts by the ECB.
🤖 AI Enhances ECB Policy Predictions: A study by the German Institute for Economic Research indicates that artificial intelligence significantly improves the accuracy of forecasting ECB monetary policy decisions. By analyzing ECB communications, AI models can better anticipate policy shifts.
📊 Key Data Releases 📊
📅 Thursday, April 17:
🏠 Housing Starts (8:30 AM ET):
Forecast: 1.420 million
Previous: 1.501 million
Indicates the number of new residential construction projects begun, reflecting housing market strength.
🏭 Philadelphia Fed Manufacturing Survey (8:30 AM ET):
Forecast: 3.7
Previous: 12.5
Measures manufacturing activity in the Philadelphia region, providing insights into sector health.
📈 Initial Jobless Claims (8:30 AM ET):
Forecast: 223,000
Previous: 223,000
Reports the number of individuals filing for unemployment benefits for the first time, reflecting labor market conditions.
⚠️ Disclaimer: This information is for educational and informational purposes only and should not be construed as financial advice. Always consult a licensed financial advisor before making investment decisions.
📌 #trading #stockmarket #economy #news #trendtao #charting #technicalanalysis

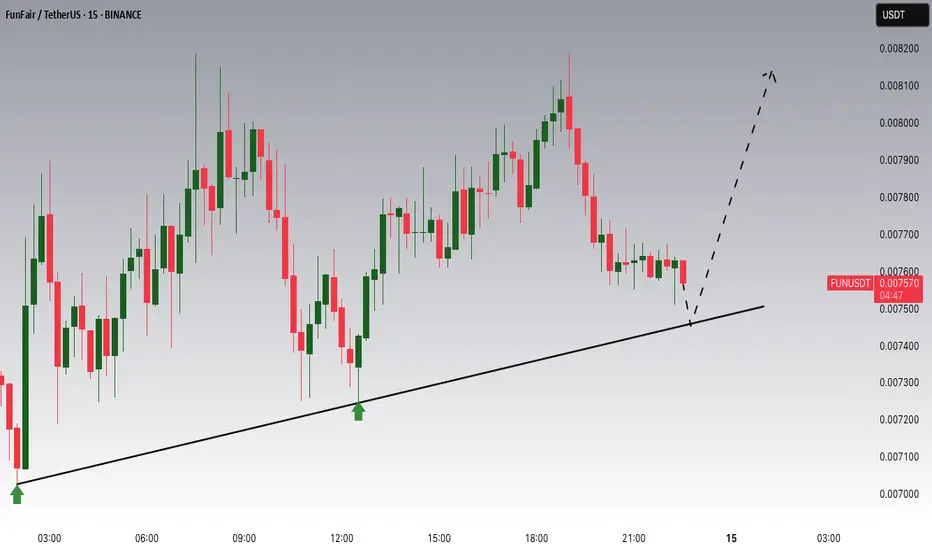
FUN/USDT In an Uptrend, Watching for Correction at Key SupportFUN/USDT has been in a solid uptrend, but we are now seeing a correction phase. The price is approaching a critical support zone around 0.007460, where previous price action has shown both support and resistance. This level is important to watch, as it could provide a potential buying opportunity if price reacts here. A break below could suggest further downside, but if support holds, a bounce toward the recent highs is possible. Monitoring closely for confirmation at this key level.
NASDAQ Potential DownsidesHey Traders, in today's trading session we are monitoring NAS100 for a selling opportunity around 19200 zone, NASDAQ is trading in a downtrend and currently is in a correction phase in which it is approaching the trend at 19200 support and resistance area.
Trade safe, Joe.

GBPUSD Potential UpsidesHey Traders, in today's trading session we are monitoring GBPUSD for a buying opportunity around 1.32300 zone, GBPUSD is trading in an uptrend and currently is in a correction phase in which it is approaching the trend at 1.32300 support and resistance area.
Trade safe, Joe.

EURJPY Potential DownsidesHey Traders, in today's trading session we are monitoring EURJPY for a selling opportunity around 162.100 zone, EURJPY is trading in a downtrend and currently is in a correction phase in which it is approaching the trend at 162.100 support and resistance area.
Trade safe, Joe.

BITCOIN Supply Demand Short ALERT1) See picture for full analysis...
Higher Timframe:
-Price inside supply
-Trend = downtrend
-Stochastic RSI overbought
Lower Timeframe:
-Need break to break support + break upward trend-line + quality supply created.
- IF price does the following then possible pullback for short OR look for scalp/day-trade shorts
to the downside with 1TF setups.
#supplyanddemand #supportandresistance

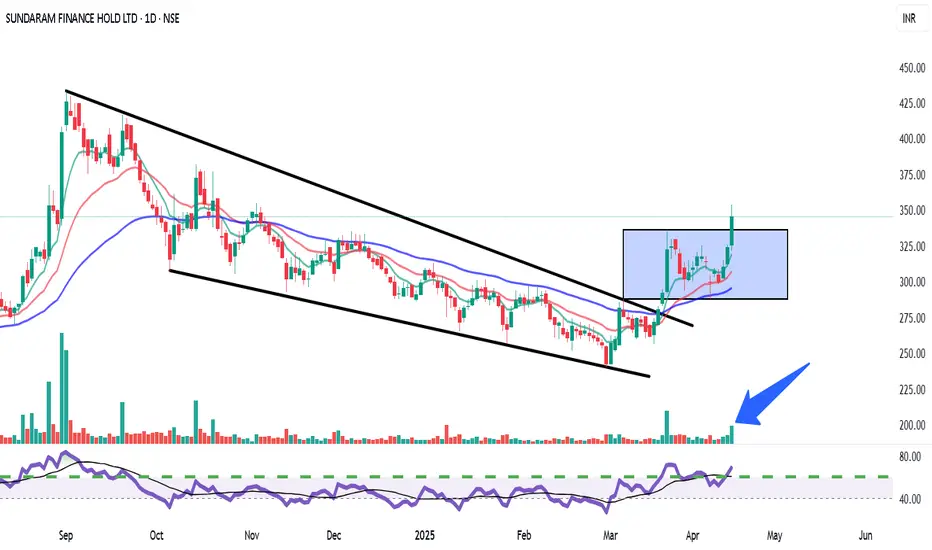
Sundaram Finance | Falling Wedge Breakout with Strong Volume Pattern: Falling Wedge breakout followed by consolidation (bullish continuation).
Breakout Confirmation: Clean breakout from both the wedge and the consolidation box with strong volume.
Indicators:
Volume: Spike visible (🔵 arrow) – confirming strength.
RSI: Crossed above 60 – entering bullish momentum territory.
EMAs: Price trading above all major EMAs – trend supportive.
Buy Recommendation:
Entry Range: ₹340–₹350
(Post-breakout retest may offer ideal entries if available)
🎯 Target Levels:
Short-Term Target: ₹375
Mid-Term Target: ₹410–₹425
(Based on previous swing highs and wedge height projection)
🛑 Stop Loss:
SL Level: ₹320 (below the consolidation box low)
for educational purposes only
ICICI Prudential Life – Turning the Corner?After months of steady decline inside a falling channel, ICICI Prudential Life is showing early signs of reversal. The stock has recently broken out of its channel with a strong bullish weekly candle, closing at ₹571.70 with a +4.5% gain. Volume is picking up, and RSI is curling up above 40 with a bullish divergence—indicating momentum is building. Price is now near a key resistance zone (~₹590–₹610); a clean breakout here could confirm trend reversal.
📊 Financial Snapshot
Net Premium Income: ₹10,169 Cr vs ₹9,465 Cr ⬆️
PAT: ₹226 Cr vs ₹221 Cr (flat YoY)
VNB Margin: Healthy at 26.7%
Embedded Value: ₹47,020 Cr
Solvency Ratio: Strong at 211%
AUM: ₹2.88 Lakh Cr
💡 Why Consider Buying?
Reversal setup after long correction
Attractive risk-reward near base
Steady premium growth, strong solvency
Long-term growth play on India’s underpenetrated life insurance sector
🚫 Risks / Why to Wait:
Resistance at ₹590–₹610 still intact
PAT growth has been flat
Sector sentiment can be sensitive to interest rate trends
🎯 Trade Setup:
Buy Zone: ₹565–575
Target 1: ₹610
Target 2: ₹660
Stop Loss: ₹540
for educational purposes only

Bearish Momentum Eases at 141.70 Support in USD/JPYFenzoFx—The USD/JPY currency pair resumed its bearish trend after breaking below 144.56 but steadied at the 141.70 support level. Indicators show sideways movement, reflecting a lack of momentum.
With the price below the 50-period moving average, the bearish outlook persists. If the pair stabilizes below 141.70, the downtrend may deepen, while surpassing 144.56 could pave the way for a rise toward 148.20.
>>> No Deposit Bonus
>>> %100 Deposit Bonus
>>> Forex Analysis Contest
All at F enzo F x Decentralized Forex Broker

USDCHF: Your Next Bearish Signal 🇺🇸🇨🇭
USDCHF is consolidating after a massive selloff that we saw last week.
The price formed inside bar candlestick pattern and is currently
stuck within the range of the mother's bar.
Your next confirmation to sell will be a violation and a candle close
below 0.8098.
With a high probability, the pair will continue falling then
and reach at least 0.8 psychological level.
❤️Please, support my work with like, thank you!❤️
I am part of Trade Nation's Influencer program and receive a monthly fee for using their TradingView charts in my analysis.

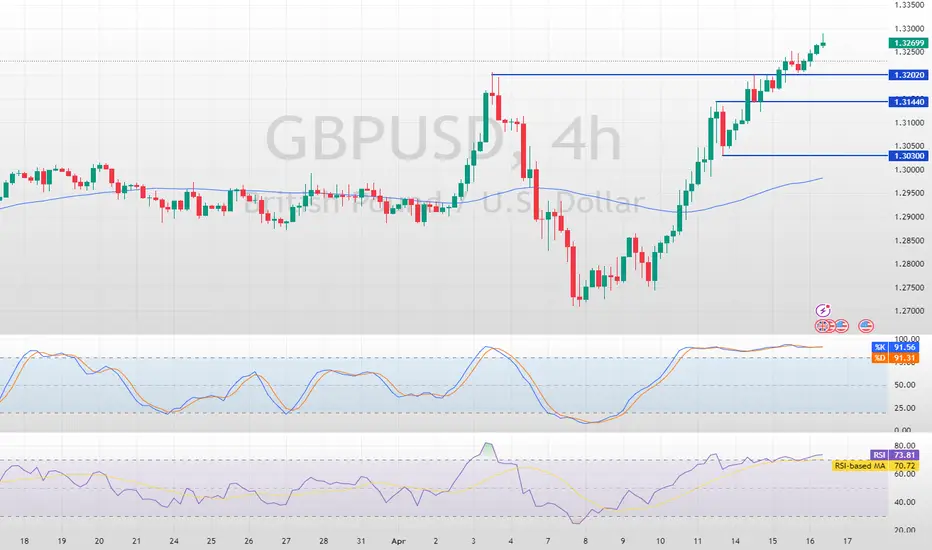
GBP/USD Breaks $1.3202: Bullish Market InsightsFenzoFx—The GBP/USD currency pair shows strong bullish momentum, breaking above $1.3202 yesterday. With overbought signals from the Stochastic indicator, a consolidation phase may lead to declines toward $1.3144 and $1.3030.
Traders should watch for bullish candlestick patterns near these support levels.
>>> No Deposit Bonus
>>> %100 Deposit Bonus
>>> Forex Analysis Contest
All at F enzo F x Decentralized Forex Broker
Gold Hits New ATH Amid Escalating US–China Tensions📌 Gold Hits New ATH Amid Escalating US–China Tensions: How Far Can It Go? 🧨📈
Gold has reached another all-time high (ATH) as geopolitical tensions between the United States and China intensify. Markets have become incredibly sensitive, reacting sharply to political rhetoric and economic policy shifts from the world’s most powerful leaders.
As investors grow increasingly uneasy, gold continues to serve its role as a safe haven — but the real question now isn't whether gold will rise, but rather: how high can it go?
🌍 Geopolitical Sensitivity at its Peak
A single tariff threat or retaliation can trigger gold to surge by $30–$50.
Conversely, a pause in policy or a diplomatic “cool down” can cause price to drop hundreds of points.
In this environment, political narratives are driving markets more than technical setups.
This is one of those rare moments where fundamentals and news flow completely overshadow traditional chart signals. Even textbook candle confirmations are losing reliability — clean bullish closures are often followed by equally strong bearish rejections.
📊 Key Levels to Watch
Support Zones:
3,280 / 3,268 / 3,258 / 3,240 / 3,230
Resistance Zones:
3,292 / 3,302 / 3,310/ 3330
⚙️ Trading Zones
🔽 Sell Zone:
Entry: 3,330 – 3,332
SL: 3,336
TP: 3,325 → 3,320 → 3,315 → 3,310 → 3,300
📈 Buy Zone #1:
Entry: 3,270 – 3,268
SL: 3,264
TP: 3,274 → 3,278 → 3,282 → 3,286 → 3,290 → 3,300
📈 Buy Zone #2:
Entry: 3,240 – 3,238
SL: 3,234
TP: 3,245 → 3,250 → 3,255 → 3,260 → 3,264 → 3,268 → 3,274 → 3,280 → OPEN
⚠️ Final Thoughts & Risk Advisory
With geopolitical tensions rising and volatility surging, trading gold requires extra caution. Avoid chasing momentum blindly — even strong confirmations can flip without warning.
This is a market driven by emotions, news headlines, and global uncertainty, not just technicals. Always stick to your trading plan, and more importantly: respect your SL/TP at all times.
💬 How are you approaching gold in this macro environment? Share your views below – are you holding long or fading the rallies? 👇👇👇

Oil slumps as demand outlook dims and supply risesMacro:
- Oil prices stay weak as trade war fears weigh on global growth and energy demand.
- The IEA cut its 2025 oil demand growth forecast to just 730k bpd, the slowest pace in five years, down from 1.03 mln.
- Meanwhile, OPEC+ output is rising, with Saudi Arabia set to boost exports to China in May and Russia maintaining steady production, fueling oversupply concerns.
Technical:
- USOIL is in a clear downtrend fueled by lower highs and lows. The price is below both EMAs, indicating persistent downward momentum.
- If USOIL closes above the resistance at 63.30, the price may retest the following resistance at 65.80.
- On the contrary, remaining below 68.30 may pave the way to retest the support at 57.25 and 53.85, respectively.
Analysis by: Dat Tong, Senior Financial Markets Strategist at Exness

DIVISLAB: Eyeing Breakout from A-B-C ChannelDaily TF
DIVISLAB is nearing the completion of a complex W-X-Y corrective pattern. A long position could be considered after a breakout from the A-B-C channel, with potential targets in the 6100–6400 range.
I will update more information soon.

EUR/GBP – Trendline Break & Retest: Reversal Confirmed?Technical Outlook:
EUR/GBP has broken above the descending trendline and is now retesting it from above near 0.8540–0.8560. This zone is critical — holding it confirms a trend reversal. If successful, the next upside targets are 0.8625 and 0.8680. RSI remains above 50, and MACD continues to support bullish momentum.
Fundamentals:
Dovish expectations from the BoE weigh on the pound. The euro gains support from improving inflation outlook and capital inflows. Interest rate differentials now favor EUR.
Scenarios:
📈 Main: bounce from 0.8540–0.8560 → move to 0.8625 and 0.8680
📉 Alt: break below 0.8540 → retracement to 0.8500–0.8480

#NIFTY Intraday Support and Resistance Levels - 16/04/2025Today will be slightly gap up opening expected in nifty. After opening if nifty sustain above 23300 level then possible upside rally upto 23500 in opening session. This rally can be expected for further 200+ points in case nifty gives breakout and starts trading above 23550 level. Any major downside only expected below 23250 level.

[INTRADAY] #BANKNIFTY PE & CE Levels(16/04/2025)Today will be gap up opening in banknifty. After opening if banknifty starts trading above the 52550 level then this bullish rally can goes upto 52950 level in opening session. This can be extend for further 400-500+ points in case banknifty gives breakout of 53000 level and sustain above 53050 level. 52950 level will act as a resistance for today's session. Any reversal can gives downside movement upto 52550 level. Any major downside only expected below 52450 level.
