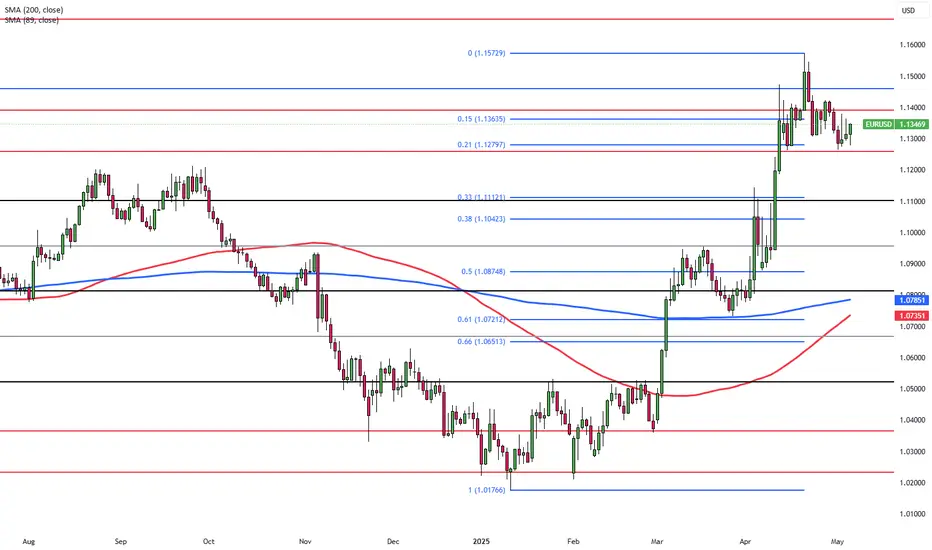
Euro Strengthens on Political ShiftsEUR/USD traded just above 1.1300 on Thursday, staying in a tight range as reduced political uncertainty in Europe and a softer U.S. dollar offered mixed cues. The euro was supported by news of Friedrich Merz becoming Germany’s chancellor, while the dollar struggled despite a hawkish Fed pause, as Powell flagged tariff-related risks. Traders are focused on Trump’s press conference at 14:00 GMT and U.S. jobless claims for near-term direction.
Resistance is seen at 1.1460, with higher levels at 1.1580 and 1.1680. Support lies at 1.1260, followed by 1.1200 and 1.1150.
Technical Analysis

Yen Firms with BoJ CautionThe Japanese yen strengthened to around 143.6 per dollar on Thursday, recovering as rising global trade uncertainty stimulated demand for gold. The move followed President Trump’s announcement of a deal with a “big” country, reportedly the UK, and his refusal to cut tariffs on China ahead of U.S.-China talks in Switzerland. U.S.-Japan negotiations continue, with Tokyo aiming to finalize a bilateral deal by June. Meanwhile, BoJ minutes showed policymakers remain open to rate hikes if inflation targets are met, though they flagged external risks from U.S. trade policy.
Resistance stands at 145.90, with further levels at 146.75 and 149.80. Support is found at 139.70, then 137.00 and 135.00.

Gold Price Drops: A Great Buying OpportunityFenzoFx—Gold formed a new bearish wave after the price dipped below $3,360. As of this writing, XAU/USD is testing the $3,323 support, which could potentially offer a favorable entry point into the bull market.
The price will likely rise toward $3,360 if this level holds. Please note that the market outlook remains bullish as long as the price stays above the $3,323 support.
>>> Prop Trading
>>> No Deposit Bonus
>>> %100 Deposit Bonus
>>> Forex Analysis Contest
All at FenzoFx Decentralized Forex Broker

DXY Rebounds on Fed Pause and Trade Deal Hopes.Macro approach:
- DXY edged higher, recovering earlier losses as the Fed held rates and Powell was cautious.
- Jun cut hopes faded, though markets expect three cuts this year, potentially lifting DXY short-term.
- A potential US-UK trade deal also helps ease bearish sentiment on the dollar.
Technical approach:
- DXY is hovering around the key resistance at around 100.200, confluence with EMA21, indicating a potential short-term correction.
- If DXY closes above the resistance at 100.200, the price may continue to claim to retest the following resistance at 101.800.
- Conversely, closing below the current trendline may lead DXY to retest the swing low at around 98.000.
Analysis by: Dat Tong, Senior Financial Markets Strategist at Exness

CESC Ltd – Short-Term Breakout Idea|Target: ₹171.00 CMP: ₹165.70
Recommended Buy Range: ₹164.50 – ₹165.00
Target: ₹171.00 🎯
Stop Loss: ₹161.50 🛡️
Timeframe: 15 min & 1H
Risk-Reward: ~1.4:1
Type: Momentum Breakout / Swing Trade
🔍 Technical Analysis:
✅ EMA Cross (9/13) bullish crossover
✅ Price trading above EMA-26
✅ RSI at 65 – bullish, not overbought
✅ BB %B around 1.0 – strong upper band breakout
✅ Volume spike supports the move
Watch for a strong close above ₹167 to confirm momentum toward ₹171.
For Education Purposes Only

[INTRADAY] #BANKNIFTY PE & CE Levels(08/05/2025)Flat opening in banknifty. After opening if banknifty sustain above 54550 level then expected upside movement upto 54950+ level in opening session. Downside movement expected if banknifty starts trading below 54450 level. Downside 54050 level will act as an important support for today's session. Any major downside only expected below this support level.

Nightly $SPY / $SPX Scenarios for May 8, 2025🔮 Nightly AMEX:SPY / SP:SPX Scenarios for May 8, 2025 🔮
🌍 Market-Moving News 🌍
🇺🇸 Fed Holds Rates Steady Amid Economic Uncertainty
The Federal Reserve maintained its benchmark interest rate at 4.25%-4.5%, citing concerns over rising inflation and economic risks. Fed Chair Jerome Powell emphasized a cautious approach, indicating no immediate plans for policy changes.
🤝 U.S.-China Trade Talks Scheduled
Treasury Secretary Scott Bessent and chief negotiator Jamieson Greer are set to meet China's economic head He Lifeng in Switzerland, marking a potential step toward resolving trade tensions. The announcement has positively influenced global markets.
📈 Record $500 Billion Share Buyback Plans
U.S. companies have announced a record-breaking $500 billion in share buybacks, reflecting growing hesitation to make capital investments amid economic uncertainty driven by President Trump's trade policies. Major contributors include Apple ( NASDAQ:AAPL ), Alphabet ( NASDAQ:GOOGL ), and Visa ( NYSE:V ).
⚠️ Recession Warnings from Economists
Former IMF chief economist Ken Rogoff warns that a U.S. recession is likely this summer, primarily driven by President Donald Trump's aggressive tariff policies. He suggests that markets are overly optimistic and not adequately accounting for the risks.
📊 Key Data Releases 📊
📅 Thursday, May 8:
8:30 AM ET: Initial Jobless Claims
8:30 AM ET: Continuing Jobless Claims
8:30 AM ET: Nonfarm Productivity (Q1 Preliminary)
8:30 AM ET: Unit Labor Costs (Q1 Preliminary)
10:00 AM ET: Wholesale Inventories (March Final)
10:30 AM ET: Natural Gas Storage
⚠️ Disclaimer:
This information is for educational and informational purposes only and should not be construed as financial advice. Always consult a licensed financial advisor before making investment decisions.
📌 #trading #stockmarket #economy #news #trendtao #charting #technicalanalysis

Equity Research - TATA MOTORS LTD 📈 Buy Zone: ₹670.50 – ₹680.30
🎯 Target: ₹740.00
🛑 Stop Loss: ₹641.70
💹 CMP: ₹680.30
Technical Highlights:
✅ Bullish volume spike
✅ RSI above 60 – strong momentum
✅ Price above 20EMA & 50EMA
✅ Breakout and retest on 15m & 1H chart
✅ Good risk-reward setup
📊 Strategy: Wait for confirmation candle on 15min TF above ₹681 for entry.
📉 Stop loss below recent swing low at ₹641.70.
For Education Purposes Only

Gold Ahead of FOMC – China Rate Cut Shocks Market as USD Surges⚠️ Gold Ahead of FOMC – China Rate Cut Shocks Market as USD Surges
Gold (XAU/USD) is facing a pivotal moment after a dramatic correction from $3,435 down to the 3,360s, triggered by a combination of surprising policy moves and rising macro uncertainty.
🧭 Macro Recap: Why Did Gold Drop?
🇨🇳 China unexpectedly cut interest rates by 10 basis points ahead of a key trade dialogue with the US.
➤ This supports global liquidity sentiment but simultaneously strengthens the USD in the short term.
💵 DXY surged, taking advantage of China's rate cut — adding pressure to gold.
⚠️ Geopolitical tensions in South Asia (India–Pakistan) resurfaced but failed to lift gold.
➤ This hints that the current correction is more dollar-driven than risk-off in nature.
🏛️ All eyes now shift to FOMC later today, where Fed policy will dictate gold’s next major move.
Will Powell surprise markets with dovish signals, or does this China cut hint at coordinated central bank play before a wider easing cycle?
📊 Technical Outlook – Gold in Volatile Expansion
Despite the macro volatility, gold continues to respect key liquidity zones and high-volume clusters on the chart. However, momentum is broad and inconsistent — requiring traders to react to confirmed breaks, not early assumptions.
🔺 Resistance Levels:
3390 → 3402 → 3416 → 3425 → 3432 → 3444 → 3468
🔻 Support Levels:
3365 → 3356 → 3332 → 3314
🎯 Trade Strategy – 7 May 2025 (FOMC Day)
🟢 BUY SCALP
Entry: 3355
SL: 3350
TPs: 3360 → 3364 → 3368 → 3372 → 3376 → 3380
🟢 BUY ZONE (Mid-Term Opportunity)
Entry: 3332 – 3330
SL: 3326
TPs: 3336 → 3340 → 3344 → 3348 → 3352 → 3358 → 3365
⚠️ Key BUY Level: 3314 – 3312
This is a critical level for bulls — aligned with 0.5 FIBO retracement and previous demand flip zone. However, a move here could invalidate structure and signal deeper bearish pressure. Use caution.
🔴 SELL SCALP
Entry: 3430 – 3432
SL: 3436
TPs: 3425 → 3420 → 3415 → 3410 → 3400
🔴 SELL ZONE (High-Risk Short)
Entry: 3468 – 3470
SL: 3474
TPs: 3464 → 3460 → 3455 → 3450 → 3445 → 3440 → 3430
🧠 Final Thoughts:
Gold remains range-bound but extremely reactive to macro news.
Today’s FOMC meeting could be a game changer. Whether the Fed maintains its current stance or signals dovish pivot will determine the direction for the rest of the week.
🎯 In times like this, it’s not about picking tops or bottoms — it’s about trading the reaction and protecting your capital.
✅ Stick to SL.
✅ Let price confirm.
✅ Be prepared for high volatility spikes.
Good luck, traders — and stay sharp.

GOLD POTENTIAL SELL LIMITHere's a script:
"Gold Sell Zone Setup: Current analysis
indicates a potential selling opportunity in Gold, with a sell zone identified between $3434 and $3419.
This range is expected to act as resistance,
potentially leading to a price decline.
Consider selling within this zone, with targets at lower support levels. Monitor market dynamics and adjust strategies accordingly."

"Nifty 50 Eyes Breakout from Key Support Zone"**Support Zone (Red Rectangle)**:
* Strong support between ₹24,290 – ₹24,340.
* Multiple price bounces have occurred here, indicating demand presence.
**Resistance Levels**:
* **Immediate resistance**: ₹24,409.65 (horizontal red line)
* **Next resistance**: ₹24,494.45
**Support Levels**:
* **Immediate support**: ₹24,290
* **Next support**: ₹24,240.65
**RSI (Relative Strength Index) – 14 Period**
* RSI is at **36.25**, near the oversold region.
* Indicates the index may be poised for a short-term bounce.
* Positive RSI divergence is not yet confirmed but should be monitored.
---
**Bullish Scenario**:
* A breakout above the black descending trendline (\~₹24,360) with volume can lead to:
* First target: ₹24,409.65
* Second target: ₹24,494.45
* Supported by wedge breakout and RSI recovery.
**Bearish Scenario**:
* Breakdown below ₹24,290 zone can trigger a fall to:
* First target: ₹24,240.65
* Second target: Lower bound of ascending channel (\~₹24,060)

TURBO ANALYSIS🔆#TURBO Analysis : Channel Following ⛔️⛔️
As we can see that #TURBO is following ascending channel on 4h time frame. We can see a bullish formation here. And if it trade with good volume then we can see a proper bullish move in #TURBO📈📈
🔖 Current Price: $0.005610
⏳️ Target Price: $0.006160
⁉️ What to do?
- Keep your eyes on the chart, observe trading volume and stay accustom to market moves.🚀💸
#TURBO #Cryptocurrency #ChartPattern #DYOR

Taiwan Dollar Weakens Past 30 per USD Amid Trade Rumors and CentThe Taiwanese dollar weakened past 30 per USD on Tuesday, reversing a two-day rally and retreating from its strongest level in nearly three years.
📉 Recent gains in Asian currencies like the TWD and MYR were fueled by speculation over regional support for U.S. trade talks. However, Taiwan’s central bank denied any such coordination, stating the U.S. made no formal request. President Lai Ching-te also warned against spreading misinformation.
🔧 As a key player in global chip production, Taiwan remains highly exposed to shifts in trade dynamics and geopolitical risks.

GBP Falls Ahead of Fed and BOE MeetingsSterling fell 0.24% to $1.3265 on Tuesday as the U.S. dollar firmed ahead of the Federal Reserve’s policy decision, with rates expected to remain unchanged. While the dollar recovered slightly, doubts over its safe-haven appeal and Trump’s tariff stance persist. Markets also await the Bank of England’s meeting, where a 25 bps rate cut is expected. Dovish signals or dollar softness may support GBP/USD.
If GBP/USD breaks above 1.3430, the next resistance levels are 1.3500 and 1.3550. Support levels are at 1.3200, followed by 1.3050 and 1.2960.

Euro Pressured Ahead of Fed DecisionThe euro is trading around $1.1315 on Tuesday, pressured by a stronger U.S. dollar ahead of the Federal Reserve’s policy decision, where rates are expected to remain unchanged. However, the dollar still faces headwinds from doubts over its safe-haven appeal and President Trump’s unpredictable tariff stance. A dovish Fed or continued skepticism toward the dollar may limit euro losses.
Resistance levels are seen at 1.1460, then 1.1580 and 1.1680, while support rests at 1.1260, followed by 1.1200 and 1.1150.
USDJPY: Pullback From Support 🇺🇸🇯🇵
There is a high chance that USDJPY will pull back from the underlined blue support.
AS a confirmation, I see a violation of a resistance line of a falling
wedge pattern on an hourly time frame.
Target - 144.35
❤️Please, support my work with like, thank you!❤️

AUDNZD (4H) Symmetrical Triangle Breakout+Falling Wedge ReversalOn the 4-hour chart of AUDNZD, the market has completed a compression phase inside a symmetrical triangle, nested within a larger falling wedge structure. Both patterns suggest a potential bullish reversal after an extended downward trend.
The breakout occurred to the upside, with price moving above the triangle and breaking through short-term resistance around 1.0713. Volume increased on the breakout, confirming genuine buyer interest. If the price holds above this level and breaks 1.0766, it opens the path to the next major target at 1.0844, aligned with the previous key swing level.
Technical picture:
– Symmetrical triangle breakout confirmed
– Price also broke out of the falling wedge
– Volume expansion on the move
– Bullish realignment of EMAs is starting
– Holding above 1.0713 + breaking 1.0766 will activate the next phase
Fundamental backdrop:
The Australian dollar is benefiting from resilience in the commodity and export sectors, while the New Zealand dollar faces pressure from weakening inflation and growing expectations of monetary easing by the RBNZ. This economic divergence creates short-term advantage for AUD over NZD.
This double-pattern setup confirms the transition from consolidation to bullish impulse. Holding above 1.0713 and a confirmed break above 1.0766 would unlock a move toward 1.0844. These patterns offer clean early entries into trend reversals.

EUR/USD Rejected at Resistance – Bearish Setup in Motion!Timeframe: 15-Minute (M15)
Designed for short-term or intraday trades.
Entry Zone (Short):
Price is reacting to a fresh supply zone around 1.13260–1.13280.
Stop Loss:
Just above the supply zone, near 1.13280 (tight SL setup).
Bearish Reaction:
Price rejected resistance with a wick and bearish body — strong confirmation of selling pressure.
Target Zone (Demand):
A wide green demand area is marked at 1.12810–1.12830, providing a solid take-profit level.
Structure Bias:
Current formation shows lower highs and clear resistance respect — indicating bearish momentum.
Risk-to-Reward Ratio:
Strong RRR (more than 2:1) – minimal risk for decent reward.

[INTRADAY] #BANKNIFTY PE & CE Levels(06/05/2025)Today will be flat opening in index. After opening if banknifty starts trading and sustain above 55050 level then expected upside movement upto 55450+ level in opening session. Major downside expected if banknifty not sustain above level and starts trading below 54950 then possible downside upto 54550 support level.

Tue 6th May 2025 BTC/USD Daily Forex Chart Sell SetupGood morning fellow traders. On my Daily Forex charts using the High Probability & Divergence trading methods from my books, I have identified a new trade setup this morning. As usual, you can read my notes on the chart for my thoughts on this setup. The trade being a BTC/USD Sell. Enjoy the day all. Cheers. Jim

GOLD(XAUUSD) -Weekly Forecast,Technical Analysis & Trading IdeasMidterm forecast:
2772.38 is a major support, while this level is not broken, the Midterm wave will be uptrend.
TVC:GOLD OANDA:XAUUSD
Technical analysis:
A trough is formed in daily chart at 2956.50 on 04/07/2025, so more gains to resistance(s) 3357.00, 3500.00 and more heights is expected.
Take Profits:
2833.00
2879.11
2955.00
3057.40
3160.00
3257.03
3357.00
3500.00
__________________________________________________________________
❤️ If you find this helpful and want more FREE forecasts in TradingView,
. . . . . . . . Hit the 'BOOST' button 👍
. . . . . . . . . . . Drop some feedback in the comments below! (e.g., What did you find most useful? How can we improve?)
🙏 Your support is appreciated!
Now, it's your turn!
Be sure to leave a comment; let us know how you see this opportunity and forecast.
Have a successful week,
ForecastCity Support Team

TradeCityPro | INJUSDT Ready for a Big Move?👋 Welcome to TradeCityPro Channel!
Let’s dive in and analyze one of the popular crypto projects, INJ, which has a high likelihood of movement, and check our entry triggers together.
🌐 Overview Bitcoin
Before starting the analysis, I want to remind you again that we moved the Bitcoin analysis section from the analysis section to a separate analysis at your request, so that we can discuss the status of Bitcoin in more detail every day and analyze its charts and dominances together.
This is the general analysis of Bitcoin dominance, which we promised you in the analysis to analyze separately and analyze it for you in longer time frames.
📊 Weekly Time Frame
On the weekly time frame, I see that the seventh period is stable, INJ, and compared to the majority of altcoins that have their own low price levels, it is in a better space and is engaged in its own supports!
After breaking the primary trend ceiling, namely 9.28, we experienced a sharp upward movement and formed a historical ceiling at $53, and after forming a distribution box and breaking the important floor of 16.20 and pulling back to it, we experienced a continued decline.
We have now reached support again, which was previously a very important resistance, and now, as a result, it is probably not lost, but the weekly candle is a very good and bearish candle! Don’t forget to save your profit, your strategy booklet, and your positions, otherwise, you will have made a 450% move without adding anything to your capital!
📉 Daily Time Frame
On the daily time frame, our trend is completely bearish as you can see, and the events are completely accompanied by the formation of a downward bottom and top, but we are likely to suffer for a while.
After getting rejected from 34.16 and forming a box between 20.16 and 25.93 and losing the bottom, it made a move and then while pulling back with low volume and the next conversion to red, it became an inverted Sharpe, we experienced a decline!
After breaking the daily trendline, which was also an important trendline, its trigger at 8.48 was broken, and we are currently engaged with the resistance at 10.47, and the next and most important trigger, so to speak, is after breaking 10.47, and you can even have a spot buy with this level!
🕓 4-Hour Timeframe
In the 4-hour time frame, we are also ranging between the box of 9.24 to 10.41, and practically, whichever side we break, we can say we can take its position and go along with it!
📈 For a long position, the trigger is completely clear, and after breaking 10.41, make sure to take a long position, and you can even open a position before this trigger breaks with the presence of momentum in lower time frames!
📉 For a short position, we have just formed the support at 9.24, and if we bounce from this support and hit a lower high, or better yet, get rejected before 10.41, we go for a short position and a break of 9.24!
✍️ Final Thoughts
Stay level headed, trade with precision, and let’s capitalize on the market’s top opportunities!
This is our analysis, not financial advice always do your own research.
What do you think? Share your ideas below and pass this along to friends! ❤️

ALT COIN SEASON IS JUST WEEKS AWAY, HOPE YOU HAVE YOUR BAGS FULLHey Traders,
We’ve been watching this Bitcoin Dominance (BTC.D) chart closely — and it’s heating up again!
For those unfamiliar, BTC Dominance tracks the percentage of total crypto market cap that belongs to Bitcoin. When BTC.D rises, it typically means altcoins are underperforming compared to BTC — either due to their market caps falling, or BTC’s increasing. When it drops, altcoins are gaining ground.
While this chart won’t tell you whether markets go up or down, it’s critical for spotting where to diversify and when. It’s a must-have tool in your crypto trading utility belt.
⸻
Why This Chart Matters Now:
We’re nearing the top resistance trendline of a long-term triangle formation that dates all the way back to 2017. This line has rejected BTC.D multiple times in the past — and we’re back to test it again, hovering between 63% and 66% dominance.
Each of these rejections previously led to a drop in BTC Dominance — which triggered powerful altcoin seasons.
⸻
Key Bearish Signals:
• Bearish Divergence on the MACD
• MAJOR Bearish Divergence on the RSI
(Just like before previous alt seasons!)
• TOTAL2 (the white line representing all altcoins) looks poised to spike if history repeats.
Altseason Clue: When BTC.D forms bearish divergences on these indicators, it’s often followed by a surge in altcoin market cap — a key early signal we may be close to another one.
⸻
BUT… This Isn’t 2021 Anymore:
Let’s be real — the market has changed. Solana-based launchpads like Pump.fun and Jupiter DEX have revolutionized how easily tokens are created and traded. That’s new capital flow and speculative behavior we didn’t see last cycle.
Plus, the geopolitical landscape is shifting fast. With President Donald J. Trump calling for crypto regulation frameworks within 180 days, we may soon see an influx of institutional money — but it could come with strings attached.
⸻
Final Thoughts:
A breakdown in BTC.D could mean a major rotation into alts — but don’t bet the farm.
Markets could still dump. We may even skip altseason altogether this cycle.
However, this chart gives you a crucial edge — so use it wisely. Know your tools. Zoom out. Plan ahead.
As always — stay sharp, stay safe, and stay profitable out there.
— Savvy
