Bitcoin (BTC/USD) 4H Chart Analysis – Professional BreakdownBitcoin (BTC/USD) 4H Chart – Detailed Professional Analysis
This chart presents a Rectangle Pattern, a common consolidation structure in technical analysis. The price has been oscillating between a well-defined resistance level near $88,000 - $89,000 and a support level around $80,000 - $81,000. This pattern suggests an upcoming breakout, with bearish continuation being the most probable scenario.
Understanding the Rectangle Pattern
A rectangle pattern forms when price moves sideways, trapped between two horizontal levels. Traders watch for a breakout in either direction to determine the next trend. In this case, Bitcoin has tested the resistance multiple times but failed to break above, indicating strong selling pressure. Meanwhile, support has been retested several times, which weakens its strength over time.
A bearish breakdown is likely because:
Buyers appear unable to push past resistance, showing exhaustion.
Support has been tested multiple times, which increases the chance of a breakdown.
The dotted black trendline is now being tested, and a break below it would further confirm bearish momentum.
Trade Setup for a Breakdown
A short trade becomes valid only if Bitcoin breaks below the $81,000 - $82,000 support zone with strong momentum. The price must close below this level to confirm the move.
How to Enter the Trade?
Look for a strong bearish candle close below the $81,000 - $82,000 range.
If Bitcoin retests this broken support (now acting as resistance), this can be a secondary short entry point.
Once confirmation is seen, open a short position.
Stop Loss Placement
To protect against false breakouts, a stop loss should be set above the $88,457 resistance zone. If the price moves back into the rectangle and surpasses this level, it means the bearish setup is no longer valid.
Profit Target and Trade Expectation
The expected take profit target is $73,541. This is calculated using the measured move projection, meaning the height of the rectangle is subtracted from the breakdown point. If Bitcoin reaches this level, the trade will have successfully captured the bearish momentum.
Market Psychology Behind This Move
The repeated failure to break above resistance ($88,000 - $89,000) signals weak buying interest. Buyers have been stepping in at support, but each retest of the $80,000 - $81,000 zone makes it more vulnerable.
Once support finally breaks, several factors will accelerate the move:
Long positions will be forced to sell, increasing selling pressure.
Breakout traders will enter new short positions, pushing price further down.
Liquidity below support will be triggered, causing Bitcoin to fall sharply toward the $73,541 target.
Invalidation Scenario (Bullish Case)
If Bitcoin breaks above $88,000 - $89,000 and holds, the bearish setup becomes invalid. In that case:
The price would shift into a bullish continuation pattern.
Traders should avoid shorting and instead look for buying opportunities above resistance.
Final Thoughts
This is a high-probability bearish setup, but patience is key—wait for confirmation before entering.
Risk management is crucial : The stop loss at $88,457 ensures that losses are minimized if the market moves against the trade.
If Bitcoin remains inside the rectangle, traders can buy at support and sell at resistance until a breakout occurs.
Technical Analysis

DOW JONES INDEX (US30): Detailed Support & Resistance Analysis
Here is my latest structure analysis for US30 Index.
Resistance 1: 40650 - 40850 area
Resistance 2: 41150 - 41300 area
Resistance 3: 42550 - 42850 area
Support 1: 40000 - 40250 area
Support 2: 39470 - 39650 area
Support 3: 38400 - 38650 area
Consider these structures for pullback/breakout trading.
❤️Please, support my work with like, thank you!❤️
I am part of Trade Nation's Influencer program and receive a monthly fee for using their TradingView charts in my analysis.

XAU/USD Analysis – Wedge Breakdown & Bearish Trade Setup1. Chart Overview
The 15-minute XAU/USD chart shows a descending wedge pattern forming after a price rally. The wedge is characterized by a series of lower highs and lower lows, signaling a gradual weakening of bullish momentum. After consolidating within this wedge, the price has broken down, suggesting a bearish continuation.
This setup provides a high-probability short trade with clear entry, stop-loss, and multiple take-profit levels.
2. Key Technical Elements
A) Chart Pattern – Descending Wedge Breakdown
A descending wedge is typically a bullish reversal pattern when forming at the bottom of a downtrend. However, in this case, it appears at the end of a corrective move, making it a bearish continuation setup.
The upper trendline (black dashed line) acts as resistance, preventing price from breaking higher.
The lower trendline (solid blue line) represents temporary support.
The wedge narrows as price action contracts, leading to an eventual breakdown.
👉 Breakout Confirmation:
The price has broken below the wedge’s support trendline.
A minor pullback to retest the broken trendline suggests validation of the breakdown.
B) Resistance & Support Levels
1️⃣ Resistance Level (Sell Zone) – $3,100 to $3,135
This area previously acted as a supply zone, rejecting bullish attempts.
Price was unable to sustain above this level, leading to further downside pressure.
Stop-loss should be placed above this level ($3,135.57) to protect against invalidation.
2️⃣ Support Level (Buy Zone) – $3,050 to $3,056
This was a previous reaction zone where price briefly bounced before continuing lower.
Now acting as Take Profit 1 (TP1) at $3,056.58.
3️⃣ Breakout & Retest
After breaking the wedge, price retested the trendline but failed to reclaim it, confirming the bearish trend.
3. Trade Setup & Execution
🔵 Entry Point:
Short trade activation upon the breakdown and retest of the wedge structure.
Price rejection at the trendline confirms seller strength.
🔴 Stop-Loss:
Placed at $3,135.57, slightly above recent swing highs.
This protects against false breakouts or sudden reversals.
🎯 Take Profit Levels:
TP1 ($3,056.58): First target where buyers might step in.
TP2 ($3,022.39): Midway target, acting as another strong support.
TP3 ($2,985.44): Final target where price may stabilize or reverse.
4. Market Context & Confirmation Indicators
📉 Bearish Confirmation:
Strong downward momentum suggests continued selling pressure.
Price action is failing to make new highs, confirming lower highs and lower lows.
📊 Risk-to-Reward Ratio (RRR):
The trade offers a favorable RRR, as the downside potential is significantly larger than the stop-loss range.
⚡ Additional Confirmation:
A strong bearish candle confirmed the breakout, rejecting higher levels.
Potential support breakouts suggest that price could reach TP3 if bearish momentum continues.
5. Conclusion – Trading Strategy Summary
✅ Pattern Identified: Descending Wedge Breakdown (Bearish)
✅ Trade Direction: Short (Sell)
✅ Entry Trigger: Breakout & Retest of the Trendline
✅ Stop-Loss: Above $3,135.57 (Wedge Resistance Zone)
✅ Take Profit Targets:
TP1: $3,056.58
TP2: $3,022.39
TP3: $2,985.44
📌 Final Thoughts:
This setup provides a high-probability trade with a clear breakdown structure and downside potential. If the price continues to respect the bearish trend, reaching all TP levels is likely. However, traders should monitor for reversal signals and manage risk accordingly.
🔔 Risk Warning: Always use proper risk management and adjust positions according to market conditions! 🚀

ATOM ANALYSIS📊 #ATOM Analysis
✅There is a formation of Falling Wedge Pattern on daily chart with a good breakout and currently retests from the major resistance zone and again trading around its major resistance zone 🧐
Pattern signals potential bullish movement incoming after a successful breakout of resistance zone
👀Current Price: $4.800
🚀 Target Price: $6.300
⚡️What to do ?
👀Keep an eye on #ATOM price action and volume. We can trade according to the chart and make some profits⚡️⚡️
#ATOM #Cryptocurrency #TechnicalAnalysis #DYOR

DOLLAR INDEX (DXY): Long-Awaited Recover
It looks like Dollar Index is going to pullback
after a test of a significant support cluster on a daily.
A strong bullish imbalance candle that was formed on an hourly
time frame shows a strong buying interest from that zone.
I expect a bullish movement at least to 102.35
❤️Please, support my work with like, thank you!❤️

Nightly $SPY / $SPX Scenarios for April 4, 2025🔮 🔮
🌍 Market-Moving News 🌍:
🇺🇸📊 March Employment Report Release: The Bureau of Labor Statistics will release the March employment report, with forecasts predicting an addition of 140,000 nonfarm payrolls and an unemployment rate holding steady at 4.1%. This data will provide insights into the labor market's health and potential implications for Federal Reserve policy.
🇺🇸💬 Federal Reserve Chairman Powell's Address: Federal Reserve Chairman Jerome Powell is scheduled to speak at 11:25 AM ET. Investors will be closely monitoring his remarks for any indications regarding future monetary policy, especially in light of recent market volatility.
🇺🇸📈 Market Reaction to 'Liberation Day' Tariffs: Following President Donald Trump's announcement of new tariffs, dubbed "Liberation Day" tariffs, the markets experienced significant declines. The S&P 500 dropped 4.8%, and the Nasdaq Composite fell 6%, marking the worst trading day since 2020. Investors are bracing for continued volatility as the market digests the potential economic impacts of these tariffs.
📊 Key Data Releases 📊
📅 Friday, April 4:
👷♂️ Nonfarm Payrolls (8:30 AM ET):
Forecast: +140,000
Previous: +151,000
Indicates the number of jobs added or lost in the economy, excluding the farming sector.
📈 Unemployment Rate (8:30 AM ET):
Forecast: 4.1%
Previous: 4.1%
Represents the percentage of the total workforce that is unemployed and actively seeking employment.
💵 Average Hourly Earnings (8:30 AM ET):
Forecast: +0.3%
Previous: +0.3%
Measures the month-over-month change in wages, providing insight into consumer income trends.
⚠️ Disclaimer: This information is for educational and informational purposes only and should not be construed as financial advice. Always consult a licensed financial advisor before making investment decisions.
📌 #trading #stockmarket #economy #news #trendtao #charting #technicalanalysis

#NIFTY Intraday Support and Resistance Levels - 04/04/2025Gap down opening expected in nifty near 23200 level. After opening if nifty starts trading below this level then possible strong downside upto 23000 level in opening session. Currently consolidated movements in nifty. If nifty sustain above 23250 level then possible upside movement upto 23450 level. For today's session 23450 level will act as a strong resistance for index.

Fri 4th Apr 2025 USD/SGD Daily Forex Chart Sell SetupGood morning fellow traders. On my Daily Forex charts using the High Probability & Divergence trading methods from my books, I have identified a new trade setup this morning. As usual, you can read my notes on the chart for my thoughts on this setup. The trade being a USD/SGD Sell. Enjoy the day all. Cheers. Jim

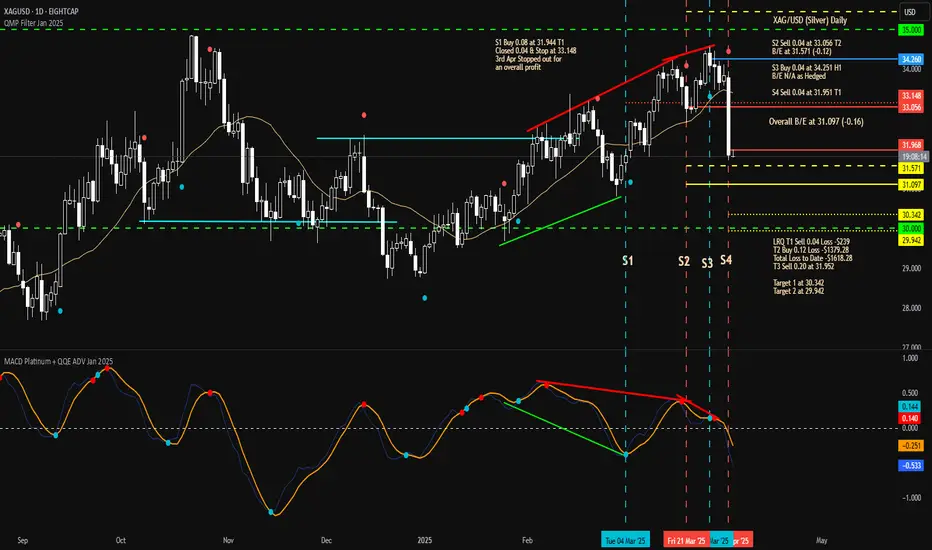
Fri 4th Apr 2025 XAG/USD Daily Forex Chart Sell SetupGood morning fellow traders. On my Daily Forex charts using the High Probability & Divergence trading methods from my books, I have identified a new trade setup this morning. As usual, you can read my notes on the chart for my thoughts on this setup. The trade being a XAG/USD Sell. Enjoy the day all. Cheers. Jim
ATOMUSDT Forming Inverse Head & Shoulders ATOMUSDT is currently forming a classic inverse head and shoulders pattern on the chart—a strong technical indicator often associated with trend reversals. This bullish pattern, combined with rising volume, suggests that a breakout may be on the horizon. The neckline is being tested, and a confirmed breakout could trigger a wave of buying interest as traders anticipate a significant upside move.
Volume is looking promising as buyers step in around key support zones, showing confidence in the potential of ATOM. With the broader market stabilizing and altcoins gaining momentum, ATOMUSDT could ride this wave for a projected gain of 50% to 60%+. The current technical setup aligns well with historical bullish reversals seen with this pattern.
Investors are increasingly paying attention to ATOM, not just for its price action but also for its utility in the Cosmos ecosystem. With strong fundamentals backing the project and a promising technical structure, this may be the beginning of a new uptrend. A successful breakout above resistance could bring renewed momentum and fresh highs in the short to medium term.
✅ Show your support by hitting the like button and
✅ Leaving a comment below! (What is You opinion about this Coin)
Your feedback and engagement keep me inspired to share more insightful market analysis with you!

Fri 4th Apr 2025 AUD/USD Daily Forex Chart Buy SetupGood morning fellow traders. On my Daily Forex charts using the High Probability & Divergence trading methods from my books, I have identified a new trade setup this morning. As usual, you can read my notes on the chart for my thoughts on this setup. The trade being a AUD/USD Buy. Enjoy the day all. Cheers. Jim

What Is Momentum – And Why It’s Not Just a Trend IndicatorMost traders follow price — candles, trendlines, support/resistance. But there’s another layer that often tells the story before the price moves: momentum.
⸻
🔍 In this post, you’ll learn:
• What momentum really measures
• Why it’s not the same as price direction
• How momentum can signal a shift before the chart confirms it
• Why combining momentum with structure improves timing
⸻
📈 Momentum ≠ Direction
Price can be rising while momentum is fading. That’s often a clue of an upcoming slowdown or reversal — long before the price turns. Similarly, price can be flat, while momentum builds in one direction. That’s tension… and tension leads to moves.
⸻
🔥 Why Momentum Matters:
• It reveals intensity, not just direction
• It can act as a leading indicator — not lagging
• Momentum divergences often hint at hidden accumulation or distribution
• Tracking it helps you avoid late entries or false breakouts
⸻
🔧 Takeaway for traders:
If you’re only watching price, you’re only seeing half the picture.
Momentum shows what’s driving the move, and when that drive starts weakening.
⸻
💬 What’s your favorite momentum indicator? RSI, %R, CCI, or something else?

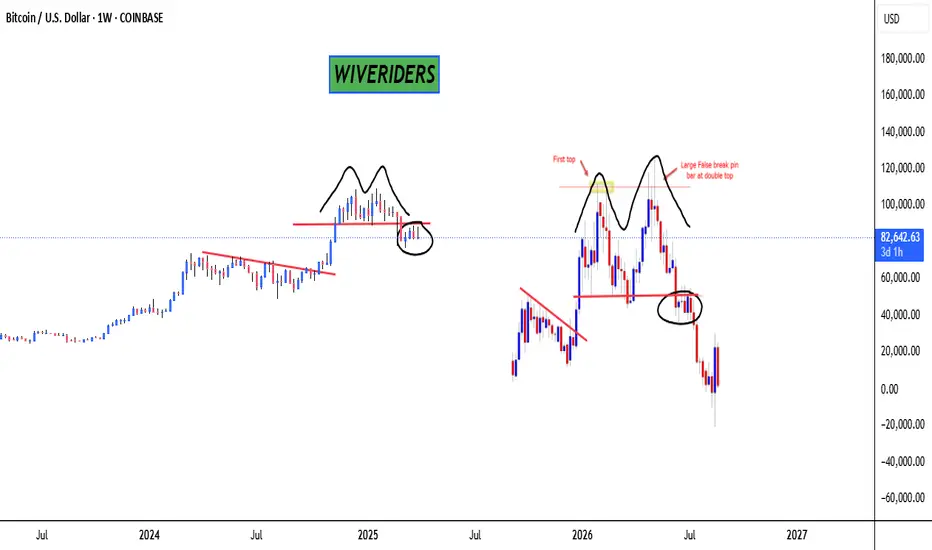
BTC Weekly Chart Update📉 CRYPTOCAP:BTC Weekly Chart Update
It looks like a double top pattern is clearly forming on the BTC weekly chart — and honestly, doesn't it remind you of a similar structure we’ve seen before? 👀
Patterns like these often signal potential trend reversals, so this is definitely a chart to watch closely.
Do you see the similarity with the previous one? Let me know your thoughts in the comments 👇
🔴 Bearish scenario could continue unless we break above key resistance.
GOLD Bullish Trend Continues After FVG Test🟢 GOLD is maintaining strong bullish momentum after successfully testing a Fair Value Gap (FVG). A Break of Structure (BOS) confirms the uptrend, with higher lows forming—a clear sign of continuation.
📊 Analysis:
✅ Bullish Trend: The price structure confirms an uptrend with higher highs and higher lows.
✅ Fake Reversal Break of Structure (BOS): A key level has been broken, signaling reversal but based on current momentum that follows it shows Buyers continued strength.
✅ FVG Test Success: Price respected the Fair Value Gap, reinforcing buying pressure.
✅ 🎯 Target: , aligning with .
✅ 📈 Momentum: Strong upward drive suggests further gains ahead.
🔮 Potential Scenario:
The price is likely to continue climbing, forming a new higher high toward the target level.
📢 Confirmation Signals to Watch:
📌 Volume: Increasing volume on bullish moves.
📌 Candlestick Patterns: Bullish signals at key support levels.
📌 Moving Averages: Price holding above critical moving averages.
📌 🚨 Disclaimer: This is not financial advice. Trade responsibly and conduct your own research.
🔗 Tags:
#GOLD #XAUUSD #Bullish #TechnicalAnalysis #TradingView #FVG #BreakOfStructure #TrendAnalysis #PriceAction #MarketAnalysis

TradeCityPro | APTUSDT The Beginning of a New Downtrend!👋 Welcome to TradeCityPro Channel!
Let's go back to the day when Trump imposed tariffs on the United States again, causing stocks and cryptocurrencies to fall and gold to rise. Let's take a look at our attractive altcoin chart
🌐 Overview Bitcoin
Before starting the analysis, I want to remind you again that we moved the Bitcoin analysis section from the analysis section to a separate analysis at your request, so that we can discuss the status of Bitcoin in more detail every day and analyze its charts and dominances together.
This is the general analysis of Bitcoin dominance, which we promised you in the analysis to analyze separately and analyze it for you in longer time frames.
📊 Weekly Timeframe
APT remains inside its large, volatile range, frequently bouncing between its highs and lows. However, this time, it has formed a lower high, which is not a positive sign.
Additionally, after breaking $7.78, sellers completely engulfed the weekly candle, and for the past five weeks, all candles have been red with high selling volume, confirming the downtrend.
There is no buy trigger at the moment, and I cannot recommend a buying opportunity until the market forms a new structure.
For selling, if APT drops below $4.97, it makes sense to exit and accept the loss instead of holding onto a losing position.
📉 Daily Time Frame
In the daily time frame, the power is in the hands of the sellers! After the parabolic line broke, we experienced a Sharpe decline, accompanied by the formation of a lower ceiling and floor, which has continued our downward trend.
The parabolic movement itself is a very rapid and bullish movement, and every time the price hits it, it quickly returns to its trend and is supported, but when this line is broken, that trend is practically over and we suffer, or we experience a Sharpe decline like this chart!
After the drop and the formation of a box between 5.136 and 6.491, the selling force was clearly evident in this space, because the last time we moved towards the ceiling of 6.491, we could not reach this ceiling and we were rejected earlier.
This rejection made us return to this support faster with a number of red candles, unlike the previous attempt where we moved up with a larger number of candles. Yesterday's daily candle also engulfed the previous 3 candles and is exactly ready to break 5.136.
If today's daily candle closes in the same way, the probability of a drop in the coming days will increase and increase. If you are a holder of this coin, it is logical to sell and after returning to the box and breaking its ceiling, buy with the same number of Tethers and reduce the probability of a drop and loss of capital for yourself!
✍️ Final Thoughts
Stay level headed, trade with precision, and let’s capitalize on the market’s top opportunities!
This is our analysis, not financial advice always do your own research.
What do you think? Share your ideas below and pass this along to friends! ❤️

Elliott Wave | Bearish End Confirmed? | Last Chance Before the DBINANCE:SOLUSDT
The current structure suggests we are approaching a key decision point. Price has completed an a-b-b correction and is now reacting within the 61.8%-88.7% Fibonacci retracement zone, which could trigger a relief bounce before further decline.
📉 **Bearish Outlook:**
- The recent structure confirms a completed a-b-c move, leading to a potential Wave (B) retracement.
- The final bearish target lies in the "End of Bear" zone (~109 USD), where a final capitulation may occur.
- If we break far below **109 USD**, expect an accelerated sell-off.
📈 **Bullish Scenario?**
- The 78.6%-88.7% Fibonacci retracement zone could push SOL towards a short-term bounce before resuming the bearish trend.
- A valid long trade is possible if this support holds.
⚠️ Key Levels to Watch:
✅ Bullish Rejection Zone: 78.6% - 88.7% Fibo
❌ Break Below 105 USD = Full Bearish Confirmation
---
### 📌 **Trading Plan:**
1️⃣ Potential Short-Term Long if 78.6% - 88.7% Fibo holds.
2️⃣ Target: Resistance before wave (C) completes.
3️⃣ Short Confirmation** after rejection OR break below 105 USD.
‼️ Risk Management:
- If price fails to hold, a deeper correction is expected.
- Trade with proper stop-loss & confirmations!
💬 What do you think? Will we see a short-term bounce before the bear takes over?

Gold (XAU/USD) Breaks Ascending Channel – Bearish Move Ahead?📉 Market Structure:
Gold was moving in an ascending channel, but price has now broken below the support trendline.
This suggests a possible trend reversal or correction.
📌 Key Levels:
Resistance : $3,125 - $3,170
Support: $3,054 - $3,035
Target: $3,000 - $2,995
📊 Trade Idea:
A pullback to support-turned-resistance could give a short entry.
Bearish target: $3,000 if rejection holds.
Invalidation: If price reclaims $3,125.
🔍 Watch for:
Price reaction at the former channel support.
Possible retest before further drop.
Let me know if you need any modifications! 🚀

Is gold going to be eclipsed?
-------------------------
Timeframe: 240 Min
-------------------------
The price action suggests a completed impulse structure originating from the 2833 low, with gold now trading at an all-time high. Based on cluster zones and Fibonacci extensions, wave (5) still has the potential to extend toward the 3150-3200 range. This zone represents a key resistance level where buying momentum may slow down, signaling an impending shift in market dynamics.
Once wave (5) completes, it will mark the end of wave ((3)) of a higher degree, setting the stage for a corrective move. A retracement toward the previous wave (4) level is expected as wave ((4)) develops, aligning with historical corrective behavior after extended rallies. This phase will provide crucial insights into the market’s next major move. Stay tuned for further updates.

EUR/GBP Triangle Pattern - Bearish Breakdown SetupProfessional Analysis of the EUR/GBP Chart
This EUR/GBP (Euro/British Pound) daily chart from OANDA, published on April 3, 2025, highlights a key technical setup based on price action analysis, chart patterns, and support/resistance levels.
1. Market Context: Accumulation & Transition to a Triangle Pattern
Curve Zone Formation (Rounded Bottom):
The market initially exhibited a rounded bottom structure (curve zone) from July 2024 to February 2025, indicating a gradual accumulation phase.
This phase often signals a shift in market sentiment, where sellers lose dominance, and buyers start stepping in.
Breakout from Accumulation:
After reaching the support zone (~0.8250 - 0.8300), price rebounded sharply in March 2025, confirming strong buyer interest.
However, it failed to sustain upward momentum near the resistance zone (~0.8470 - 0.8500), leading to consolidation.
2. Formation of a Symmetrical Triangle Pattern
Lower Highs & Higher Lows:
Price action began forming a symmetrical triangle, a classic consolidation pattern that typically precedes a strong breakout.
The market is currently trading near the apex of the triangle, indicating that a breakout is imminent.
Potential Breakout Direction:
Symmetrical triangles are neutral patterns, meaning they can break either upward or downward.
However, the price structure and resistance rejection suggest a higher probability of a bearish breakdown.
3. Key Levels & Trading Setup
Resistance & Support Zones:
🔴 Resistance Zone (~0.8470 - 0.8500):
This area has repeatedly acted as strong resistance, where sellers have consistently pushed prices lower.
A breakout above this zone would indicate a bullish invalidation of the current bearish bias.
🟢 Support Zone (~0.8250 - 0.8300):
This level has held price multiple times, acting as key support.
A break below this zone would confirm bearish momentum, targeting lower price levels.
4. Bearish Trade Setup
📉 Entry Strategy (Short Position):
Wait for a confirmed breakout below the triangle’s lower trendline (~0.8320 - 0.8350).
A retest of the broken support turning into resistance would provide the best short entry.
📌 Stop-Loss Placement (~0.84764):
Positioned above recent highs and the resistance zone to minimize risk.
This ensures the trade is protected against potential false breakouts.
🎯 Profit Target (~0.81190 - 0.81134):
The projected move aligns with historical support levels, making it a logical target.
This level represents a previous market structure where buyers stepped in.
5. Conclusion & Trade Considerations
✅ Bearish Bias: The price action and pattern suggest a higher probability of a downside breakout.
✅ Defined Risk & Reward: A well-structured stop-loss and target level ensures a solid risk management strategy.
✅ Watch for Confirmation: Traders should wait for a confirmed breakout before entering a trade to avoid false moves.
📊 Overall Verdict: A high-probability short setup is forming, with a clear entry, stop-loss, and take-profit strategy. If the market respects the triangle breakdown scenario, this could lead to a significant bearish move toward the 0.81190 target.

EUR/USD Analysis Ascending Triangle Breakout – Bullish TargetOverview of the Chart:
The chart represents the EUR/USD (Euro to U.S. Dollar) pair on a 1-hour timeframe, showcasing a bullish ascending triangle breakout. The pattern indicates an upward continuation in the trend after a period of consolidation. This analysis will break down the key elements of the chart, the technical structure, and the potential trading strategy.
1. Market Structure & Key Zones
A. Market Curve Area (Early Trend Development)
The price started with a strong bullish trend leading up to the formation of the triangle.
The curved trendline suggests a gradual increase in buying pressure, indicating that the market was preparing for a larger breakout.
B. Resistance and Support Levels
Resistance Level (Red Arrow & Blue Box):
This level acted as a price ceiling where sellers previously dominated.
The market attempted multiple times to break this resistance before successfully breaching it.
Support Level (Green Arrow & Yellow Zone):
The price consistently found buyers at this level, reinforcing a higher low structure.
The rising support line within the triangle indicated strong accumulation by buyers.
2. Chart Pattern: Ascending Triangle Formation
The price action formed an ascending triangle, which is a well-known bullish continuation pattern.
The higher lows (trendline support) indicated buyers were gaining control, gradually pushing the price toward the resistance.
Eventually, the resistance was broken with strong bullish momentum, confirming a valid breakout.
3. Breakout Confirmation & Retest
The breakout above the resistance level came with high volume, indicating strong market participation.
After the breakout, a minor pullback (retest) occurred, confirming previous resistance as new support.
The price surged upward after the retest, validating the bullish trade setup.
4. Trade Setup & Risk Management
A. Entry Strategy
A trader would enter a buy (long) position after confirming the breakout.
Entry Trigger:
Either at breakout (high-risk, early entry)
Or after a successful retest (safer entry)
B. Stop Loss Placement
A stop loss is placed below the previous support level at 1.07276, ensuring risk is limited in case of a false breakout.
C. Target Projection
The target price is measured using the height of the triangle added to the breakout level.
Based on this calculation, the projected target is around 1.12838.
5. Conclusion & Trading Plan
The EUR/USD pair has executed a clean ascending triangle breakout, signaling further bullish movement.
The trading plan suggests:
✅ Entry: Buy after breakout confirmation or retest.
✅ Stop Loss: Placed below 1.07276 for risk management.
✅ Take Profit: Targeting 1.12838, based on the pattern’s height projection.
This setup presents a high-probability long opportunity in a trending market, with proper risk management to protect against potential reversals.

Amazon (NASDAQ: $AMZN) Drops 8% as Trump Tariffs Shake Markets. Amazon (NASDAQ: NASDAQ:AMZN ) is facing huge downward pressure following President Donald Trump's announcement of sweeping tariffs. The stock dropped 9.26% in early trading, reaching $176.92 as of 11:01 AM EDT.
These tariffs impact over 100 countries, including China, a key supplier for third-party merchants on Amazon’s platform. Rising import costs could push prices higher, affecting consumer spending and Amazon’s profit margins.
Looking at the broader market, it is also struggling from the tariffs. The Magnificent Seven stocks, including Apple, Nvidia, Meta, Tesla, Alphabet, Microsoft, and Amazon, have all seen huge drops.
Amazon’s 8% drop is among the largest, further highlighting its vulnerability to trade disruptions. If these tariffs persist, they could reignite inflation, weigh on economic growth and further impact stock prices. Amazon has faced major market shifts in the past. In 2022, its stock lost over 50% of its value within a few quarters.
The question now is, can the current decline lead to similar losses?
With Amazon trading at $242 in February, some fear it could drop below $120 if the economic outlook worsens.
Adding to concerns, geopolitical risks remain high. The ongoing war in Ukraine, coupled with uncertainty over future U.S policies, creates a volatile environment for stocks. Amazon’s reliance on global supply chains and consumer spending makes it highly sensitive to market shocks.
Technical Analysis
Looking at Amazon technically, there has been a downtrend since early February when it reached an all-time high and a 52-week high of $242. This peak came shortly after the presidential inauguration, but since then, the market conditions have not been favorable. The introduction of new tariffs has fueled bearish momentum, pushing Amazon lower toward key support levels.
Currently, the stock is testing a double support level, an ascending trendline and a horizontal support around $180. If buyers step in at this level, a rebound could occur, targeting the previous $252 all-time high. However, given the economic uncertainty, there is a strong chance the stock may break below this current support.
If the weekly candle closes strongly below the $180 level, the next critical point where the stock might find support is around $144. This area has historically provided strong buying interest and it may serve as a potential bottom if the decline continues.
Looking at momentum indicators, the weekly RSI currently sits at 33, indicating strong bearish momentum. Despite the reading approaching the oversold reading, macroeconomic data shows the downtrend remains dominant and further losses could be ahead.
What's the Outlook? Can Amazon Recover Soon?
The coming weeks will be crucial for Amazon’s stock. With earnings expected between April 28th and May 2nd, market sentiment may shift based on revenue growth and profit margins. However, ongoing trade uncertainties and rising costs remain key risks.
For now, monitor price action around the current market price of $180. A strong bullish move could confirm a short-term recovery. On the other side, a break below this double support level may signal a further drop towards $144 support level.

PY/USD Analysis: Rising Wedge Bearish Reversal & Short SetupThis chart represents the JPY/USD (Japanese Yen vs. US Dollar) on a daily timeframe (1D), published on April 3, 2025, via TradingView. The price action and technical indicators suggest a bearish outlook based on the formation of a Rising Wedge Pattern, a classic reversal structure signaling potential price depreciation.
1. Chart Structure & Identified Patterns
A. Rising Wedge Formation (Bearish Reversal Pattern)
The price has been moving in an uptrend, forming higher highs (HH) and higher lows (HL).
The two converging black trendlines indicate a rising wedge, a pattern that typically precedes a downside breakout.
A rising wedge is considered a bearish signal, especially when formed after a strong rally.
B. Support and Resistance Levels
Resistance Zone (Highlighted in Beige, Upper Range)
This level represents a historically significant supply area where selling pressure is expected.
Price action shows multiple rejections at this level, indicating the presence of strong resistance.
The red downward arrow further confirms that this level is acting as a cap on price movement.
Support Zone (Highlighted in Beige, Lower Range)
This area previously served as a strong demand level, where buyers stepped in, reversing the price.
The green upward arrow suggests that it played a critical role in the prior bullish move.
C. Key Price Levels
All-Time High (ATH) Marked at ~0.007155
This represents the historical peak price, which serves as a potential long-term resistance.
Stop-Loss Placement (~0.006959)
This is placed above the resistance level to manage risk in case of a false breakout.
Target Level (~0.006178)
Based on the wedge height, this level is calculated as the measured move after a breakdown.
2. Price Action & Market Sentiment
A. Recent Bullish Move
The market has been in a strong uptrend since hitting the support zone.
This move was characterized by higher lows and higher highs, reinforcing bullish momentum.
However, momentum appears to be weakening as the price struggles to break through the resistance.
B. Confirmation of a Bearish Reversal
The price has touched the upper resistance zone multiple times but failed to break through.
The trendline breakdown (expected move) suggests sellers are stepping in.
A lower high formation is seen as an early warning of a reversal.
3. Trade Setup: Short Position Strategy
This setup aligns with the principles of technical analysis, utilizing the Rising Wedge as a bearish reversal pattern.
A. Entry Strategy
Sell Entry Trigger: Enter a short trade upon a confirmed breakdown below the lower trendline.
Retest Confirmation: Ideally, wait for a pullback to the broken trendline before shorting to avoid false signals.
B. Risk Management
Stop-Loss Placement: Above the resistance zone at 0.006959, to protect against an invalidation.
Take-Profit Target: Set at 0.006178, calculated based on the wedge’s height projection.
C. Reward-to-Risk Ratio (RRR)
RRR = 2:1 or higher
The target level offers a risk-reward ratio that justifies the trade setup.
4. Summary & Final Outlook
Bearish Signals:
✅ Rising Wedge Pattern – A strong reversal indicator.
✅ Lower Highs and Weak Momentum – Suggests selling pressure.
✅ Failure to Break Resistance – Indicates bullish exhaustion.
✅ Projected Target Based on Wedge – Price expected to reach 0.006178.
Neutral Considerations:
If price does not break the lower trendline, the pattern is not validated.
If a false breakdown occurs, prices may briefly recover before falling.
Bullish Invalidation:
If the price breaks above 0.006959 and sustains above resistance, the bearish setup is invalidated.
Final Verdict:
📉 Bearish Bias – The market setup favors a downside move upon a confirmed breakdown.
🎯 Target: 0.006178 (Key support level).
⚠️ Risk: If the price does not break lower, consolidation may occur before a clearer move.

Cable Is Trading Impulsively HigherCable is making a very nice and strong extension higher on the 4-hour time frame, so it appears to be impulsive. We should be aware of further upside, especially as the market has broken out of a base channel, which typically happens within wave three of three.
In fact price is now even higher after a triangle in wave four so wave 5 of red (3) is in progress as expected, but it can target 1.32, so be aware of a new red higher degree wave (4) correction before the bullish trend for wave (5) resumes. Ideal support is at 1.29 – 1.28 area.
