(ETH/USD) Breakout from Falling Wedge – Bullish Momentum Ahead?Ethereum (ETH/USD) Breakout from Falling Wedge – Bullish Momentum Ahead?
This 4-hour Ethereum chart shows a breakout from a falling wedge pattern, a bullish reversal formation. The price has started forming higher lows, signaling potential upside movement. The projected target is around $2,411, indicating a significant recovery.
A successful retest of the breakout level could confirm further upward momentum. Traders may consider long positions while monitoring resistance levels.
📌 Key Levels:
Support: ~$1,879
Target: ~$2,411
Resistance Zones: $2,100 - $2,200
Would you like me to refine this further? 🚀
Technical Analysis

BTC/USD Bullish Breakout from Rectangle PatternOverview:
The chart represents Bitcoin's price action against the US Dollar on the 1-hour timeframe, highlighting a Rectangle Pattern Breakout with a well-structured trade setup. This analysis will break down the pattern, key levels, and possible trading scenarios.
1️⃣ Chart Pattern Breakdown – Rectangle Consolidation
The price has been moving within a rectangle pattern (range-bound movement), where Bitcoin found support at lower levels and faced resistance at the upper boundary.
Rectangle Pattern: A continuation/consolidation pattern where price fluctuates between horizontal resistance and support before breaking out.
Curve Formation: The price action within the rectangle also forms a rounding bottom, indicating a potential shift from bearish to bullish sentiment.
Breakout Confirmation: BTC has broken out from the rectangle, suggesting bullish momentum.
2️⃣ Key Technical Levels
🔹 Support Level ($84,110)
This zone has acted as a strong demand area, preventing the price from falling further.
Buyers consistently stepped in at this level, making it a significant psychological floor for Bitcoin.
🔹 Resistance Level ($86,850 - $87,000 Zone)
This level had previously rejected upward movements, leading to multiple price pullbacks.
After the breakout, this area is expected to act as a new support level upon a retest.
🔹 Target Price ($89,931 – Next Resistance Zone)
If the breakout sustains, the next key target for bulls is around $89,931, based on prior resistance zones and technical projections.
🔹 Stop Loss ($84,110 – Below Support Zone)
A stop loss below the support zone ensures risk management in case of a false breakout.
3️⃣ Trading Strategy & Execution
📌 Entry Point – After price confirms the breakout above the rectangle’s resistance. Traders should wait for:
A pullback and retest of the broken resistance, which should now act as support.
A strong bullish candle confirming continuation.
📌 Take Profit (TP) – $89,931, based on historical resistance levels and price projection from the rectangle range.
📌 Stop Loss (SL) – Placed at $84,110, below the rectangle’s previous support zone to minimize downside risk.
📌 Risk-to-Reward Ratio (RRR) – The setup offers a favorable RRR, meaning potential profits outweigh the risks.
4️⃣ Market Sentiment & Additional Factors
✔ Bullish Outlook – The breakout signals strong buying interest and potential upside continuation.
✔ Volume Confirmation – Traders should monitor volume spikes during the breakout to confirm institutional participation.
✔ Economic Events & News – External factors like macroeconomic data or Bitcoin-related news can impact price action.
Conclusion – BTC/USD Trading Setup
Pattern Identified: Rectangle Pattern Breakout
Current Trend: Bullish breakout from consolidation
Trade Type: Long position (Buy setup)
Key Levels:
✅ Support: $84,110
✅ Resistance: $86,850 - $87,000
✅ Target: $89,931
✅ Stop Loss: $84,110
🔥 Final Thought : Bitcoin has broken out of a key consolidation range, signaling a bullish move towards $89,931. Traders should wait for confirmation and manage risk accordingly! 🚀📈

Silver (XAG/USD) - Bearish Breakdown from Rising Wedge!Market Overview:
The Silver (XAG/USD) 1-hour chart reveals a Rising Wedge pattern, which is a well-known bearish reversal formation. This suggests that the recent bullish trend is losing momentum, and a breakdown could lead to a significant price decline.
🔹 Key Technical Analysis
1️⃣ Rising Wedge Formation & Breakdown
The price has been moving within a rising wedge, characterized by higher highs and higher lows but with weakening momentum.
A breakdown has occurred, confirming the bearish structure as the price has failed to sustain higher levels.
Historically, when a rising wedge breaks to the downside, price tends to drop by the same height as the wedge itself, which aligns with our projected target zone.
2️⃣ Price Action & Retest Possibility
After the breakdown, a retest of the broken wedge support (now resistance) around $33.50 - $33.80 could provide a potential short-selling opportunity.
If price fails to reclaim the wedge support, further downside pressure is expected.
3️⃣ Downside Target & Support Zone
The measured move suggests a decline towards the $31.00 - $30.60 region, which coincides with a strong historical support zone.
This area is highlighted as a potential profit-taking level for short trades.
📉 Trading Plan - Short Setup
🔸 Entry: Look for a rejection from the $33.50 - $33.80 zone (previous wedge support, now resistance).
🔸 Stop Loss: Above $34.00 to protect against false breakouts.
🔸 Take Profit: $31.00 - $30.60 (previous demand area).
🔸 Risk-Reward Ratio: Favorable setup, ensuring proper risk management.
🛑 Risk Factors to Consider
⚠️ If Silver regains strength and breaks back above $34.00, it could invalidate the bearish breakdown and shift momentum back to the upside.
⚠️ Macroeconomic events such as inflation data, Fed speeches, or geopolitical factors could influence price action unpredictably.

XAUUSD Head & Shoulders Breakdown – Bearish Target Ahead?This chart represents a detailed technical analysis of Gold Spot (XAU/USD) on the 1-hour timeframe with a structured trade setup based on a Head and Shoulders (H&S) reversal pattern. Below is an in-depth explanation of the chart components, price action, and trade strategy.
1️⃣ Key Chart Patterns and Analysis
A. Head and Shoulders Pattern (Bearish Reversal)
This is a well-known bearish reversal pattern that signals a potential trend change from bullish to bearish. It consists of three peaks:
Left Shoulder: A rise followed by a temporary pullback.
Head: The highest peak in the pattern, showing strong buying pressure before reversal.
Right Shoulder: A smaller rise compared to the head, indicating weakening bullish momentum.
B. Neckline (Support Level) and Breakdown Confirmation
The neckline (horizontal support level) is drawn across the lowest points between the shoulders.
A break below the neckline confirms the reversal, triggering a bearish move.
The chart suggests price is at the neckline zone, preparing for a breakdown.
2️⃣ Trendline and Support/Resistance Analysis
A. Uptrend Trendline Break
The price was following a strong ascending trendline (dotted black line).
A trendline breakout has occurred, indicating potential trend reversal.
This supports the bearish bias further.
B. Resistance and Support Levels
Resistance Level: Marked at the top of the Head region, which aligns with previous price rejection zones.
Support Levels:
First support (TP1 - 3,053.269): This is the first potential take profit level.
Second support (TP2 - 3,030.556): The next target if price continues downward.
3️⃣ Trade Setup & Risk Management
A. Entry Point (Short Position)
Sell (Short) after the neckline breakout, ensuring bearish momentum is confirmed.
B. Take Profit (TP) Targets
TP1: 3,053.269 (Initial support target).
TP2: 3,030.556 (Stronger support zone, deeper profit target).
C. Stop Loss Placement
Stop Loss: 3,150.726 (Above the resistance zone).
This is a logical stop-loss placement, allowing price fluctuations without prematurely stopping the trade.
4️⃣ Overall Market Sentiment & Trade Bias
Bearish Bias: Due to the formation of the Head and Shoulders pattern, trendline breakout, and weakening bullish momentum.
Confirmation Needed: A strong bearish close below the neckline increases probability of downward continuation.
5️⃣ Final Thought – A High-Probability Trade Setup
If neckline breaks, the trade is valid with potential for a 3%+ downside move.
If price holds above the neckline, the pattern may fail, leading to reconsidering trade execution.
This structured risk-managed approach ensures a strategic entry, controlled risk, and maximized profit potential. 📉🔥 Let me know if you need further refinements! 🚀

XAUUSD 1H Head & Shoulders Pattern and Quasimodo!This 1-hour Gold (XAU/USD) chart presents a Head and Shoulders pattern forming near the 3,124 level, indicating a potential bearish reversal. The structure consists of:
Left Shoulder – A peak followed by a retracement.
Head – The highest point in the formation.
Right Shoulder – A lower high, confirming the pattern.
Additionally, a Quasimodo pattern is forming, reinforcing bearish sentiment if price fails to sustain above 3,139. A breakdown below the neckline suggests a potential move toward the projected target zone at 3,039.
Key Levels & Trade Plan
📍 Resistance: 3,139 (Quasimodo level)
📉 Support Levels: 3,107 – 3,085 – 3,039 (Main target)
📊 Bearish Confirmation: Break below the neckline (~3,120)
🎯 Target Zone: 3,039
A clean breakdown below the neckline could accelerate bearish momentum, aligning with the projected drop of approximately 62.7 points (-2.02%). Bulls need to reclaim 3,139 for any invalidation of this bearish outlook. Keep an eye on price action confirmation before entering trades.

Bitcoin (BTC/USD) Reversal? Rising Wedge Breakdown Signals Sell! The chart suggests a potential bearish move after a rising wedge pattern breakdown.
Key Observations:
Rising Wedge Breakdown:
BTC formed a rising wedge, which is a bearish reversal pattern.
The price has broken down from this wedge, indicating a potential downtrend.
Support and Resistance Levels:
Resistance Zone: Around $88,188 – $88,792, marked as a key level where selling pressure may increase.
Support Zone: Around $85,368 – $84,226, where buyers may step in.
Target: $81,429 – $81,258, a strong support level where price could drop.
Bearish Setup:
The chart suggests a sell opportunity near resistance, expecting a downward move toward the target zone.
Trading Idea:
Entry: Sell near $88,000 after confirmation.
Target: $81,429 – $81,258 (support zone).
Stop-Loss: Above $89,991 (resistance zone).
This setup suggests Bitcoin could decline further, making it a potential short trade opportunity. However, traders should watch for confirmation and overall market sentiment before executing trades.

Gold (XAU/USD) Bullish Breakout: Next Target $3,181?"Key Observations:
Current Price: Gold is trading at $3,127.450 at the time of the chart.
Trend: The chart exhibits a strong uptrend, with higher highs and higher lows.
Support Levels: Several support levels are marked in the $3,010 - $2,999 range, extending down to around $2,906.
Resistance and Target:
The immediate price range is highlighted, suggesting possible consolidation.
A breakout above this range could lead to a target around $3,181.
Chart Annotations:
A retracement (red structure) indicates a short-term correction before continuation.
A breakout structure (black lines) suggests a previous significant upward movement.
The range and possible continuation are marked, indicating that the price may consolidate before attempting to reach the target.
Trading Perspective:
If price holds above the range, we may see bullish continuation towards $3,181.
A break below support levels could signal a deeper pullback towards $3,010 or lower.
This chart suggests a bullish outlook, with potential for more upside if momentum continues. Traders might look for confirmations before entering long positions.

ADP in Focus: Will Strong Jobs Data Trigger Gold Pullback?🟡 GOLD MARKET BRIEF – Early Asian Surge Meets Resistance Ahead of Key US Jobs Data
Gold kicked off the day with a sharp rally during the Asian session, driven by consistent demand from Asian and Middle Eastern investors — a pattern we’ve seen forming repeatedly during early sessions lately.
However, price reacted swiftly at the 3130–3135 resistance zone, exactly as mapped out in yesterday’s trading plan. With sellers stepping in again, my outlook remains:
🔻 Look for reaction-based SELL opportunities in the Asian and London sessions, especially if price pulls back into key resistance.
📉 Technical Outlook:
Gold is approaching the apex of a symmetrical triangle pattern, suggesting a breakout is imminent.
✅ As always: Wait for the breakout — then trade the retest in the confirmed direction.
📰 Fundamental Focus:
All eyes today will be on the US ADP Non-Farm Employment report, which tends to offer early clues ahead of Friday’s NFP.
Should the data come in stronger than expected, USD could gain traction — likely applying downward pressure on Gold, in line with our target zone around 308x–307x.
🧭 Key Technical Levels:
🔺 Resistance: 3128 – 3135 – 3142 – 3148
🔻 Support: 3110 – 3100 – 3080 – 3070
🎯 Trade Plan:
🟢 BUY ZONE: 3102 – 3100
SL: 3096
TP: 3106 – 3110 – 3114 – 3118 – 3122 – 3126 – 3130
🔴 SELL ZONE: 3148 – 3150
SL: 3154
TP: 3144 – 3140 – 3136 – 3132 – 3128 – 3124 – 3120
📌 Caution: With ADP on deck during the US session, expect a spike in volatility.
Stick to clear levels, protect capital, and trade with discipline — not emotion.
Let the market come to you.
— AD | Money Market Flow

EURUSD - 2 APRIL, 2025EURUSD is already in my buy zone and i am waiting for price to sweep the previous day low and tap me in at exactly 1.07746. Having this in mind will keep me glued to see how price reacts to that zone and also my potential take profits.

FXAN & Heikin Ashi Trade IdeaOANDA:AUDNZD
In this video, I’ll be sharing my analysis of AUDNZD, using FXAN's proprietary algo indicators with my unique Heikin Ashi strategy. I’ll walk you through the reasoning behind my trade setup and highlight key areas where I’m anticipating potential opportunities.
I’m always happy to receive any feedback.
Like, share and comment! ❤️
Thank you for watching my videos! 🙏

RENDER ANALYSIS📊 #RENDER Analysis
✅There is a formation of Falling Wedge Pattern on daily chart with a good breakout and currently retests from the major resistance zone🧐
Pattern signals potential bullish movement incoming after a breakout of major resistance zone
👀Current Price: $3.455
🚀 Target Price: $4.4-6.0
⚡️What to do ?
👀Keep an eye on #RENDER price action and volume. We can trade according to the chart and make some profits⚡️⚡️
#RENDER #Cryptocurrency #TechnicalAnalysis #DYOR

USDJPY Technical AnalysisFenzoFx—USDJPY tested 150.25, a trading range below this level and the 50-period simple moving average. A close above 150.25 can trigger the uptrend, targeting 151.2.
Conversely, a dip below 148.2 invalidates the bullish outlook, with 148.2 as the first target and 147.43 as the secondary target.

Nifty - Awaiting the Fifth Wave for a BreakoutNifty recently hit a low of 21,905 , marking a key reversal point in the trend. A well-defined Head and Shoulders pattern is emerging, with the right shoulder currently forming. The ongoing pullback has retraced to the 38.2% level, but there is potential for it to extend towards the 50% mark at 22,906 . However, the upward move appears to be losing momentum, with buying interest remaining subdued.
Based on the chart, the head of the pattern signifies the beginning of a new impulse wave. This appears to be the fourth wave within the larger first wave. Once Nifty completes this corrective phase, the fifth wave is expected to present a trading opportunity. If wave equality holds, Nifty could potentially rise to 24,857 .

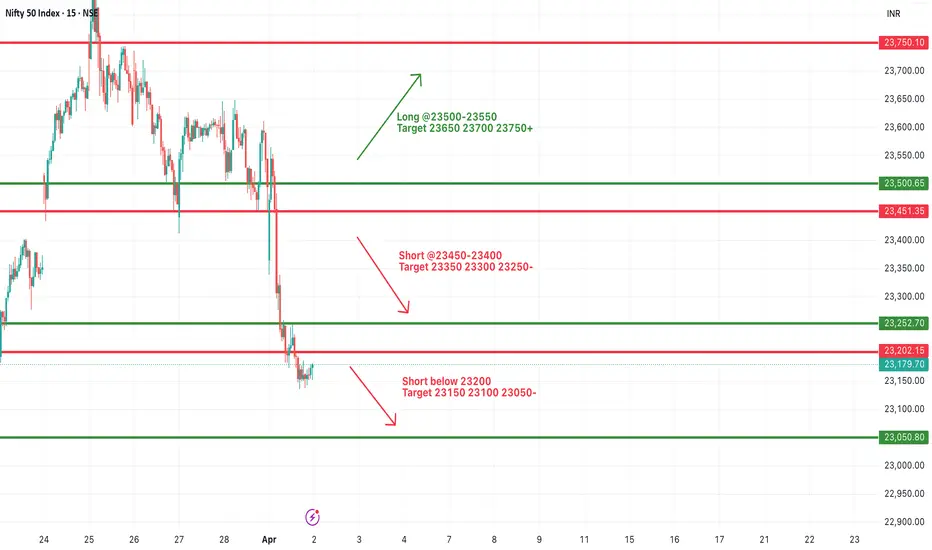
#NIFTY Intraday Support and Resistance Levels - 02/04/2025Today will be slightly gap up opening expected in nifty. After opening if nifty starts trading below 23200 level then expected sharp downside upto 23050 level in opening session. Upside 23450 level will act as a strong resistance for today's session. Any bullish side rally can reversal from this level.
[INTRADAY] #BANKNIFTY PE & CE Levels(02/04/2025)Today will be slightly gap up opening expected in index near 51000 level. After opening it will face strong resistance at this level and expected reversal direction towards the 50550 level. This downside rally can extend for further 400-500+ points in case banknifty starts trading below 50450 level. Any bullish side rally only expected if banknifty starts trading and sustain above 51050 level.

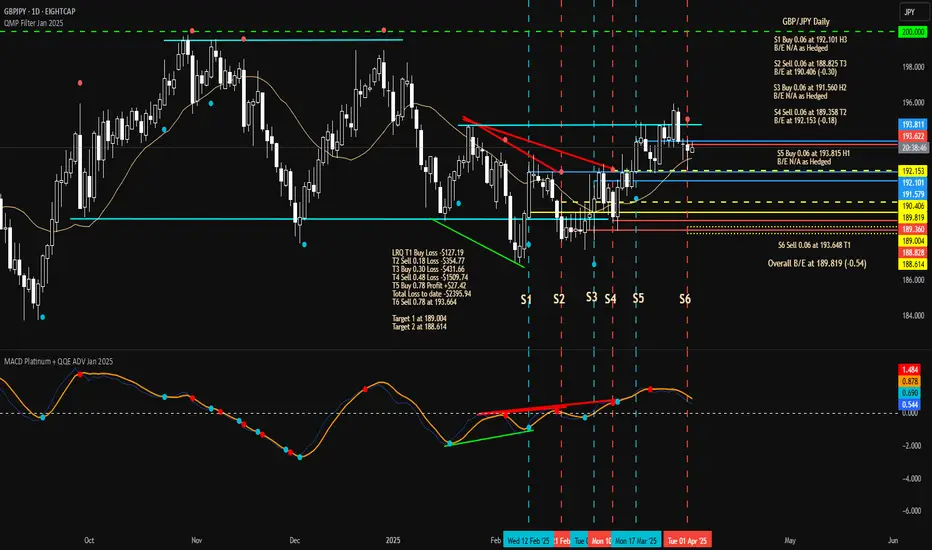
Wed 2nd Apr 2025 GBP/JPY Daily Forex Chart Sell SetupGood morning fellow traders. On my Daily Forex charts using the High Probability & Divergence trading methods from my books, I have identified a new trade setup this morning. As usual, you can read my notes on the chart for my thoughts on this setup. The trade being a GBP/JPY Sell. Enjoy the day all. Cheers. Jim
Bitcoin Rejection from Resistance – Short Setup with Bullish PotBitcoin is currently testing a key resistance zone around $85,500, where previous price action showed strong selling pressure. A rejection from this level could lead to a short-term pullback towards $83,750 - $83,250 , aligning with a retest of the broken trendline before a potential bullish continuation.
🔹 Entry: $85,200 - $85,500
🔹 Stop-Loss (SL): $86,000
🔹 Take-Profit (TP): $83,750, with potential long re-entry from this zone targeting $86,000+
📊 Watch for price action confirmation within the resistance zone before entering. If BTC holds above $85,500, the bullish breakout could accelerate. 🚀

GOLD(XAUUSD) -Weekly Forecast,Technical Analysis & Trading IdeasMidterm forecast:
2772.38 is a major support, while this level is not broken, the Midterm wave will be uptrend.
We will close our open trades, if the Midterm level 2772.38 is broken.
OANDA:XAUUSD TVC:GOLD
Technical analysis:
A trough is formed in daily chart at 2832.55 on 02/28/2025, so more gains to resistance(s) 3100.00, 3150.00, 3200.00 and more heights is expected.
Take Profits:
2833.00
2879.11
2955.00
3000.00
3057.40
3100.00
3150.00
3200.00
__________________________________________________________________
❤️ If you find this helpful and want more FREE forecasts in TradingView,
. . . . . . . . Hit the 'BOOST' button 👍
. . . . . . . . . . . Drop some feedback in the comments below! (e.g., What did you find most useful? How can we improve?)
🙏 Your support is appreciated!
Now, it's your turn!
Be sure to leave a comment; let us know how you see this opportunity and forecast.
Have a successful week,
ForecastCity Support Team

Jio Financials Inverse Head & ShoulderThere is a developing pattern on the charts of Jio Financials.
The levels are marked clearly.
This is to spread awareness and pass my technical analysis learnings.
Conduct your own research before taking any financial decision.

TradeCityPro | INJUSDT Best Trade Setup of the Week?👋 Welcome to TradeCityPro Channel!
Let's analyze and review one of the most popular cryptocurrency coins, which is in a more favorable situation than the majority of altcoins together!
🌐 Overview Bitcoin
Before starting the analysis, I want to remind you again that we moved the Bitcoin analysis section from the analysis section to a separate analysis at your request, so that we can discuss the status of Bitcoin in more detail every day and analyze its charts and dominances together.
This is the general analysis of Bitcoin dominance, which we promised you in the analysis to analyze separately and analyze it for you in longer time frames.
📊 Weekly Time Frame
On the weekly time frame, I see that the seventh period is stable, inj, and compared to the majority of altcoins that have their own low price levels, it is in a better space and is engaged in its own supports!
After breaking the primary trend ceiling, namely 9.28, we experienced a sharp upward movement and formed a historical ceiling at $53, and after forming a distribution box and breaking the important floor of 16.20 and pulling back to it, we experienced a continued decline.
We have now reached support again, which was previously a very important resistance, and now, as a result, it is probably not lost, but the weekly candle is a very good and bearish candle! Don't forget to save your profit, your strategy booklet and your positions, otherwise you will have made a 450% move without adding anything to your capital!
📉 Daily Time Frame
On the daily time frame, our trend is completely bearish as you can see and the events are completely accompanied by the formation of a downward bottom and top, but we are likely to suffer for a while.
After getting rejected from 34.16 and forming a box between 20.16 and 25.93 and losing the bottom, it made a move and then while pulling back with low volume and the next conversion to red, it became an inverted Sharpe, we experienced a decline!
Currently, we are forming a box between 8.63 and 10.68, and for selling and short positions, you can do this by breaking 8.63, and for the trigger spot risk and buying, if you feel the price is good, it is better to wait for the trend to break and do the trigger at 10.68. Let it structure.
✍️ Final Thoughts
Stay level headed, trade with precision, and let’s capitalize on the market’s top opportunities!
This is our analysis, not financial advice always do your own research.
What do you think? Share your ideas below and pass this along to friends! ❤️

#TRUMPUSDT — Breakdown or Reversal Confirmation🚀 BYBIT:TRUMPUSDT.P — Breakdown or Reversal Confirmation? Full Breakdown on 1H & 4H!
Let’s start by analyzing the charts on different timeframes:
✅ On the 1H chart , we clearly see a reversal pattern — Inverted Head & Shoulders — and the neckline breakout has already occurred. The volume on the breakout is high, which confirms the strength of the signal.
➡️ The target for this pattern is around $10.75–$10.80, which also aligns with the upper VPOC level from the previous range.
➡️ The POC level for BYBIT:TRUMPUSDT.P is $10.159, which may now act as support — this can be a potential entry zone.
➡️ Nearest resistance is at $10.40. A breakout above this level could trigger an impulse move towards $10.75–$10.80.
✅ On the 4H chart , a bearish flag is forming, which could potentially push the price lower — but this scenario hasn't played out yet.
➡️ There's also a local double bottom, confirmed by a price bounce. A retest of the flag’s lower boundary will be a key moment.
Let’s break down the patterns:
✅ 1. Inverted Head & Shoulders (1H) – A classic bottom reversal formation.
➡️ The neckline breakout occurred on increased volume — a key confirmation for a long setup.
✅ 2. Volume (Volume Profile & Bars) – Strong volume spike during the breakout confirms buyer interest.
✅ 3. Price broke out of consolidation – We’ve seen an impulsive breakout and the price is holding above the neckline.
✅ 4. Local Market Structure Break (MSB) – A shift from local downtrend to an emerging uptrend.
📍 Key Point: If the price holds above $10.40, this confirms a breakout from the descending channel, increasing the chance of reaching $10.75–$11.00.
📍 Price must also stay above $10.15 and not fall back into the previous range. A retest and bounce from this level would serve as further confirmation.
📢 If the price drops back below $10.15 and breaks $9.87, the “Inverted Head & Shoulders” pattern will be invalidated. In that case, a bearish trend will likely resume and a short toward $9.50–$9.00 could be considered.
📢 On the 4H chart, the risk of the bearish flag playing out still remains. We are monitoring the structure closely — a sharp pullback is possible.
📢 The volume zone around $10.15–$10.20 is key. As long as the price stays above it — the long scenario remains dominant.
🚀 As of now, BYBIT:TRUMPUSDT.P has strong technical reasons to support a long bias, especially if it holds above $10.40 — that would open the door to $10.75–$11.00.
Risks remain — particularly around the 4H bearish flag — but for now, bullish momentum prevails.
🚀 BYBIT:TRUMPUSDT.P still holds upside reversal potential — LONG scenario remains the priority!

USD/CAD Pulls Back After Hitting 1.4400FenzoFx— The USD/CAD pair hit 1.4400 but lost momentum, pulling back from resistance. Technically, USD/CAD may dip toward the 50-period SMA near 1.4330 before resuming its uptrend.
However, if USD/CAD drops below 1.4330, the bearish momentum may extend to the 1.4250 support, invalidating the bullish outlook.

Triangle Breakout in JPY/USD – Bullish Move Ahead?This TradingView chart represents a detailed technical analysis setup for the Japanese Yen (JPY) against the U.S. Dollar (USD). The main focus of the chart is a symmetrical triangle pattern breakout, a common formation that signals potential price movement.
In this detailed breakdown, we will analyze the following aspects:
Technical Pattern: Symmetrical Triangle Formation
Support and Resistance Levels
Breakout Confirmation
Trading Setup Explanation
Risk Management Strategy
Market Expectations (Bullish & Bearish Scenarios)
Conclusion & Trading Plan
1. Technical Pattern: Symmetrical Triangle Formation
The chart showcases a symmetrical triangle, which is a continuation pattern that typically occurs in trending markets. It indicates a period of consolidation where buyers and sellers struggle for dominance, leading to an eventual breakout.
Characteristics of the Symmetrical Triangle in This Chart:
Converging Trendlines:
The upper trendline (resistance) is sloping downward, showing lower highs.
The lower trendline (support) is sloping upward, showing higher lows.
Apex Formation:
As the price moves closer to the triangle's apex, volatility decreases, creating a squeeze effect.
Breakout Possibility:
Once price reaches a critical point, a breakout is expected in either direction.
Why is This Pattern Important?
Symmetrical triangles suggest that the market is indecisive, but once a breakout occurs, it can trigger a strong price movement.
Traders wait for the breakout direction to confirm the trade before entering a position.
2. Key Support and Resistance Levels
Support and resistance levels are crucial for identifying potential entry, stop-loss, and target areas.
Resistance Level:
A horizontal resistance zone (highlighted in beige) is drawn at the top.
This zone represents historical price rejection levels, where sellers have previously stepped in.
A confirmed breakout above this level would indicate strong bullish momentum.
Support Level:
The lower support zone (marked in blue) acts as a buying interest area.
Price has bounced off this zone multiple times, confirming it as a strong support level.
A break below this zone would signal a bearish reversal.
Trendline Support:
The lower boundary of the symmetrical triangle also acts as dynamic support.
If price respects this trendline, it suggests bullish strength leading to a breakout.
3. Breakout Confirmation & Market Reaction
The most important part of the setup is the breakout, which occurs when the price successfully moves beyond the triangle's trendline resistance.
Key Observations from the Chart:
Breakout Zone:
The breakout occurs near the right edge of the triangle (circled in red).
The price breaks above the upper trendline, confirming a bullish breakout.
Confirmation Candle:
A bullish candle follows the breakout, confirming buying pressure.
Traders should wait for a retest of the trendline before entering.
Volume Consideration:
Strong breakout moves are typically accompanied by a rise in volume, increasing the likelihood of follow-through.
4. Trading Setup Explanation
This trade follows a trend-following breakout strategy, where traders capitalize on price momentum after confirmation.
Entry Point:
The ideal entry is just above the breakout candle.
Traders can also wait for a retest of the broken trendline before entering.
Stop Loss Placement:
The stop loss is placed slightly below the previous swing low at 0.006652.
This prevents excessive drawdowns in case of a false breakout.
Profit Target Calculation:
The profit target is set at 0.006795, which is calculated based on:
The height of the triangle formation projected from the breakout point.
The next major resistance level, aligning with historical price action.
5. Risk Management Strategy
Risk management is a critical component of any trading strategy. Here’s how it is applied in this setup:
Risk-to-Reward Ratio (RRR):
A good trade setup maintains an RRR of at least 2:1.
If the stop loss is 33 pips (0.000033) and the target is 112 pips (0.000112), the RRR is 3:1, making this a high-probability trade.
Position Sizing Consideration:
Risk per trade should be limited to 1-2% of the total account balance.
Leverage should be used cautiously, as breakouts can sometimes retest the breakout zone before continuing.
6. Market Expectations (Bullish & Bearish Scenarios)
Bullish Scenario (Successful Breakout):
✅ If price sustains above the breakout level, it will likely continue to rally toward the target at 0.006795.
✅ A strong bullish momentum candle would confirm further buying pressure.
✅ If volume supports the breakout, trend continuation is highly probable.
Bearish Scenario (False Breakout or Reversal):
❌ If price falls back inside the triangle, it indicates a false breakout.
❌ If price closes below 0.006652, bears take control, and price may drop further.
❌ A breakdown below the support level would shift the market sentiment bearish.
7. Conclusion & Trading Plan
This chart presents a classic symmetrical triangle breakout trade with a clear entry, stop-loss, and target strategy.
Summary of Trading Plan:
Component Details
Pattern Symmetrical Triangle
Breakout Direction Bullish
Entry Point Above the breakout confirmation candle
Stop Loss 0.006652 (below support)
Take Profit (Target) 0.006795
Risk-to-Reward Ratio Favorable (3:1)
Market Bias Bullish (if price sustains above breakout)
Final Considerations:
Always wait for confirmation before entering.
Monitor volume and price action for additional validation.
Stick to the risk management plan to minimize losses.
If executed correctly, this setup offers a high-probability trade with a strong risk-to-reward ratio, making it a profitable trading opportunity in the JPY/USD market.
