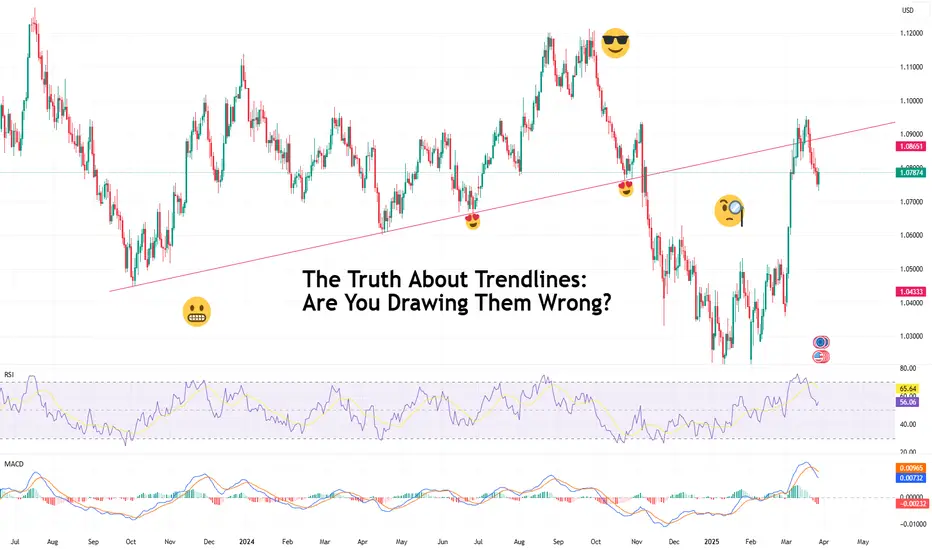
The Truth About Trendlines: Are You Drawing Them Wrong?If your trendlines look like a toddler took a crayon to your chart, we need to talk. Or if you draw them so much that your chart looks like a spider web, we still need to talk.
Trendlines are one of the most abused, misinterpreted, and downright misused tools in technical analysis. Used correctly, they can give you a structured view of market direction, potential reversals, and areas of interest.
Used incorrectly? Well, they can be your fast lane to bad trades, broken accounts, and questioning your life choices.
So, are you drawing them wrong? Let’s find out.
📞 A Trendline Is Not Your Emotional Support Line
This is big because it happens virtually every day across the charts. When a trade is going south, it’s tempting to adjust your trendline just to make your setup look valid again. That’s not technical analysis—that’s denial. A proper trendline should connect clear pivot highs or lows, not be forcefully manipulated to fit a bias.
Traders do this all the time. Price action no longer respects their original line, so they just… move it. As if shifting the goalposts somehow changes reality. It doesn’t. If your trendline gets broken, respect the price action and get out, don’t adjust the line because you risk dragging your account deeper in losses.
🤝 Two Points Make a Line—But Three Make It Real
Here’s where most traders mess up. They draw a trendline the moment they see two points connecting. Sure, two points technically make a line, but two random highs or lows do not make a valid trend.
A legitimate trendline should be tested at least three times to confirm that price actually respects it. Until then, it’s just a hopeful hypothesis. But we gotta give it to the early spotters — yes, if you see two points, pop open a trade and it pans out nicely, then you’ve chomped down on the good grass before the other animals.
The more times price touches and respects the trendline, the stronger it is but the risk of it getting overcrowded increases. Anything less than three touches? You’re basically trading off a hunch with a potentially higher risk-reward ratio.
⚔️ Wicks, Bodies, or Both? The Great Debate
Should you draw trendlines through candle wicks or just use the bodies of the candlesticks ? If you’ve spent any time in trading communities, you’ve probably seen this debate get heated enough to break friendships.
Here’s the deal:
If you’re trading short-term price action, drawing trendlines using candle bodies makes sense because it reflects where most of the market agreed on price.
If you’re looking at major trends, wicks matter because they show extreme liquidity zones where prices actually reached before snapping back.
⛑️ Steep Trendlines Are a Disaster Waiting to Happen
If your trendline looks more like a vertical cliff than an actual slope, you might want to reconsider its validity. The steeper the trendline, the less reliable it is.
A proper trendline should represent a natural flow of zigging and zagging price action. If it’s moving up too aggressively, it’s usually unsustainable. That’s why parabolic runs tend to end with painful crashes—what goes up too fast typically comes down even faster.
If your trendline is forming an angle sharper than 45 degrees , be careful. Sustainable trends don’t need a rocket launch trajectory to prove their strength.
🌊 One Chart, One Trendline (or Two)—Not Ten
Some traders draw so many trendlines that their charts get lost under the weight of too many lines. If you need to squint to see price action through the mess of lines, you’re doing too much.
Here’s a golden rule in drawing trendlines: less is more. Trendlines should highlight key structures, not overwhelm you with information. If you find yourself drawing trendlines at every minor high and low, take a step back. A clean chart is a tradable chart and one or two trendlines are usually enough to help uncover price direction.
🚩 Breakouts Aren’t Always Breakouts
One of the biggest mistakes traders make is assuming that when the price breaks a trendline, it’s an instant reversal signal. It’s not.
Markets (or well-trained algos) love to fake out emotional traders. Just because price dips below your uptrend line doesn’t mean the trend is over—it could just be a temporary pullback or liquidity grab (stop-loss hunting?) before continuing in the original direction.
Always wait for confirmation. A proper breakout should come with:
Increased volume (to validate the move)
Retest of the broken trendline (flipping from support to resistance, or vice versa)
Clear follow-through (not just a single candle wick that breaks and snaps back)
The market loves tricking traders into premature entries or exits. Don’t fall for it—instead, use some technical backup like looking for a double top, a head and shoulders or some other popular chart pattern .
☝️ The Only Trendline That Matters? The One The Market Respects
At the end of the day, trendlines are just tools—guides to help you structure price action. They’re not magical indicators. They don’t necessarily predict the future. They simply help visualize market tendencies.
If price constantly breaks through your trendline and ignores it, guess what? It’s not a valid trendline. The best traders don’t force a narrative—they adjust their view based on what the price is actually doing.
So next time you find yourself drawing, adjusting, or forcing trendlines into existence, ask yourself: Am I analyzing the market, or just trying to make myself feel better? Because the market isn’t wrong—so better check your trendlines twice.
Now off to you—are you using trendlines in your charts and do you wait for the third point to connect before moving in? Share your experience in the comment section!
Technical Analysis
XRP ANALYSIS🔮#XRP Analysis 💰💰
#XRP is trading in a symmetrical triangle in a weekly time frame and if it breakouts with high volume then we can see a bullish momentum in #XRP. Before that we will see little bit bearish movement towards its support zone and that a bullish movement.
🔖 Current Price: $2.3520
⏳ Target Price: $2.9740
⁉️ What to do?
- We can trade according to the chart and make some profits in #XRP. Keep your eyes on the chart, observe trading volume and stay accustom to market moves.💲💲
🏷Remember, the crypto market is dynamic in nature and changes rapidly, so always use stop loss and take proper knowledge before investments.
#XRP #Cryptocurrency #Pump #DYOR

DOLLAR INDEX (DXY): Strong Bullish Sentiment
As I predicted yesterday, Dollar Index continued growing.
Analyzing the intraday price action today,
we can see that the market established a nice rising channel on a 4H.
I think that the Index will keep rising within a channel and will reach 105.0 level soon.
❤️Please, support my work with like, thank you!❤️

GDP Data in Focus – Gold Traders Prepare for Volatility⚠️ GDP Data in Focus – Gold Traders Prepare for Volatility
🟡 Market Brief – 27/03/2025
📰 Trump’s Latest Tariff Remarks Leave Markets Unshaken
Earlier this morning (end of US session), Donald Trump made new comments on tariff policy.
However, unlike previous occasions, his speech did not trigger significant market volatility.
He stated:
“Reciprocal tariffs will be eased, broadly applied to all countries, but not harshly.”
🔹 A 25% import tariff on cars will take effect from April 2
🔹 No additional tariffs for now on semiconductors or pharmaceuticals
→ It appears the market had already priced in this announcement, resulting in a muted reaction.
📊 Today’s Spotlight – Final US GDP (q/q)
This is the broadest measure of inflation, reflecting price changes for all goods and services included in GDP.
Given the weakness in recent US inflation indicators (CPI & PPI),
AD anticipates today’s GDP may also come in weaker than expected.
⚠️ However, market reaction might remain limited (≈30 pts),
as Core PCE data tomorrow is expected to be the true driver of weekly volatility.
🟡 Gold Strategy – Intraday Setup
Gold may retest resistance levels or recent highs,
before a potential strong move to the downside – the BIG SHORT scenario AD has been tracking.
📌 Plan for Today:
Look for intraday BUY opportunities during the Asian and European sessions,
especially near key support levels marked on the chart.
🧭 Key Technical Levels:
🔻 Support: 3019 – 3011 – 3002 – 2988
🔺 Resistance: 3036 – 3046 – 3056
🎯 Trade Zones – 27/03:
🟢 BUY ZONE: 3002 – 3000
SL: 2996
TPs: 3006 – 3010 – 3014 – 3018 – 3022 – 3026 – 3030
🔴 SELL ZONE: 3055 – 3057
SL: 3061
TPs: 3051 – 3047 – 3042 – 3038 – 3034 – 3030
🧠 Final Note:
This week’s volatility hinges on two major macro releases:
✅ Today’s Final GDP report
✅ Tomorrow’s Core PCE data
→ During Asia & London sessions: respect the levels and trade reactively
→ For New York session: stay alert — AD will update instantly if needed
Good luck, trade safe, and stay disciplined.
— AD | Money Market Flow

#NIFTY Intraday Support and Resistance Levels - 27/03/2025Flat opening expected in nifty. After opening if nifty starts trading and sustain above 23550 level then expected upside movement upto 23750+ level in today's session. Major downside expected below 23500 level. This downside rally can goes upto 23250 in today's session.

[INTRADAY] #BANKNIFTY PE & CE Levels(27/03/2025)Today will be slightly gap down opening expected in index. After opening possible banknifty consolidate in between the 51050-51450 level in today's session. Any upside rally only expected if banknifty starts trading and sustain above 51550 level. Major downside expected in index if it's give breakdown of 50950 level. This downside rally can goes upto 50550 level.

Nightly $SPY / $SPX Scenarios for March 27, 2025 🔮 🔮
🌍 Market-Moving News 🌍:
🇺🇸🚗 Auto Tariffs Announced: President Trump has announced a 25% tariff on all cars not made in the U.S., effective April 2. This move is expected to impact the automotive industry and could influence market sentiment.
🇬🇧📉 UK Inflation Falls: UK inflation has decreased to 2.8% in February, down from 3% in January, raising speculation about a potential interest rate cut by the Bank of England in May. This development may have implications for global markets.
📊 Key Data Releases 📊
📅 Thursday, March 27:
📉 Initial Jobless Claims (8:30 AM ET):
Forecast: 226,000
Previous: 223,000
Indicates the number of individuals filing for unemployment benefits for the first time during the past week, offering insight into the labor market.
📈 Gross Domestic Product (GDP) – Second Revision (8:30 AM ET):
Forecast: 2.3% annualized growth
Previous: 2.3%
Provides a second estimate of the nation's economic growth for the fourth quarter of 2024.
🏠 Pending Home Sales Index (10:00 AM ET):
Forecast: 1.0%
Previous: -4.6%
Measures housing contract activity for existing single-family homes, offering insights into future home sales.
⚠️ Disclaimer: This information is for educational and informational purposes only and should not be construed as financial advice. Always consult a licensed financial advisor before making investment decisions.
📌 #trading #stockmarket #economy #news #trendtao #charting #technicalanalysis
Gold Outlook – Steady Range Before Key Data Hits🟡 Market Context:
Gold has been trading in a steady range since the start of the week, with no significant breakout or momentum shift observed.
Today’s session is expected to remain quiet, as there are no major economic events scheduled.
All eyes are on the Thursday GDP release and Friday’s PCE inflation data from the US — both of which are likely to determine the direction for gold into the end of the month and quarter.
📆 Key Data to Watch:
Thursday: US Quarterly GDP
Friday: US PCE Price Index (Federal Reserve’s preferred inflation gauge)
These events are considered high-impact catalysts that may trigger sharp moves in gold, especially if surprises occur.
🔍 Technical Structure:
Price continues to respect key support and resistance zones identified earlier this week.
There is no confirmed breakout yet, so the strategy remains range-based:
➡️ Trade the levels. Watch for reaction signals at extremes.
➡️ Wait for clearer momentum following the macro releases.
🧭 Key Price Levels:
🔺 Resistance: 3,010 – 3,036 – 3,046 – 3,057
🔻 Support: 3,010 – 3,001 – 2,988
🎯 Trade Plan – 26/03
BUY ZONE: 2988 – 2986
SL: 2982
TP: 2992 – 2996 – 3000 – 3004 – 3008 – 3015
SELL ZONE: 3045 – 3047
SL: 3051
TP: 3042 – 3038 – 3034 – 3030 – 3026 – 3020
🧠 Final Notes:
The market remains in accumulation mode ahead of key US data.
No need to rush — protect your capital, wait for clean setups, and let the market reveal its hand.
— AD | Money Market Flow

ZCash (ZEC)- Weekly Forecast,Technical Analysis & Trading IdeasMidterm forecast:
While the price is above the support 24.41, beginning of uptrend is expected.
We make sure when the resistance at 45.33 breaks.
If the support at 24.41 is broken, the short-term forecast -beginning of uptrend- will be invalid.
COINBASE:ZECUSD
Technical analysis:
A trough is formed in daily chart at 29.20 on 03/21/2025, so more gains to resistance(s) 41.10 and maximum to Major Resistance (45.33) is expected.
Take Profits:
35.60
41.10
45.33
50.14
56.49
67.07
79.42
90.06
100.00
117.07
135.00
170.00
216.50
305.00
370.55
__________________________________________________________________
❤️ If you find this helpful and want more FREE forecasts in TradingView,
. . . . . . . . Hit the 'BOOST' button 👍
. . . . . . . . . . . Drop some feedback in the comments below! (e.g., What did you find most useful? How can we improve?)
🙏 Your support is appreciated!
Now, it's your turn!
Be sure to leave a comment; let us know how you see this opportunity and forecast.
Have a successful week,
ForecastCity Support Team

AUD/CAD – Potential Bullish Reversal from Key Support📊 Chart Analysis
1️⃣ Accumulation Zone : The price previously traded within a rectangular consolidation range before breaking down.
2️⃣ Bullish Reversal Pattern : A falling wedge has formed, indicating a possible breakout to the upside.
3️⃣ Key Support : The price has tested the 0.8980 - 0.8970 zone multiple times and is showing signs of rejection.
4️⃣ Potential Upside : A breakout above 0.9030 - 0.9050 could confirm further bullish momentum.
🚀 Trading Plan:
📌 Entry : On a breakout above 0.9025
🎯 Targets :
First target : 0.9100
Extended target : 0.9130
🛑 Stop Loss : Below 0.8965 to minimize risk.
🔔 Confirmation Needed: Wait for strong bullish price action before entering long trades. 🚀🔥

Gold (XAU/EUR) – Potential Sell Setup from Rising Wedge📉 Market Structure & Pattern:
The chart shows a broadening wedge pattern followed by a rising wedge formation.
Price has reached the upper boundary of the descending channel, where a potential sell-off could begin.
📉 Bearish Outlook:
The sell signal is indicated near 2,811 EUR, suggesting a possible reversal.
The target area is around 2,769 - 2,700 EUR, aligning with previous support zones.
If the price breaks below the wedge structure, further downside momentum is expected.
📌 Trading Plan:
Bears may look for short opportunities around resistance.
A break below 2,794 EUR could confirm further downside.
Bulls should monitor price action for any rejection near support zones for potential buying opportunities.
⚠️ Risk Management:
A break above 2,815 EUR could invalidate the bearish setup.
Stop-loss placement above resistance is advisable to minimize risk.

USD/JPY Bullish Reversal (Inverse Head & Shoulders)📌 Pattern: Inverse Head & Shoulders
📌 Analysis: The chart showcases an inverse head and shoulders pattern, a classic bullish reversal formation. The price has successfully broken out of the downward trendline, indicating potential upside movement.
🔹 Left Shoulder: Formed during the previous retracement.
🔹 Head: The lowest point of the pattern, marking strong support.
🔹 Right Shoulder: Completed with a breakout above resistance.
📈 Trading Plan:
✅ Entry (Buy): After a confirmed breakout and possible retest.
🎯 Target: 153.988 - 154.672 (2.74% potential gain).
🔻 Support: 149.883 - 148.837 (Stops should be placed accordingly).
📊 Conclusion:
If the price maintains above the breakout level, we may see a strong rally toward the resistance target. Watch for volume confirmation and pullback retests before entering a trade.

Nasdaq in Correction: Technical Targets and Weekly OutlookWe can observe that Nasdaq has started a new corrective leg since its last recovery in early Q3 2024. Currently, the index is experiencing its first rebound and test of the 20-period moving average (MA20, in green) since this average turned downward. Typically, this scenario triggers a selling reaction, with the first target at the previous low of 19,200. If selling pressure intensifies, the next projections are at 18,300 and 17,900.
However, from a weekly perspective, there is still room for a deeper correction, potentially reaching the 200-period moving average (MA200), which is currently at 15,690. When applying a Fibonacci retracement to the last major bullish leg (Oct 10, 2022 – Feb 17, 2025), we see that the 50% retracement level aligns closely with the weekly MA200 at 16,300.
We know that price movements do not follow a straight line but rather unfold in waves. Given this context, the bias remains bearish, and I see further corrections ahead in the U.S. market.

GBP/USD Breakdown – Bearish Momentum Ahead?This 4-hour chart of GBP/USD shows a clear bearish setup:
🔹 Rising Wedge Breakdown – The pair has broken below a rising wedge pattern, signaling potential downside pressure.
🔹 Support and Resistance Levels –
Resistance at 1.29206 - 1.30275
Support at 1.28000 - 1.28437
Strong support at 1.27539
🔹 Sell Confirmation – A sell signal is indicated, suggesting further downside movement towards the target zone.
📉 Trading Plan:
✅ Possible short entries below the 1.28956 level.
✅ Target price: 1.27539
✅ Stop-loss above 1.29206 for risk management.
⚠️ Risk Note: Always manage risk properly and watch for any trend reversals before entering trades.
What are your thoughts? Are you bearish or bullish on GBP/USD? 🤔💬

(ETH/USD) Poised for a Major BreakoutMarket Structure & Analysis:
Falling Wedge Breakout: Ethereum previously broke out of a falling wedge pattern, which is a bullish reversal signal.
Ascending Triangle Formation: Price is currently forming an ascending triangle, indicating potential for a breakout.
Support Levels:
$2,021 – Local support.
$1,926 - $1,873 – Strong demand zone.
Resistance Levels:
$2,120 - $2,251 – First resistance zone.
$2,531 - $2,564 – Final bullish target zone.
Trading Plan:
Buy Setup:
Enter long on breakout above $2,120 with strong momentum.
Stop Loss: Below $2,021 (support level).
Take Profit Targets:
TP1: $2,251 (first resistance).
TP2: $2,531 (main target).
TP3: $2,564 (extended bullish target).
Risk Factors:
A failure to break $2,120 could result in a pullback to $1,926.
Macroeconomic factors or Bitcoin’s movement may impact Ethereum’s trend.

Gold (XAU/USD) Bullish Retest SetupMarket Structure & Analysis:
Uptrend Confirmation: Price has been in a strong bullish trend, forming higher highs and higher lows.
Resistance & Retest: The price recently hit a resistance zone around $3,054 and pulled back for a retest.
Support Zone: A key support level is marked at $3,010, which has held multiple times.
Bullish Retest Setup: If the price successfully retests this support level and confirms bullish momentum, we can anticipate a potential move toward the next resistance level.
Target Levels:
First Target: $3,054 (recent high)
Final Target: $3,089 (next major resistance)
Trading Plan:
Buy Setup: Enter after confirmation of bullish price action at the support level ($3,010).
Stop Loss: Below $3,010 to avoid false breakouts.
Take Profit:
TP1: $3,054
TP2: $3,089
Risk Factors:
If the support at $3,010 breaks, price may drop toward the next major support at $2,911, invalidating the bullish setup.
Economic events (such as FOMC meetings, CPI data, or geopolitical risks) may cause unexpected volatility in gold prices.

GBPCAD (H4) : Plan for SELLHello Traders,
📈 Chart review :
- D1 candle has got a bearish candle
- H4 make a swing HL
=> So I recommend sell this pair when it retest supply zone on h4
📚 Remember that: Always follow your trading plan regarding entry, risk management, and trade management.
Good luck!

GBPJPY: Time to Grow?! 🇬🇧🇯🇵
GBPJPY looks strongly bullish after the release of the today's fundamentals.
Bullish accumulation on an hourly time frame looks completed
and the price has just formed a high momentum bullish candle.
I expect a bullish movement at least to 194.6 level now.
❤️Please, support my work with like, thank you!❤️

EUR/JPY Triple Bottom Breakout – Bullish SetupThis chart represents the EUR/JPY currency pair on the daily timeframe. It highlights a Triple Bottom pattern, a bullish reversal formation that signals a potential upward trend after testing strong support multiple times.
1. Chart Pattern Analysis – Triple Bottom Formation
The Triple Bottom is a classic reversal pattern that forms after a downtrend and consists of three distinct lows at nearly the same level. This indicates that sellers attempted to push the price lower but failed three times, suggesting that buying pressure is increasing.
Bottom 1 (August 2024): The price reached a low near 150.344, forming the first support zone.
Bottom 2 (September 2024): The price dropped again to the same support level but bounced back, indicating strong demand.
Bottom 3 (March 2025): The price retested the support for the third time and rebounded, confirming the pattern.
💡 Key Takeaway: The repeated failure to break below the support level suggests that sellers are losing control, and buyers are preparing for a strong move up.
2. Support & Resistance Levels
Understanding support and resistance levels is crucial for identifying entry and exit points:
Support Level (150.344 - 150.125): This zone has acted as a strong demand area where price consistently bounced back.
Resistance Level (167.500 - 170.000): This is the neckline of the Triple Bottom pattern. A breakout above this level confirms the bullish trend.
If the price breaks above the resistance level, it will trigger buying momentum and open the doors for further upside.
3. Trading Strategy & Price Targets
✅ Entry Criteria
The ideal buy entry is after the price breaks above the resistance level (~167.500 - 170.000) with strong bullish momentum and increased volume.
Wait for a daily candle close above the resistance level to confirm the breakout.
🎯 Target Levels (Take Profit - TP)
TP1 (173.001) – First profit-taking level, as the price may encounter some resistance.
TP2 (179.266) – Final bullish target if the breakout holds strong.
📉 Stop Loss (Risk Management)
Stop Loss (SL): Below 150.125, just below the previous support level. This minimizes losses if the price fails to break out.
Risk-to-Reward Ratio: This setup offers a high risk-reward ratio, making it a favorable trade.
4. Market Psychology & Confirmation Signals
The Triple Bottom indicates a strong shift in market sentiment from bearish to bullish.
Confirmation signals to watch for:
✅ Bullish breakout above resistance
✅ Increase in trading volume
✅ Formation of bullish candlesticks (e.g., Engulfing, Marubozu, or Breakout Retest Confirmation)
5. Summary & Final Thoughts
🔹 The Triple Bottom pattern signals a strong reversal with clear upside potential.
🔹 The breakout above resistance (~167.500 - 170.000) will confirm a bullish trend.
🔹 Entry: Buy after breakout confirmation with volume support.
🔹 TP1: 173.001, TP2: 179.266
🔹 SL: Below 150.125 to protect capital.
🚀 Conclusion : This setup presents an excellent long opportunity with a well-defined risk-reward strategy. If the breakout holds, EUR/JPY could see a strong uptrend in the coming weeks.

EUR/GBP Chart Analysis – Double Bottom Reversal & Breakout Setup1. Market Structure & Context
The EUR/GBP daily chart presents a well-defined double bottom reversal pattern, indicating a potential trend shift from a prolonged downtrend to an uptrend.
The pair has been in a bearish phase, as reflected by the descending trendline.
However, price action suggests a possible trend reversal, as buyers are stepping in near a key demand zone.
A successful neckline breakout would confirm the bullish reversal, potentially leading to significant upside movement.
2. Key Chart Patterns & Technical Levels
A. Double Bottom Formation (Bullish Reversal Pattern)
The double bottom is a powerful reversal pattern, often signaling the end of a downtrend. It consists of two similar low points, forming a "W" shape.
Bottom 1: The first low was established around 0.8200 - 0.8250, where buyers initially stepped in to push prices higher.
Bottom 2: Price retested this demand zone, but sellers failed to push it lower, confirming a strong support level.
Bullish Significance: The inability of sellers to break below the support zone suggests the exhaustion of selling pressure and increasing buy-side interest.
B. Neckline Resistance & Potential Breakout Zone
The neckline resistance is drawn around 0.8450 - 0.8500, a key level where previous price rallies were rejected.
A breakout above this zone, ideally with strong bullish volume, would validate the double bottom pattern and trigger a bullish breakout trade.
C. Descending Trendline Breakout Attempt
The long-term downtrend resistance (trendline) has been holding since mid-2024.
Price is currently testing this trendline; a clear breakout and retest would add further confidence to the bullish bias.
3. Trade Setup & Execution Plan
A. Entry Strategy
There are two possible entry strategies, depending on risk appetite:
Aggressive Entry: Buy immediately upon a breakout above 0.8500, anticipating a strong rally.
Conservative Entry: Wait for a breakout + retest of the neckline before entering, ensuring confirmation.
B. Stop Loss & Risk Management
Stop Loss (SL): Placed below the recent swing low at 0.82029.
This level acts as the last line of defense for bulls; if price drops below it, the bullish thesis is invalidated.
C. Take Profit (TP) Targets
TP1: 0.86122 (first resistance zone, a previous swing high).
TP2: 0.87284 (higher resistance level, next supply zone).
These levels serve as potential profit-taking areas where sellers may re-enter the market.
4. Additional Technical Confluences Supporting Bullish Bias
✔ Key Support Zone Holding Strong – The price has bounced twice from the demand zone (0.8200 - 0.8250), confirming strong buyer interest.
✔ Volume Confirmation Needed – A breakout with high volume increases the probability of sustained bullish momentum.
✔ RSI & Momentum Indicators – If RSI crosses above 50, it would further confirm bullish momentum, supporting the breakout trade.
✔ Favorable Risk-to-Reward Ratio (RRR) – A well-defined stop loss & take profit strategy ensures an optimal trade setup.
5. Summary & Final Trading Plan
Current Market Bias: Bullish if neckline breaks (Double Bottom Confirmation).
Entry Confirmation: Look for a breakout above 0.8500 with strong volume.
Profit Targets:
TP1: 0.8612
TP2: 0.8728
Stop-Loss Level: Below 0.8202 to protect against fake breakouts.
🚀 Final Tip for Traders:
Monitor price action & volume closely. A breakout without volume may lead to a false move. Confirmation with bullish momentum is essential for a high-probability trade setup.

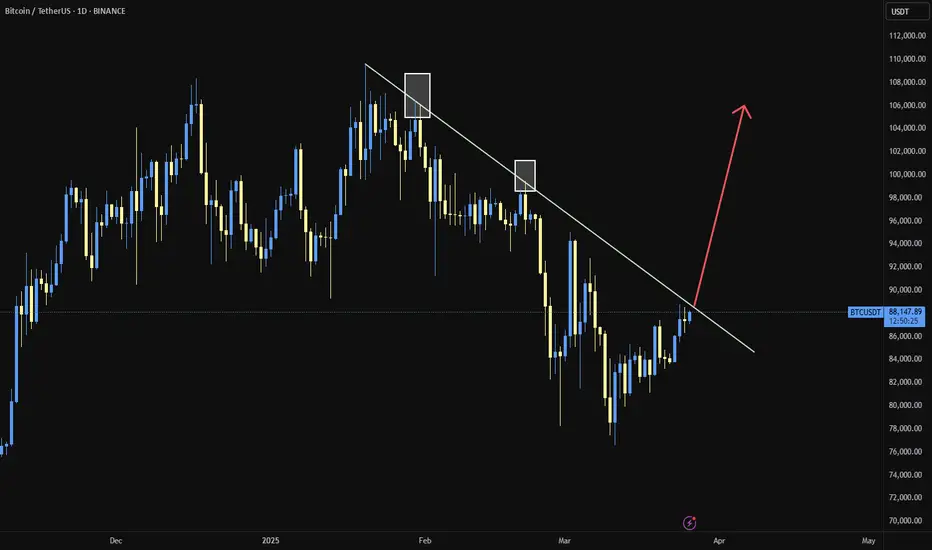
BTC/USDT"Do you think we're going up this time? I think it's taken quite a long time; we can enter a position if the resistance line breaks."
EUR/USD Triple Bottom Reversal | Bullish Breakout SetupChart Overview
This is a EUR/USD 1-hour chart showing a classic Triple Bottom Reversal Pattern, a strong bullish reversal signal. The price has tested a key support level multiple times, forming three distinct bottoms, indicating that sellers are losing momentum while buyers are stepping in.
This setup suggests an upcoming breakout, with well-defined entry, take profit, and stop-loss levels to capitalize on the potential upward move.
Technical Breakdown
1. Support & Resistance Zones
Support Zone (Highlighted in Beige)
The price has tested this zone multiple times without breaking below, confirming strong buying interest.
Each time the price touched this level, it rebounded, indicating accumulation by buyers.
Resistance Zone (Highlighted in Beige)
The price previously reversed from this level, making it a key area to watch for a breakout.
A confirmed breakout above this resistance could trigger strong upward momentum.
2. Triple Bottom Formation
A Triple Bottom is a strong bullish reversal pattern. It consists of:
Bottom 1: First rejection from support.
Bottom 2: A retest of support with buyers defending the level.
Bottom 3: The final touch before an upward move, confirming the pattern.
This pattern signals that selling pressure is diminishing and buyers are preparing for a strong breakout.
3. Bullish Reversal & Breakout Zone
A breakout above the neckline resistance (around 1.0843) will confirm the pattern.
Traders should wait for a confirmed candle close above the resistance before entering a long position.
A retest of the breakout zone can provide an additional entry opportunity.
Trade Setup & Key Levels
🔹 Entry Strategy
Aggressive Entry: Enter at the breakout level (above 1.0843) with volume confirmation.
Conservative Entry: Wait for a breakout retest before entering long.
🎯 Take Profit Targets
TP1: 1.08868 (First resistance zone)
TP2: 1.09642 (Major resistance zone, strong price reaction expected)
❌ Stop Loss Placement
Stop Loss: Below 1.06786, under the support zone.
This ensures that if the price breaks below the key level, the trade is invalidated.
Market Sentiment & Expected Move
If the price breaks the resistance → Expect a strong bullish move toward TP1 and TP2.
If the price fails to break out → It may consolidate further or retest support.
Watch for increased volume on the breakout to confirm strength.
📌 Final Thoughts
This is a high-probability bullish setup based on a well-formed Triple Bottom Reversal pattern. Traders should monitor price action near the breakout zone and manage risk effectively with proper stop-loss placement.

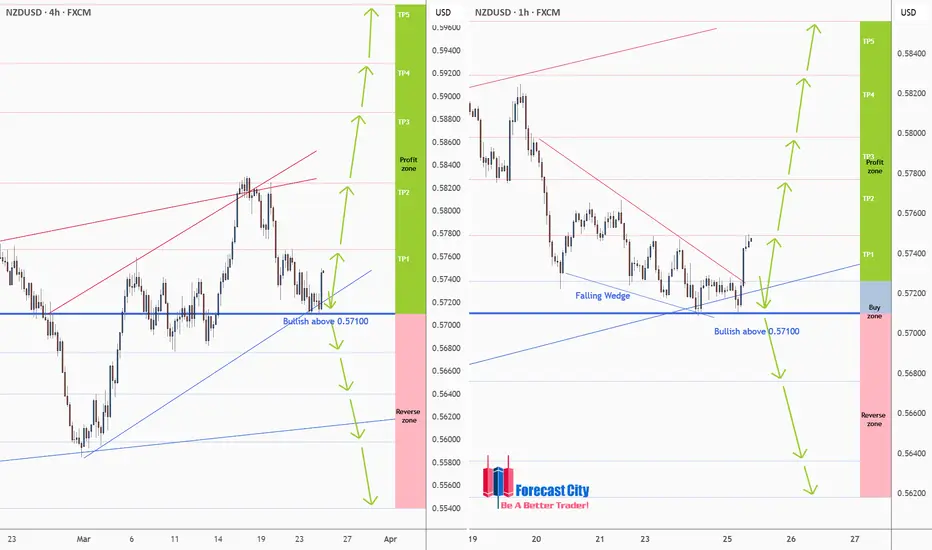
NZDUSD - H4, H1 Forecast - Technical Analysis & Trading IdeasTechnical analysis is on the chart!
No description needed!
OANDA:NZDUSD
__________________________________________________________________
❤️ If you find this helpful and want more FREE forecasts in TradingView,
. . . . . . . . Hit the 'BOOST' button 👍
. . . . . . . . . . . Drop some feedback in the comments below! (e.g., What did you find most useful? How can we improve?)
🙏 Your support is appreciated!
Now, it's your turn!
Be sure to leave a comment; let us know how you see this opportunity and forecast.
Have a successful week,
ForecastCity Support Team