UsdJpy buy continuation Taking Yesterday's low as Inducement my point of interest is 149.034. I'm anticipating price to retrace back to that zone before pushing toward.
Kindly boost if you find this insightful 🫴
Technical Analysis

Gold (XAU/USD) – Bullish Reversal & Breakout PatternChart Pattern Analysis
The 15-minute chart of Gold (XAU/USD) showcases a classic support-resistance structure, along with a potential bullish reversal pattern forming. The price is currently reacting to key levels, and the setup suggests an impending move toward higher price targets.
Key Chart Patterns Identified:
🔹 Support & Resistance Flip:
The price initially struggled at resistance (~$3,038 - $3,045) before experiencing a pullback.
It found strong support (~$3,027 - $3,030), confirming a potential retest zone for a bullish reversal.
🔹 Double Bottom Reversal Pattern:
The price bounced twice from the support zone, forming a possible double-bottom pattern – a classic bullish reversal sign.
If the price successfully holds this level, a breakout above the previous high (ATH - $3,045) is expected.
🔹 Break & Retest Structure:
A bullish breakout from resistance could trigger a rally toward the next target zone ($3,056 - $3,060).
A possible higher low formation suggests market accumulation before an upward continuation.
Trade Plan – How to Approach This Setup
📌 Entry Confirmation:
Look for a bullish candle formation at support (~$3,027 - $3,030).
A strong breakout and retest above ATH ($3,045) would provide further confirmation.
📌 Stop-Loss Placement:
Below support ($3,027) to limit downside risk.
If price breaks below this zone, the bullish scenario gets invalidated.
📌 Take-Profit Targets:
1️⃣ First Target: $3,045 (ATH breakout confirmation)
2️⃣ Final Target: $3,056 - $3,060 (Major Resistance & TP Zone)
Potential Market Scenarios:
✅ Bullish Breakout:
If price breaks & retests resistance ($3,045), a rally toward $3,060 is likely.
❌ Bearish Breakdown:
If price fails to hold support ($3,027), a drop to $3,020 - $3,015 could occur.
🚀 Final Thoughts:
This setup presents a high-probability bullish opportunity, but confirmation is key! Wait for price action signals before entering.
📊 Do you agree with this analysis? Drop your thoughts in the comments! 🔥

NZDJPY: Bearish Movement Confirmed 🇳🇿🇯🇵
All Yen pairs look bearish after the early morning BoJ interest
rate decision and press conference.
NZDJPY formed an inverted cup & handle pattern on a 4H
after a test of a key daily resistance.
High momentum bearish candle indicates a strong bearish sentiment.
I think that the price may drop at least to 86.2 level.
❤️Please, support my work with like, thank you!❤️
I am part of Trade Nation's Influencer program and receive a monthly fee for using their TradingView charts in my analysis.

Will Mixed Geopolitical News Limit the Downside of Oil Prices?Macro:
- Oil prices continued their decline following an agreement between the US and Russia to halt attacks on energy infrastructure, though without implementing a complete ceasefire.
- The market turned bearish amid expectations that Russian sanctions may be eased, potentially increasing the oil supply surplus.
- Uncertainty lingered as geopolitical tensions in the Middle East sent mixed signals. While the possibility of increased supply pushed prices down, fears of conflict disrupting oil production kept some upward pressure.
Technical:
- USOIL retested its descending channel's upper bound before rejecting the boundary and forming a bearish Engulfing Candlestick, which may provide a hint that bears are in control. The price is below both EMAs, indicating persistent bearish momentum.
- Breaking below the support at 65.80 may prompt another plunge to the 100% Fibonacci Extension at 64.00.
- Closing above 68.40 and breaking the descending channel's upper bound may shift the current structure sideways before retesting the following resistance at 70.20.
Analysis by: Dat Tong, Senior Financial Markets Strategist at Exness

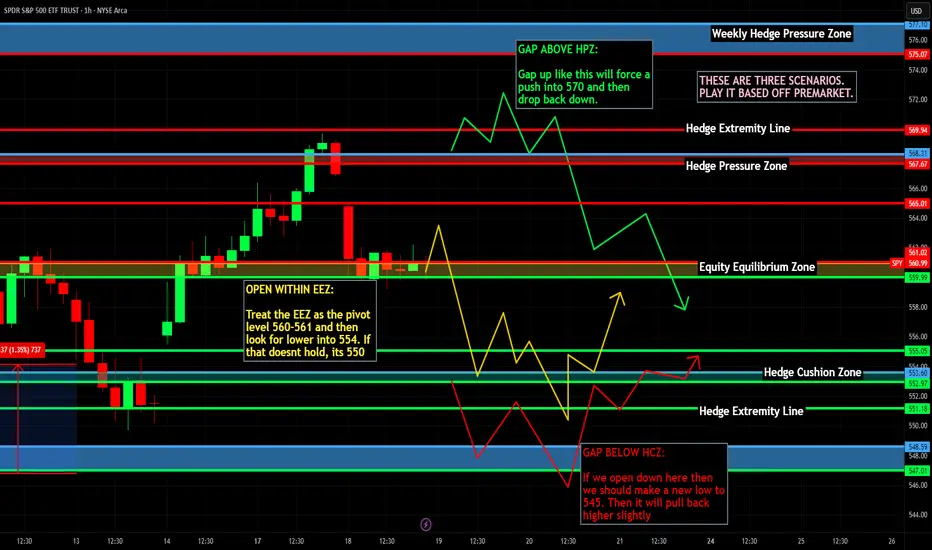
Nightly $SPY / $SPX Scenarios for March 19, 2025 🔮 🔮
🌍 Market-Moving News 🌍:
🇺🇸🏦 Federal Reserve Interest Rate Decision 🏦: The Federal Open Market Committee (FOMC) will announce its interest rate decision on Wednesday, March 19, at 2:00 PM ET, followed by a press conference with Fed Chair Jerome Powell at 2:30 PM ET. The Fed is widely expected to maintain the federal funds rate at its current range of 4.25% to 4.5%. Investors will closely monitor the Fed's economic projections and Powell's comments for insights into future monetary policy, especially in light of ongoing trade tensions and global economic uncertainties.
🇯🇵💴 Bank of Japan Monetary Policy Decision 💴: The Bank of Japan (BOJ) is set to announce its monetary policy decision on March 19. The BOJ is expected to keep interest rates steady, as policymakers assess the potential impact of U.S. trade policies on Japan's export-driven economy. The yen has remained stable ahead of the announcement, with traders awaiting the BOJ's guidance on future monetary policy.
📊 Key Data Releases 📊:
📅 Wednesday, March 19:
🏢 Existing Home Sales (10:00 AM ET) 🏢:This report measures the annualized number of existing residential buildings sold during the previous month, providing insight into the strength of the housing market.
Forecast: 5.50 million annualized units
Previous: 5.47 million annualized units
⚠️ Disclaimer: This information is for educational and informational purposes only and should not be construed as financial advice. Always consult with a professional financial advisor before making investment decisions.⚠️
📌 #trading #stockmarket #economy #news #trendtao #charting #technicalanalysis
#NIFTY Intraday Support and Resistance Levels - 19/03/2025Gap up opening expected in nifty. After opening expected resistance near 22950 level. Possible reversal from this level. Downside 22750 level will act as a support for nifty. Strong upside rally expected if nifty starts trading above 23000 level. This upside rally can goes upto 23250+ level in today's session.

Wed 19th Mar 2025 GBP/CHF Daily Forex Chart Sell SetupGood morning fellow traders. On my Daily Forex charts using the High Probability & Divergence trading methods from my books, I have identified a new trade setup this morning. As usual, you can read my notes on the chart for my thoughts on this setup. The trade being a GBP/CHF Sell. Enjoy the day all. Cheers. Jim

NAS100 Potential Intraday Shorts (Technical Analysis)Technical Outlook:
The price action since late February has been decisively bearish, characterized by a significant decline throughout March, indicating a clear mid-term distribution phase. We observed a recent rejection from a 4H and 1H supply zone (which fell within a pronounced drop-base-drop pattern). Notably, the most recent downward push failed to establish new lows. This follows a period of rapid decline with minimal bullish resistance. This suggests two possibilities:
Bulls are strategically allowing sellers to exhaust themselves before a potential countermove.
The prevailing bearish momentum is overpowering any attempts at bullish recovery.
Trading Considerations:
The daily candle has formed a bearish engulfing pattern, confirming strong selling pressure. My trading strategy involves waiting for a price retracement back into the identified supply zone. This pullback would serve to fill existing price imbalances and trigger resting orders above, providing an opportunity to enter short positions with improved risk-to-reward ratios on lower timeframes (LTFs). Currently, there are no indications of significant bullish manipulation. Therefore, I anticipate continued downward momentum this week. It's plausible that we might witness a final bearish surge coinciding with the FOMC announcement before a potential bullish reversal - a hypothetical scenario based on technical analysis.
Final Notes:
The previous instance of the price trading this far below the 200 EMA occurred in December 2022, marking the culmination of a year-long bearish trend. While we are currently only one month into this downward movement, it's crucial to remember that past performance is not indicative of future results. Although a bullish rally is possible, I will maintain a bearish bias and focus on short opportunities until a clear bullish reversal pattern emerges on the 4H and 1H timeframes. When such a reversal occurs, we will be ready to capitalize on the subsequent upward trend! ;)

ARB/USDT – The zone is interesting for starting accumulation.Arbitrum - is an Ethereum layer-two (L2) scaling solution. It uses optimistic rollups to achieve its goal of improving speed, scalability and cost-efficiency on Ethereum. Arbitrum benefits from the security and compatibility of Ethereum. Another benefit is the higher throughput and lower fees compared to Ethereum. That is made possible thanks to moving most of the computation and storage load off-chain.
Arbitrum’s native token is called ARB and is used for governance. Offchain Labs, the developers behind Arbitrum, announced the shift to a decentralized autonomous organization (DAO) structure — the Arbitrum DAO. ARB holders can vote on proposals that affect the features, protocol upgrades, funds allocation and election of a Security Council.
CoinMarketCap : #51
The hyped-up Arbitrum! 😂
📉 January - February - March 2024: Bloggers trapped a huge number of people, and now we’re seeing a massive -87% decline!
Looking at the main trend, a large descending channel is forming. The price is currently at the support of the inner channel, and if the market makes a final liquidity grab with a downward wick, the price could head toward the support of the outer channel, targeting a -30% drop.
In my previous trading idea, I marked the 1.1552 zone, which is exactly where the price reversed. Everything is marked on the chart—the potential profit is very solid, especially for spot trading. The price will react strongly to the resistance zones of both the inner and outer channels.
🚀 These are the moments to watch for position accumulation—when no one is interested and belief in growth is dead, not when everyone is screaming "BUY NOW!" at local tops!
*I will update the trading idea as the trend develops.

NZDCAD: Bearish After the News?! 🇳🇿🇨🇦
NZDCAD turned bearish after a release of Canadian Inflation data.
The price retraced from a key daily resistance and broke
a support line of a rising parallel channel on an hourly time frame.
The market may drop at least to 0.8293
❤️Please, support my work with like, thank you!❤️
I am part of Trade Nation's Influencer program and receive a monthly fee for using their TradingView charts in my analysis.

AUDNZD Finally Turning Bearish?AUDNZD pair turned sharply and impulsively down at the end of 2022, probably for wave A. Since the beginning of 2023, it’s been trading in a correction within a downtrend, ideally in a bigger ABC recovery within wave B, where we were observing subwave C as an ending diagonal/wedge pattern. We were actually tracking final subwave (5) of the wedge pattern within wave C of B that put the top in place, from where we saw a nice and sharp turn south which looks like an impulse into wave 1. So, after recent pullback in wave 2, the price action can resume within wave 3 of a five-wave bearish cycle, especially if we consider a broken lower wedge line.

#1000CHEEMSUSDT is setting up for a breakout Long BINANCE:1000CHEEMSUSDT.P from $0,0014000
🛡 Stop loss $0,0013740
1h Timeframe
⚡ Plan:
➡️ POC is 0,0013254
➡️ Waiting for consolidation near resistance and increased buying activity before the breakout.
➡️ Expecting an impulsive upward move as buy orders accumulate.
🎯 TP Targets:
💎 TP 1: $0.0014380
💎 TP 2: $0.0014700
🚀 BINANCE:1000CHEEMSUSDT.P is setting up for a breakout—preparing for an upward move!

#CAKEUSDT is setting up for a breakout📉 Long BYBIT:CAKEUSDT.P from $2,710
🛡 Stop loss $2,607
1h Timeframe
⚡ Plan:
➡️ POC is 2,515
➡️ Waiting for consolidation near resistance and increased buying activity before the breakout.
➡️ Expecting an impulsive upward move as buy orders accumulate.
🎯 TP Targets:
💎 TP 1: $2,790
💎 TP 2: $2,870
💎 TP 2: $2,920
🚀 BYBIT:CAKEUSDT.P is setting up for a breakout—preparing for an upward move!

EURAUD: Pullback From Support 🇪🇺 🇦🇺
There is a high chance to see a pullback from the underlined support on EURAUD.
As a confirmation, I see a bullish breakout of a resistance line of a falling
wedge pattern on an hourly.
The price may touch at least 1.71575
❤️Please, support my work with like, thank you!❤️

TradingView Idea for EUR/AUD (4H Chart)
Market Overview:
The EUR/AUD 4-hour chart displays a downtrend followed by a consolidation phase at a critical support zone. The price is currently reacting within a demand area, indicating a potential bullish reversal.
Key Levels:
Support Zone: ~1.7050 - 1.7100 (Highlighted in dark grey)
Resistance Zone: ~1.7200 (Short-term)
Target Level: ~1.74217
Potential Trade Scenarios:
Bullish Scenario: If the price holds above the support zone, we could see a rebound towards 1.7200, with further continuation towards the 1.74217 target.
Retest and Breakout: A slight pullback into the support zone, followed by a breakout above 1.7200, could confirm a strong buying momentum.
Bearish Risk: A failure to hold above support may lead to further downside continuation.
Trade Plan:
Entry: Look for bullish confirmation in the demand zone.
Stop Loss: Below the support zone (~1.7050).
Take Profit: First at 1.7200, then 1.74217 for an extended move.
Bias: Bullish if support holds, bearish if price breaks below.

EUR/GBP Technical Analysis - 4H Chart
📌 Pair: EUR/GBP
📈 Current Price: 0.84092
Key Levels:
🔹 Support Zone: 0.83766 - A key area where price has previously bounced.
🔹 Resistance Zone: 0.84400 - A strong resistance level where price has faced rejection.
🔹 Target Level: 0.85004 - Potential bullish target if price breaks above resistance.
Market Structure & Trade Idea:
EUR/GBP has shown strong bullish momentum, breaking above the support zone (0.83766).
Currently, price is testing the resistance level. A slight pullback toward support could provide a new buying opportunity.
A break above resistance would confirm bullish continuation toward 0.85004.
Trading Plan:
✅ Bullish Scenario: Wait for a pullback to 0.83766 before entering long, targeting 0.85004.
✅ Bearish Scenario: If price breaks below 0.83766, a deeper retracement to 0.82652 may follow.
🔍 Watch for:
Breakout confirmation above resistance.
Strong rejection from support before entering a trade.

#NIFTY Intraday Support and Resistance Levels - 18/03/2025Gap up opening expected in nifty. Expected opening near 22700 level. After opening if nifty starts trading above 22750 level then possible strong upside rally upto 22950+ in today's session. Any downside or reversal expected near a 22700 level. Downside 22550 level will act as a strong support for today's session. Major downside only expected below 22500 level.

JPY/USD Price Action & Trade Setup
Market Structure & Trend:
The chart illustrates JPY/USD on the 4-hour timeframe, showing a rising channel pattern.
Price has recently rejected from resistance near 0.0068058 and is now showing signs of a bearish move.
Trade Setup:
Bearish bias: The pair is breaking down from the channel, indicating a potential trend reversal.
Key levels:
Resistance: 0.0068058
Support Zone: 0.0064368 (Target area)
Potential Move: A continuation of this bearish movement may lead to a drop toward the support zone.
Conclusion:
If the price sustains below the midline of the channel, further downside is likely.
A retest of support at 0.0064368 could offer potential opportunities for either a bounce or a continuation of the bearish trend.
📌 What’s next? Watch for price action near the support zone for potential trade setups.

[INTRADAY] #BANKNIFTY PE & CE Levels(18/03/2025)Today will be gap up opening expected in index. After opening if banknifty sustain above 48550 level then possible strong upside rally upto 48950+ level and this rally can be extend for further 400-500+ points in case banknifty starts trading above 49050 level. 48950 level will act as a resistance level for upside rally. Expected reversal from this level. Any major downside only expected below 48450 level.

Nightly $SPY / $SPX Scenarios for March 18, 2025 🔮 🔮
🌍 Market-Moving News 🌍:
🇺🇸🏛️ Federal Reserve Meeting Commences 🏛️: The Federal Open Market Committee (FOMC) begins its two-day policy meeting on March 18, with a decision on interest rates expected on March 19. While markets anticipate that the Fed will maintain current rates between 4.25% and 4.5%, investors will closely monitor the meeting for any signals regarding future monetary policy directions.
🇨🇳📊 China's Economic Data Release 📊: China is set to release key economic indicators, including retail sales and industrial production figures for February. These data points will offer insights into the health of the world's second-largest economy and could have ripple effects on global markets, including the U.S.
📊 Key Data Releases 📊:
📅 Tuesday, March 18:
🏠 Housing Starts (8:30 AM ET) 🏠:This report measures the number of new residential construction projects begun during the month, providing insight into the housing market's strength.
Forecast: 1.31 million units (annualized)
Previous: 1.34 million units
🏢 Building Permits (8:30 AM ET) 🏢:This data indicates the number of permits issued for new construction projects, serving as a leading indicator for future housing activity.
Forecast: 1.35 million units (annualized)
Previous: 1.36 million units
⚠️ Disclaimer: This information is for educational and informational purposes only and should not be construed as financial advice. Always consult with a professional financial advisor before making investment decisions.⚠️
📌 #trading #stockmarket #economy #news #trendtao #charting #technicalanalysis

#1000XUSDT is setting up for a breakout📉 Long BYBIT:1000XUSDT.P from $0,05470
🛡 Stop loss $0,05297
1h Timeframe
⚡ Plan:
➡️ POC is 0,04229
➡️ Waiting for consolidation near resistance and increased buying activity before the breakout.
➡️ Expecting an impulsive upward move as buy orders accumulate.
🎯 TP Targets:
💎 TP 1: $0,05640
💎 TP 2: $0,05775
🚀 BYBIT:1000XUSDT.P is setting up for a breakout—preparing for an upward move!

#MUBARAKUSDT continues its downtrend📉 Short BYBIT:MUBARAKUSDT.P from $0,14040
🛡 Stop loss $0,15196
🕒 1H Timeframe
⚡️ Overview:
➡️ The main POC (Point of Control) is Nan
🎯 TP Targets:
💎 TP 1: $0,12395
💎 TP 2: $0,10611
💎 TP 3: $0,09178
📢 Monitor key levels before entering the trade!
BYBIT:MUBARAKUSDT.P continues its downtrend — watching for further movement!

PepsiCo: A Dividend King at a Discount – Time to Buy?PepsiCo, Inc. (PEP)
- Sector: Consumer Defensive
- What It Does: Produces beverages and snacks, like Pepsi, Frito-Lay, and Quaker products.
Fundamental metrics
- Dividend Yield: ~3.5%
- Payout Ratio: 67.8%
- 5-Year Dividend Growth Rate: 7.2%
- Debt-to-Equity Ratio: 2.05
- Return on Equity (ROE): 50.8%
- Price-to-Earnings (P/E) Ratio: 18.9
- Price-to-Book (P/B) Ratio: 11.6
- Analyst Average Price Target: $167.00
- Consecutive Years of Dividend Increases: 53
--------------------------
Technical Factors
The stock is currently experiencing its largest correction since the COVID flash crash, with the last major downturn occurring during the 2008 financial crisis. In such a rare scenario, it's worth considering adding one of the top Dividend Kings to your portfolio.
These companies, with a track record of increasing dividends for 50 consecutive years, tend to be financially stable and reliable, making them an attractive option during market corrections. Their consistent dividend payouts offer a solid income stream, providing a level of security in uncertain times.
Criteria:
- Mid-round number at $150, acting as a psychological level
- Channel projection from the top, aligning with the price structure
- Equal waves from the top, suggesting symmetry in the correction
- Previous resistance levels turning into support, reinforcing the zone
- A key trendline inside the marked box, the last missing touch
The price has already met most of these criteria, except for the trendline, and it has rejected upwards twice from this zone. That’s why this level presents a solid long-term opportunity to consider an entry from current levels.
Make sure to conduct your own fundamental research to ensure the investment aligns with your investment thesis. While I can provide a technical "green light," it’s crucial to confirm that it also fits with the underlying fundamentals.
Before you leave - Like & Boost if you find this useful! 🚀
Trade smart,
Vaido
